-
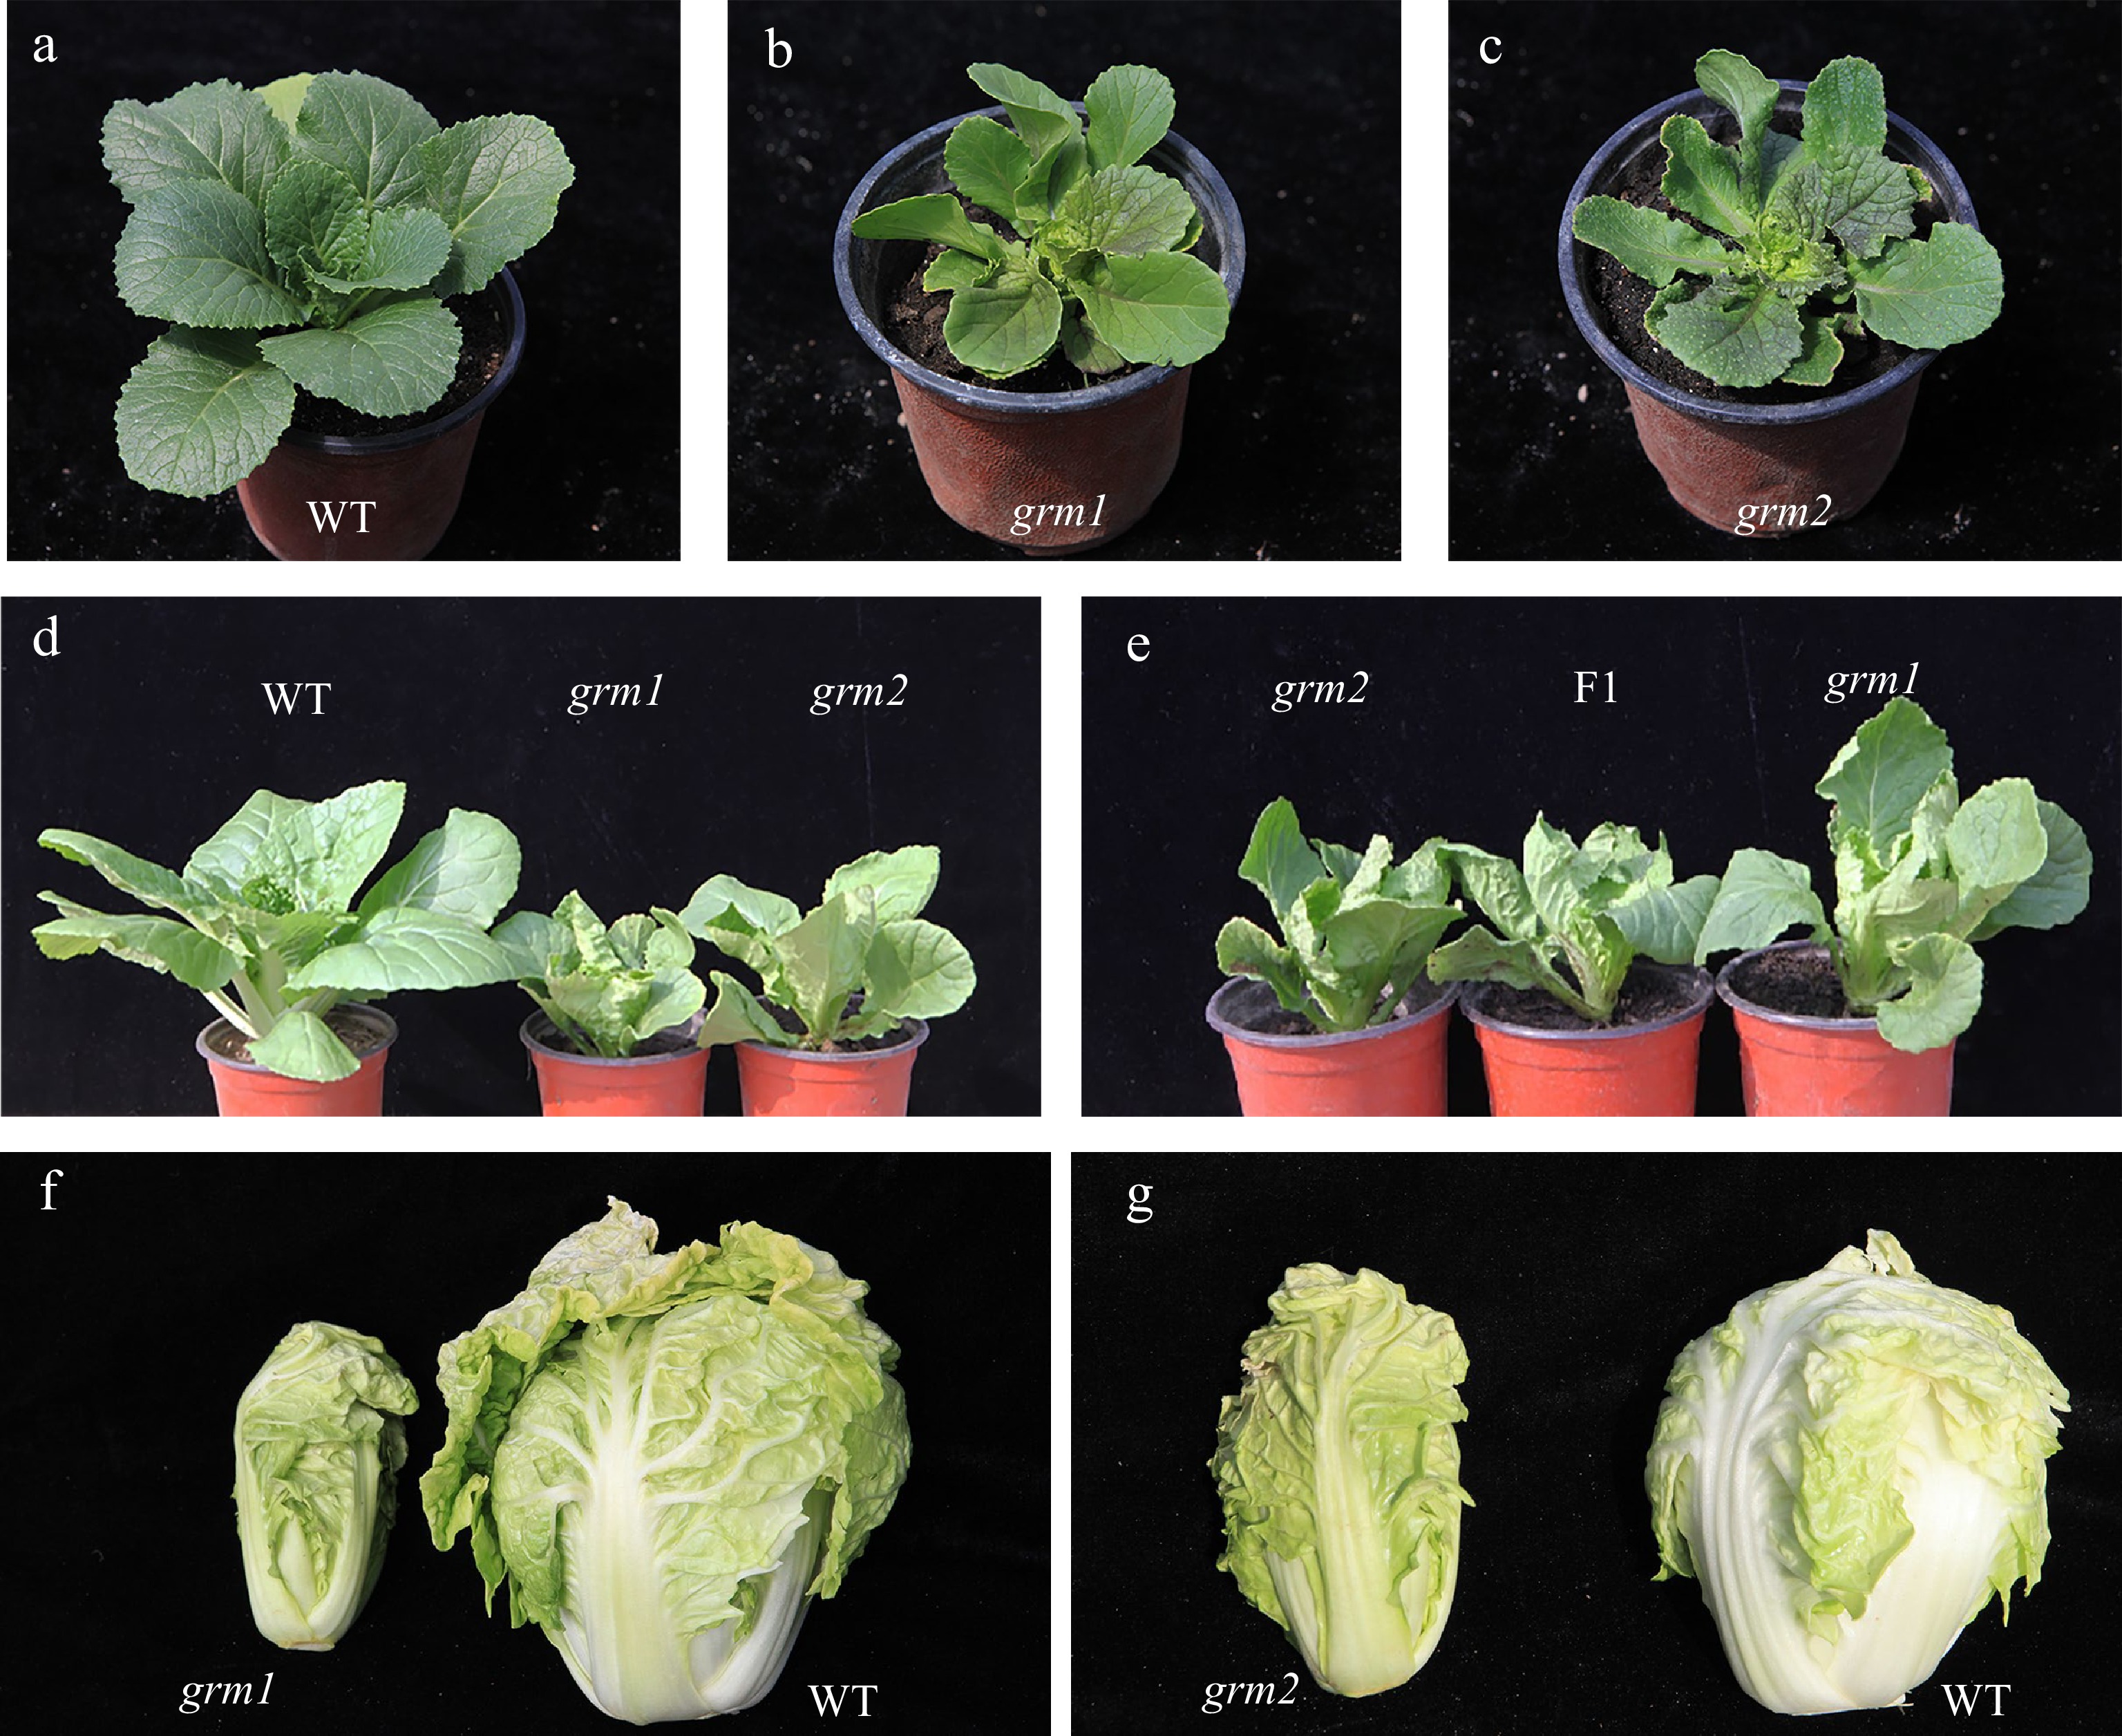
Figure 1.
Phenotypic characterization of the wild-type 'FT' and grm1 and grm2 mutants. (a) The wild-type 'FT' at seedling stage. (b) grm1 at seedling stage. (c) grm2 at seedling stage. (d) The phenotype of 'FT' (left), grm1 (middle), and grm2 (right) at rosette stage. (e) The phenotype of grm2 (left), F1 (middle, grm2 × grm1), and grm1 (right) at rosette stage. (f) Leafy heads of the grm1 (left) and wild-type 'FT' (right). (g) Leafy heads of the grm2 (left) and wild-type 'FT' (right).
-
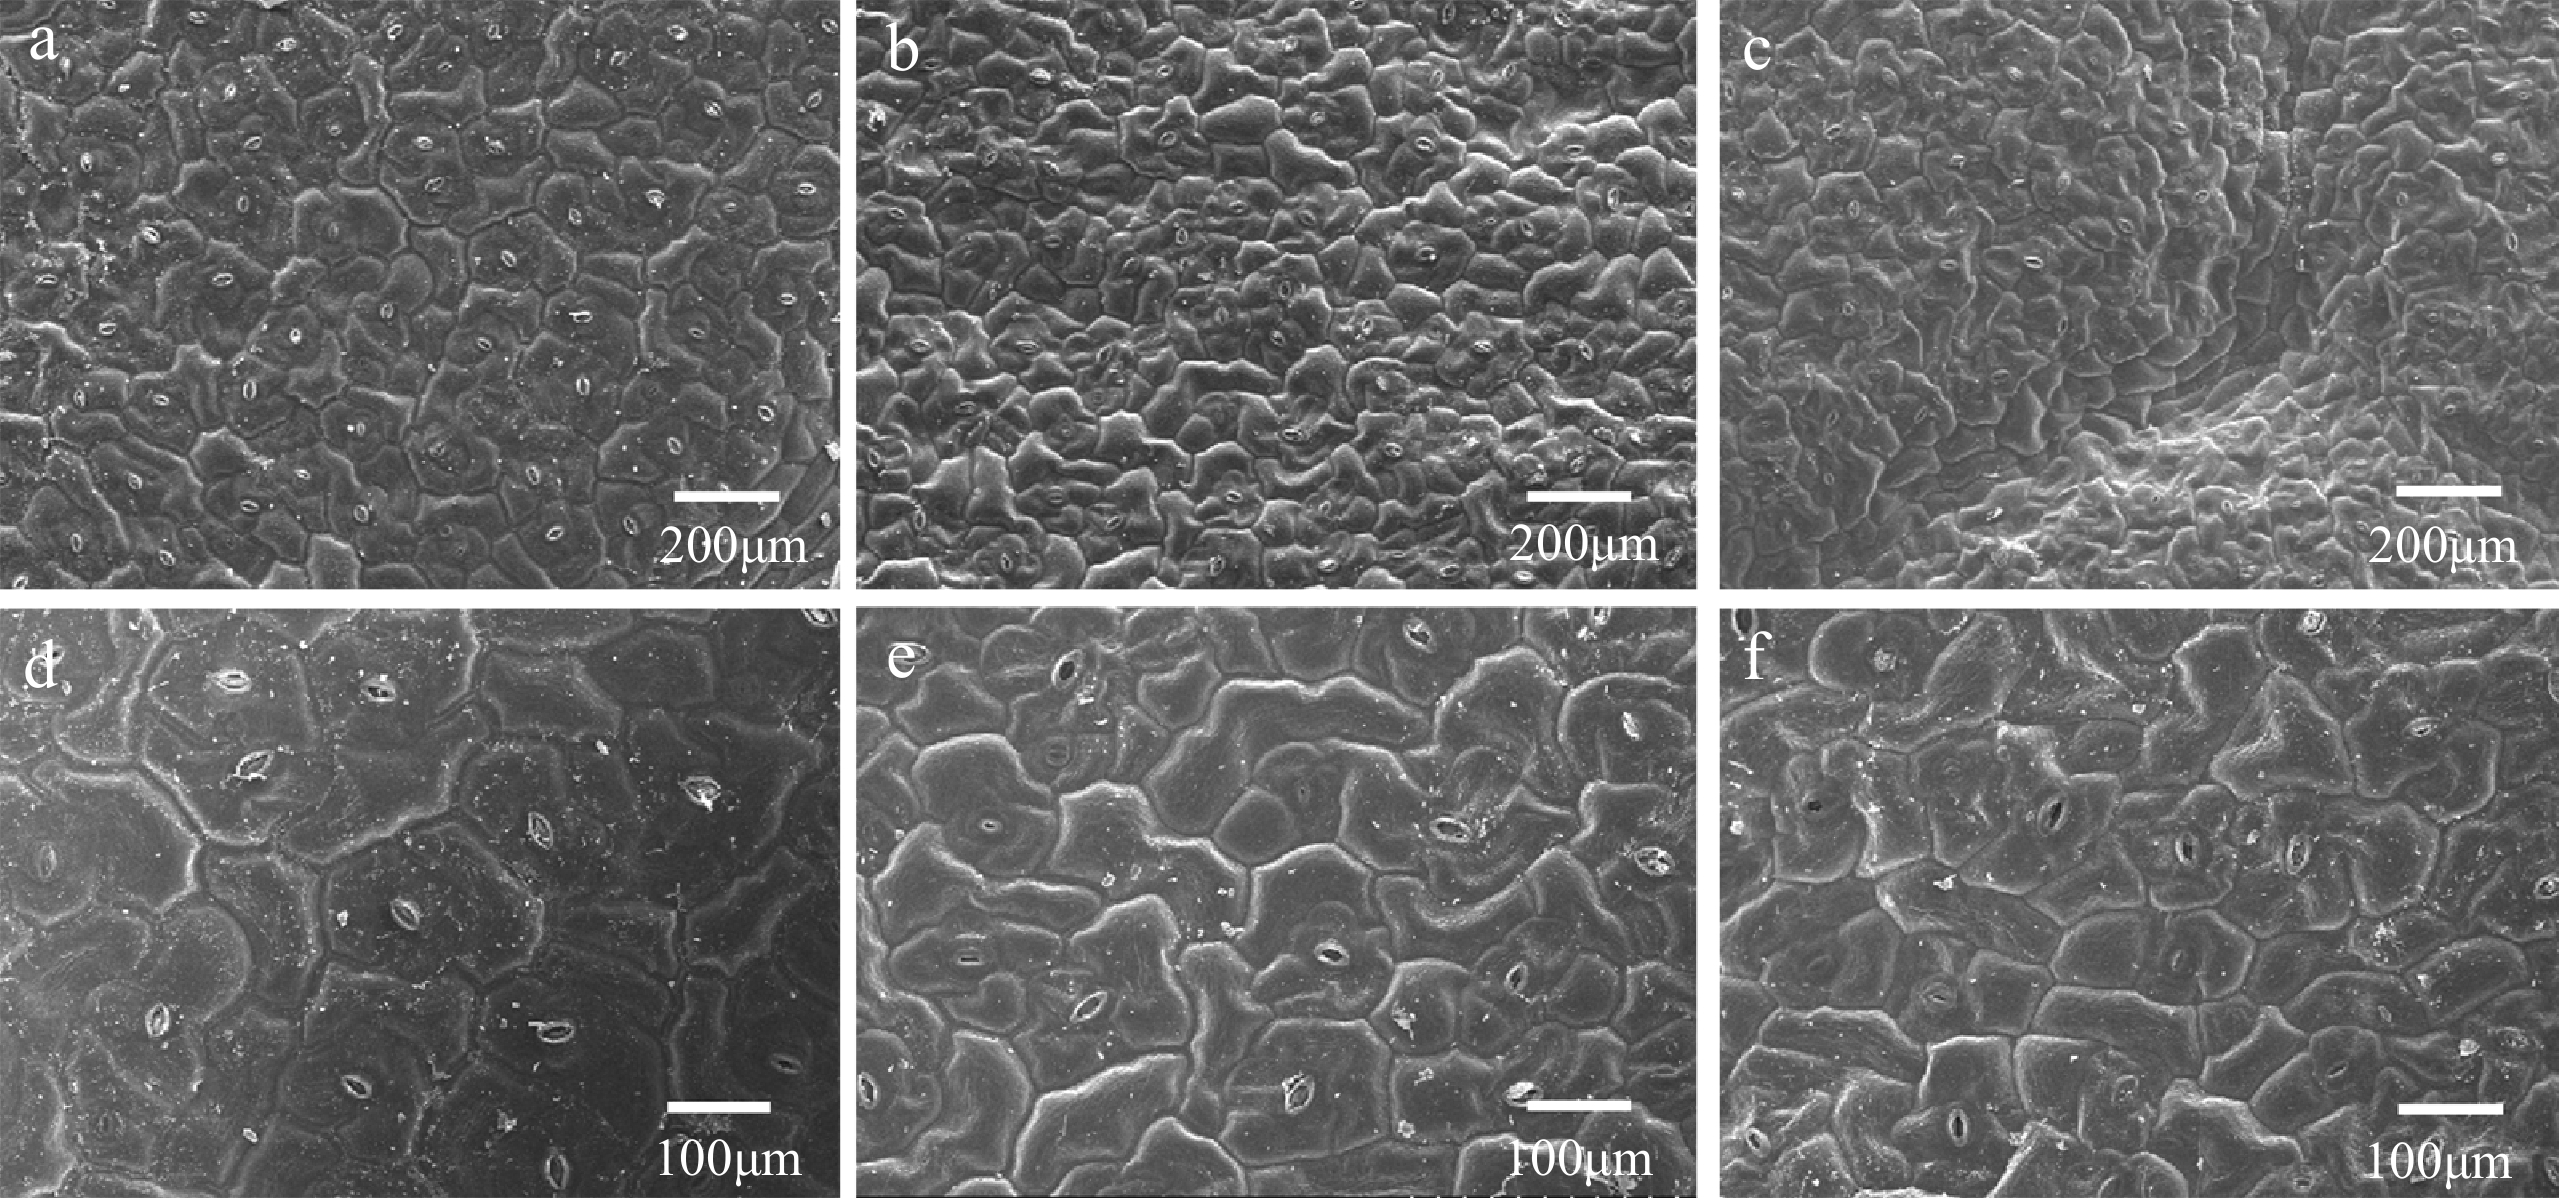
Figure 2.
Observation of the leaf epidermal cells by scanning electron microscopy (SEM). (a) 'FT' at 200 μm, (b) grm1 at 200 μm, (c) grm2 at 200 μm, (d) 'FT' at 100 μm, (e) grm1 at 100 μm, (f) grm2 at 100 μm.
-
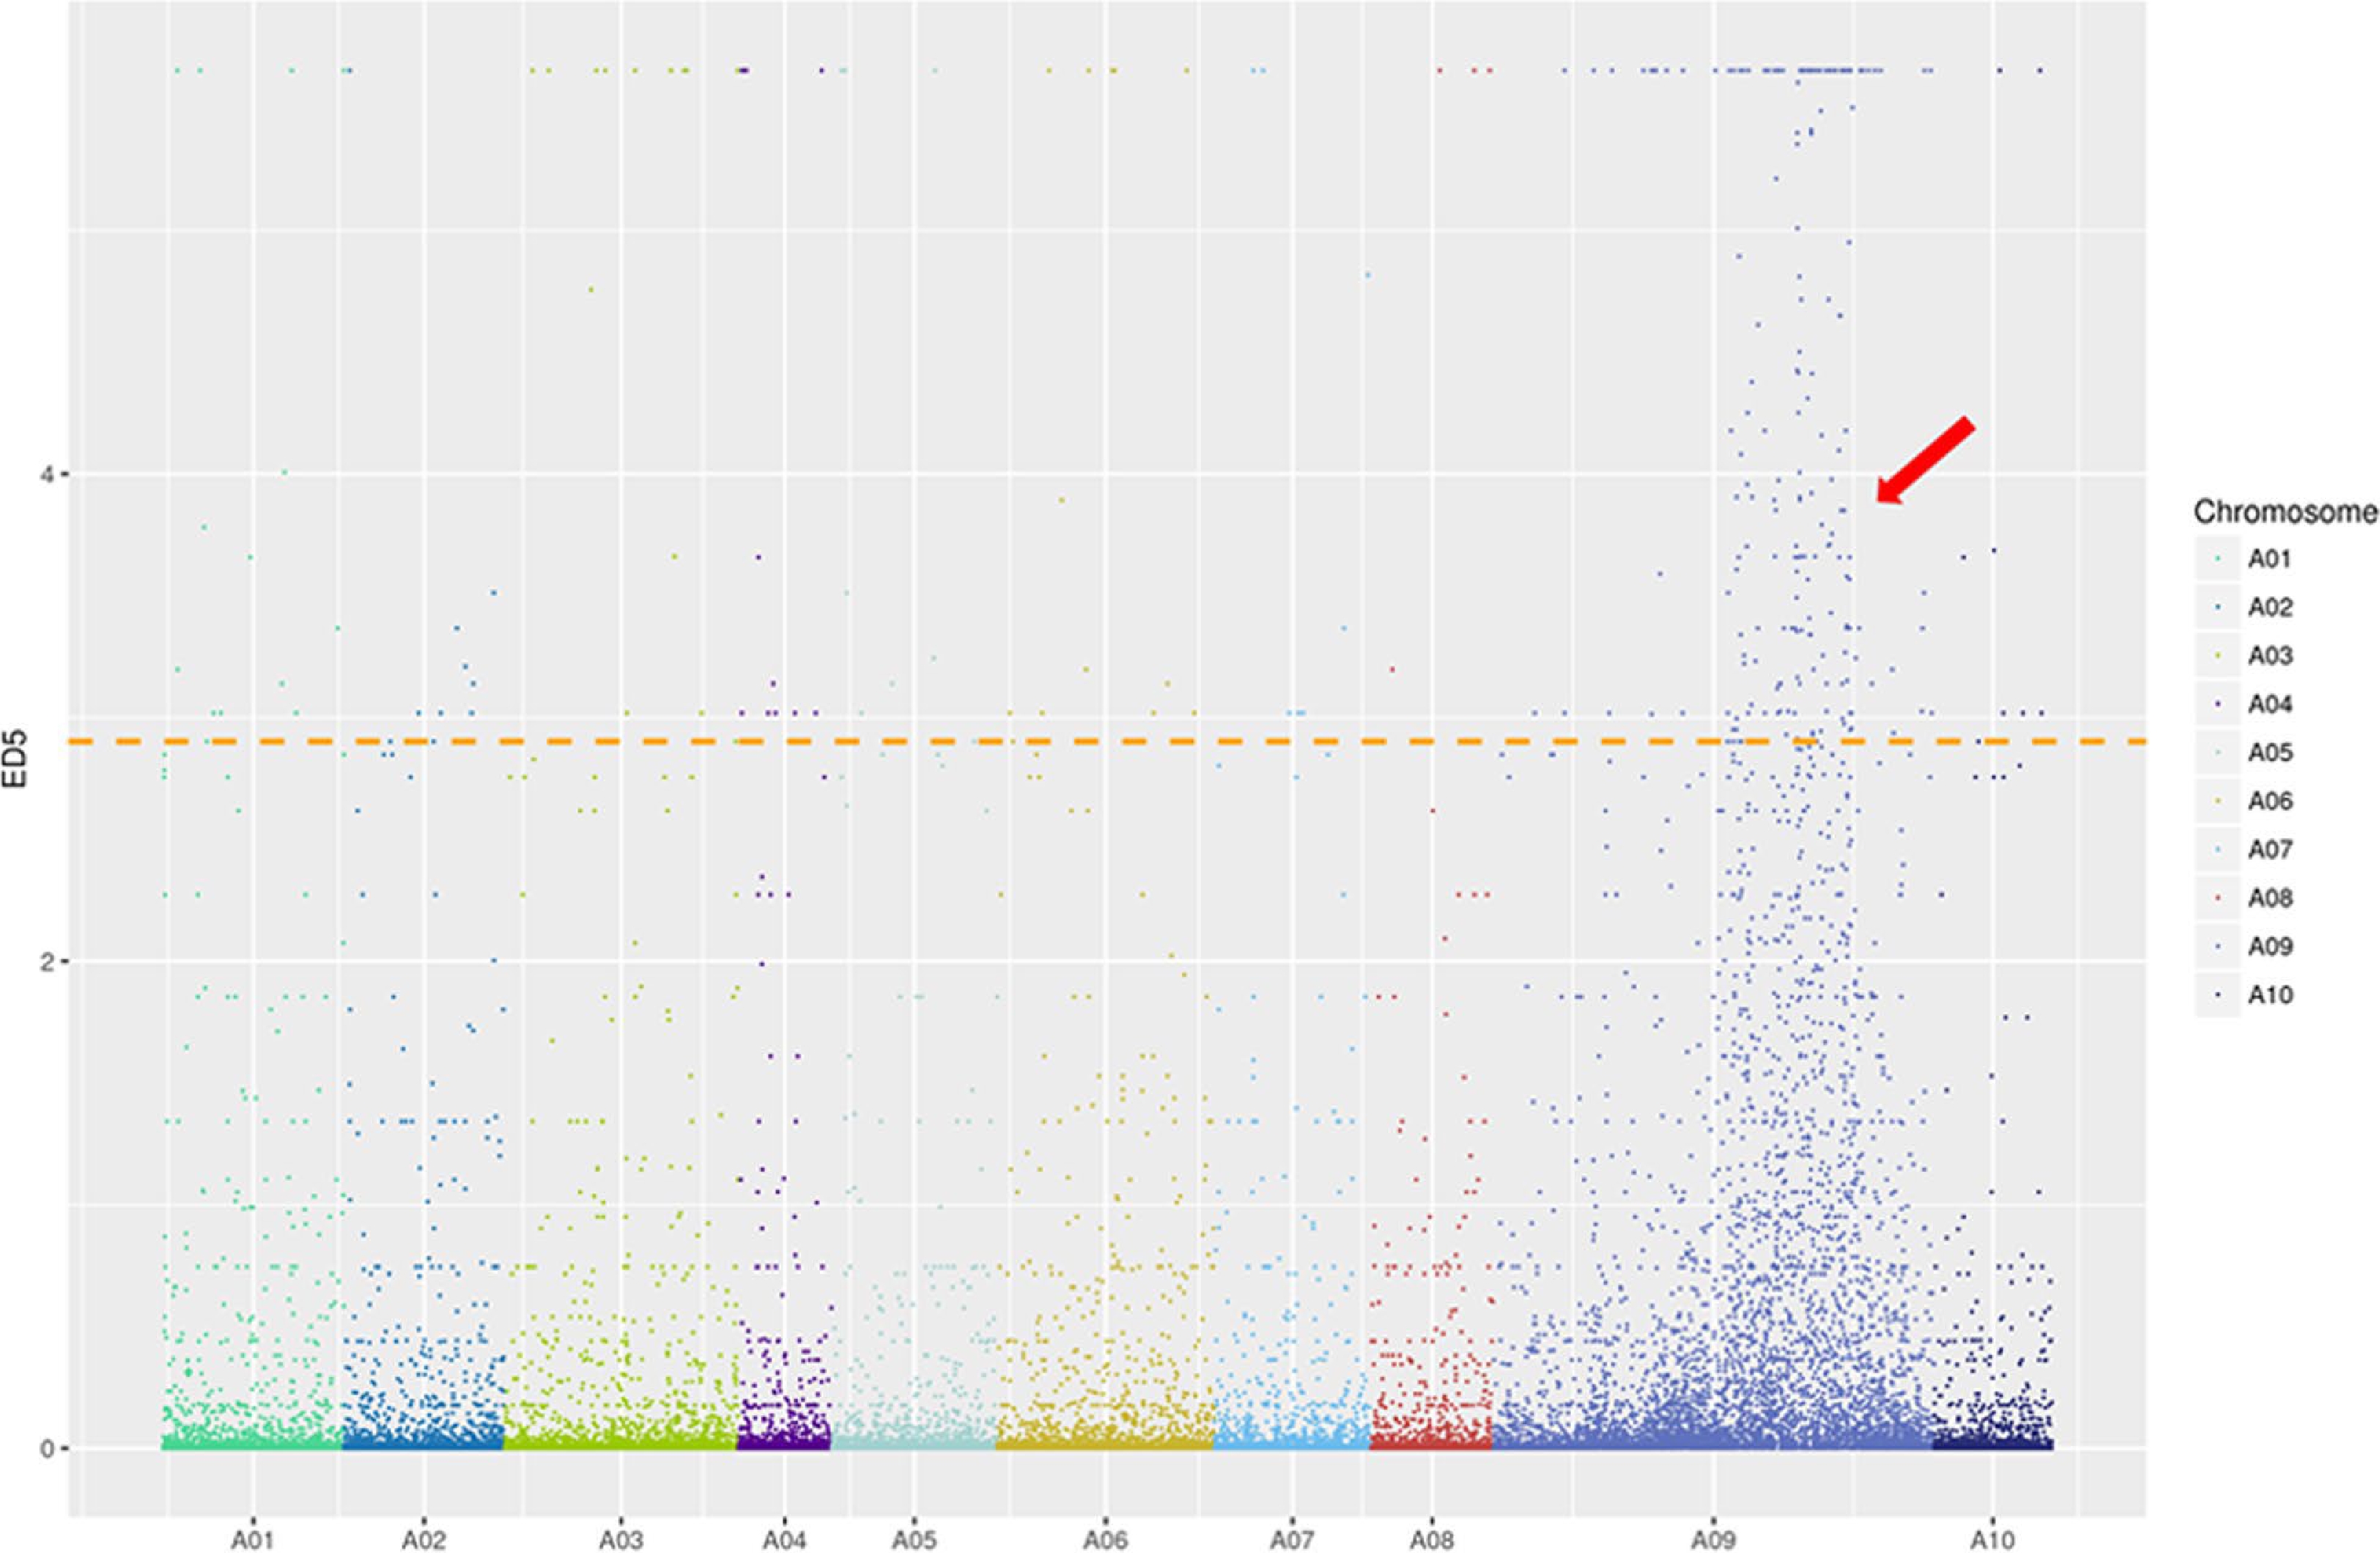
Figure 3.
ED5 (Euclidean distance to the power of 5) distribution of filtered single nucleotide polymorphisms (SNPs) on chromosomes based on bulked segregant RNA-seq (BSR-Seq). Note: X-axis represents the chromosome in Brassica rapa and Y-axis represents the ED5 values of filtered SNPs. The horizontal line is the correlation threshold of the top 1%.
-
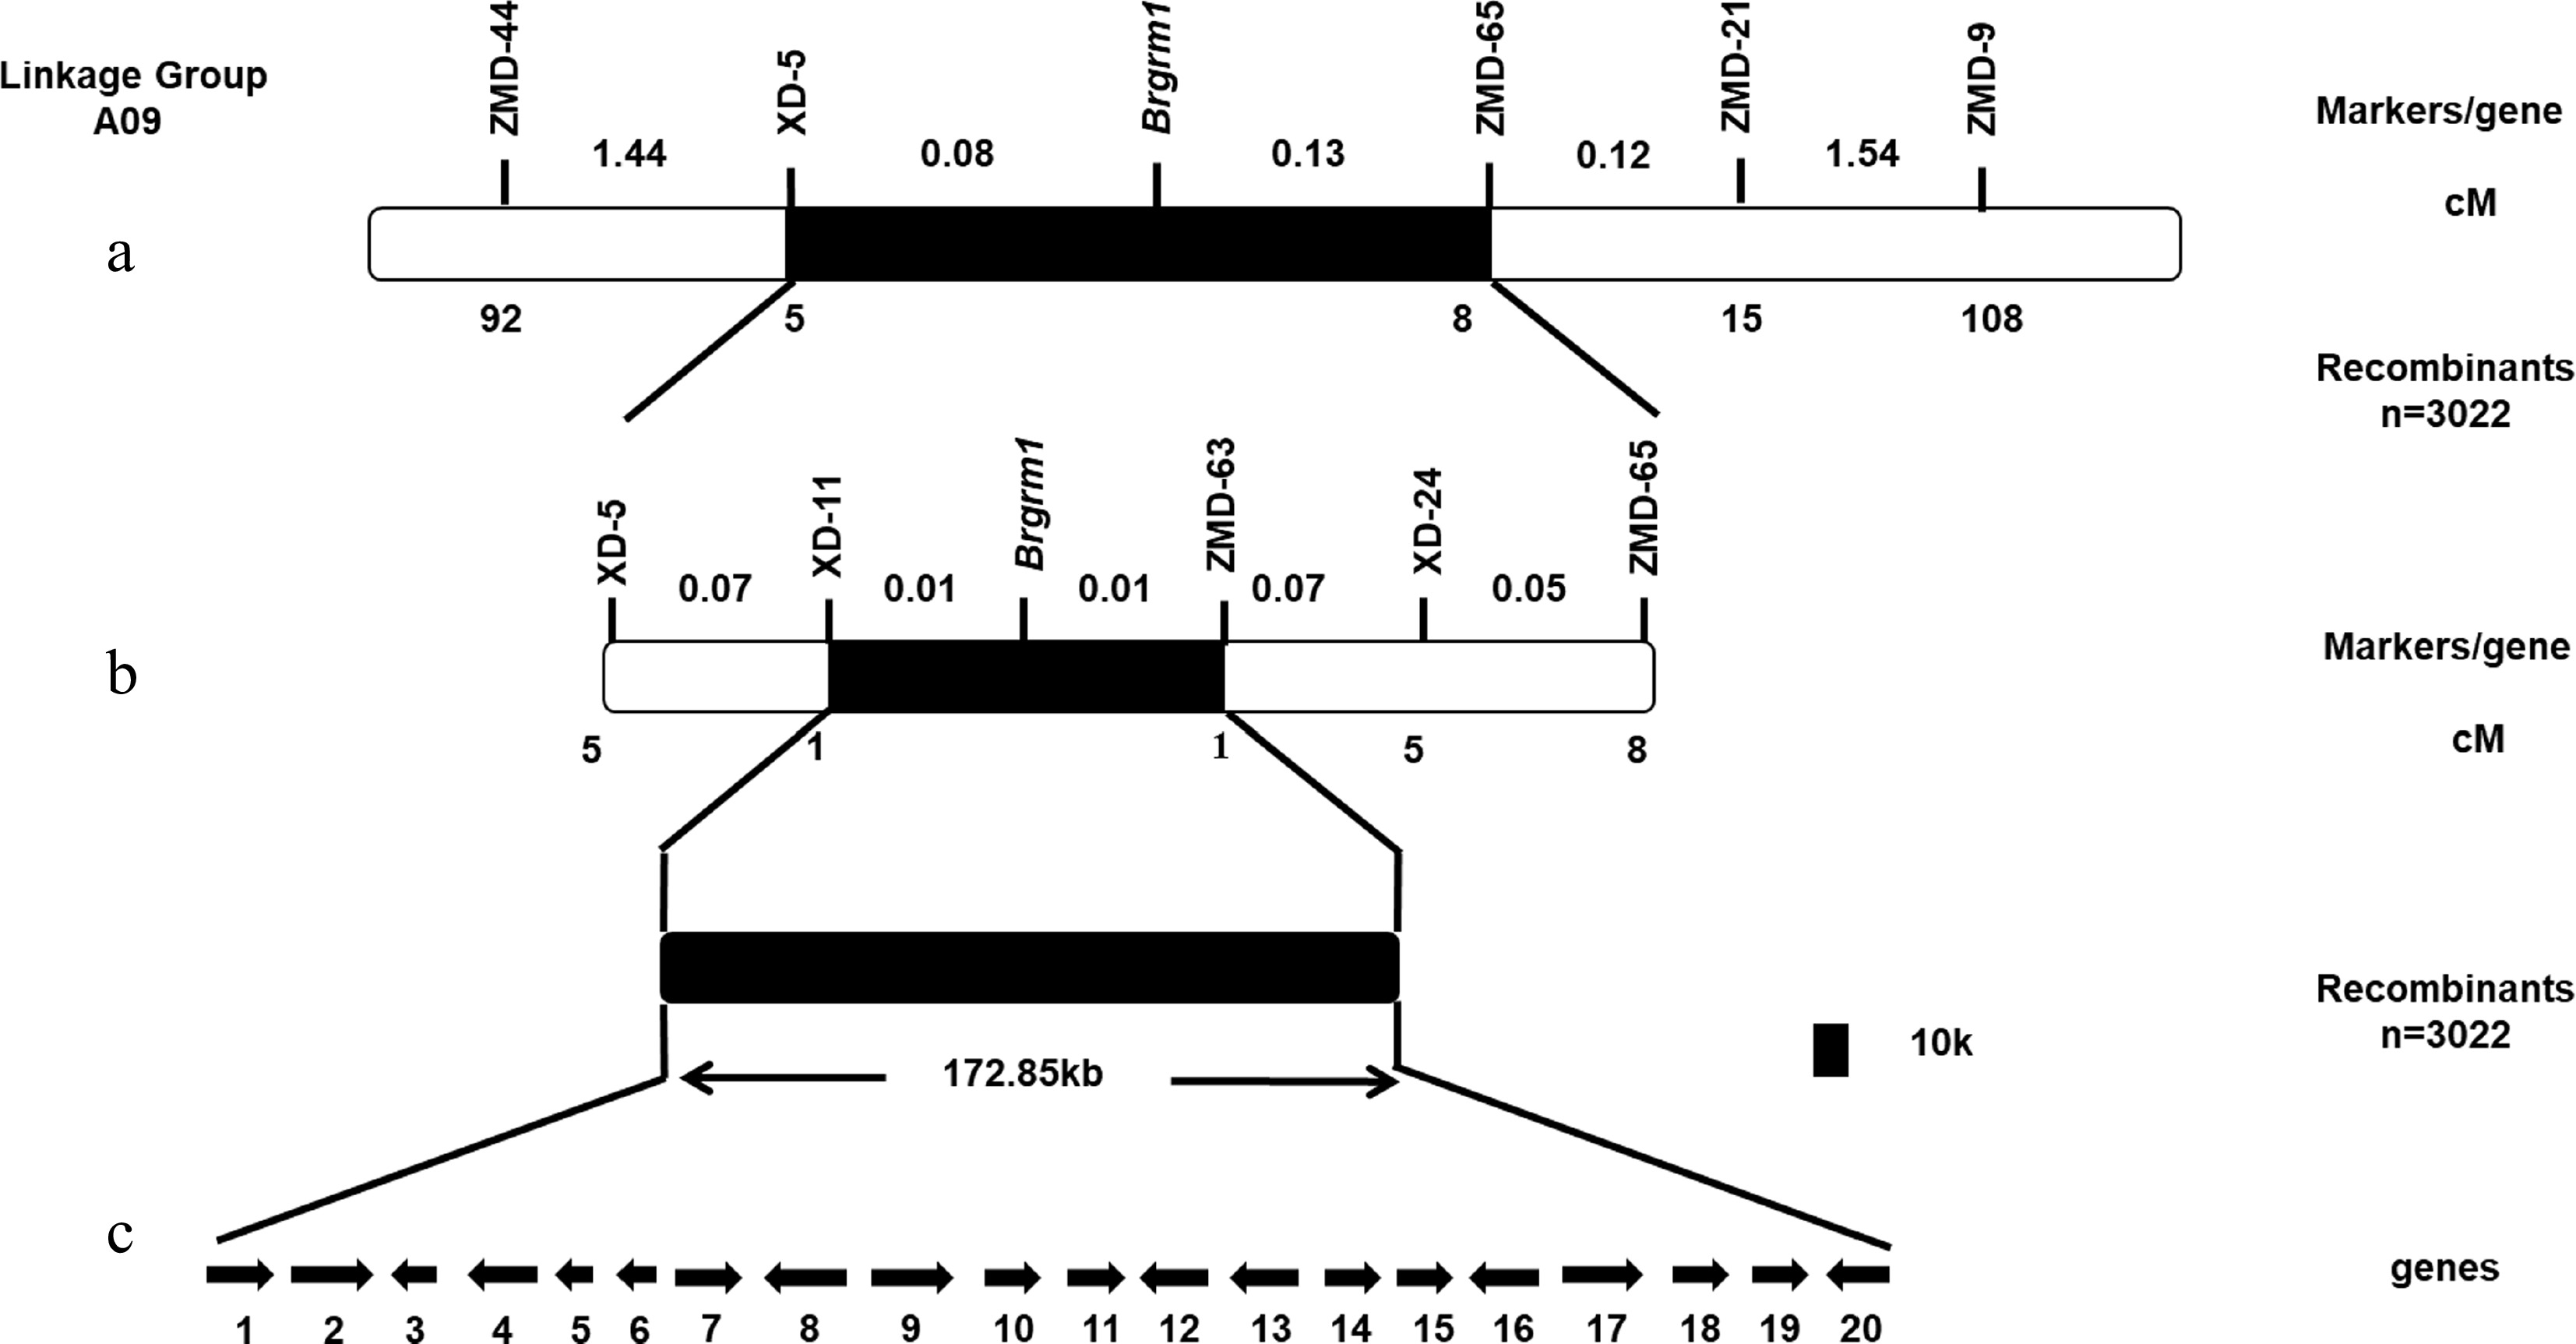
Figure 4.
Construction of genetic and physical maps of Brgrm1 and analysis of candidate genes. (a) Preliminary mapping of Brgrm1. (b) Fine mapping of Brgrm1. (c) Candidate gene analysis in target region. Arrows indicate the direction of gene transcription.
-
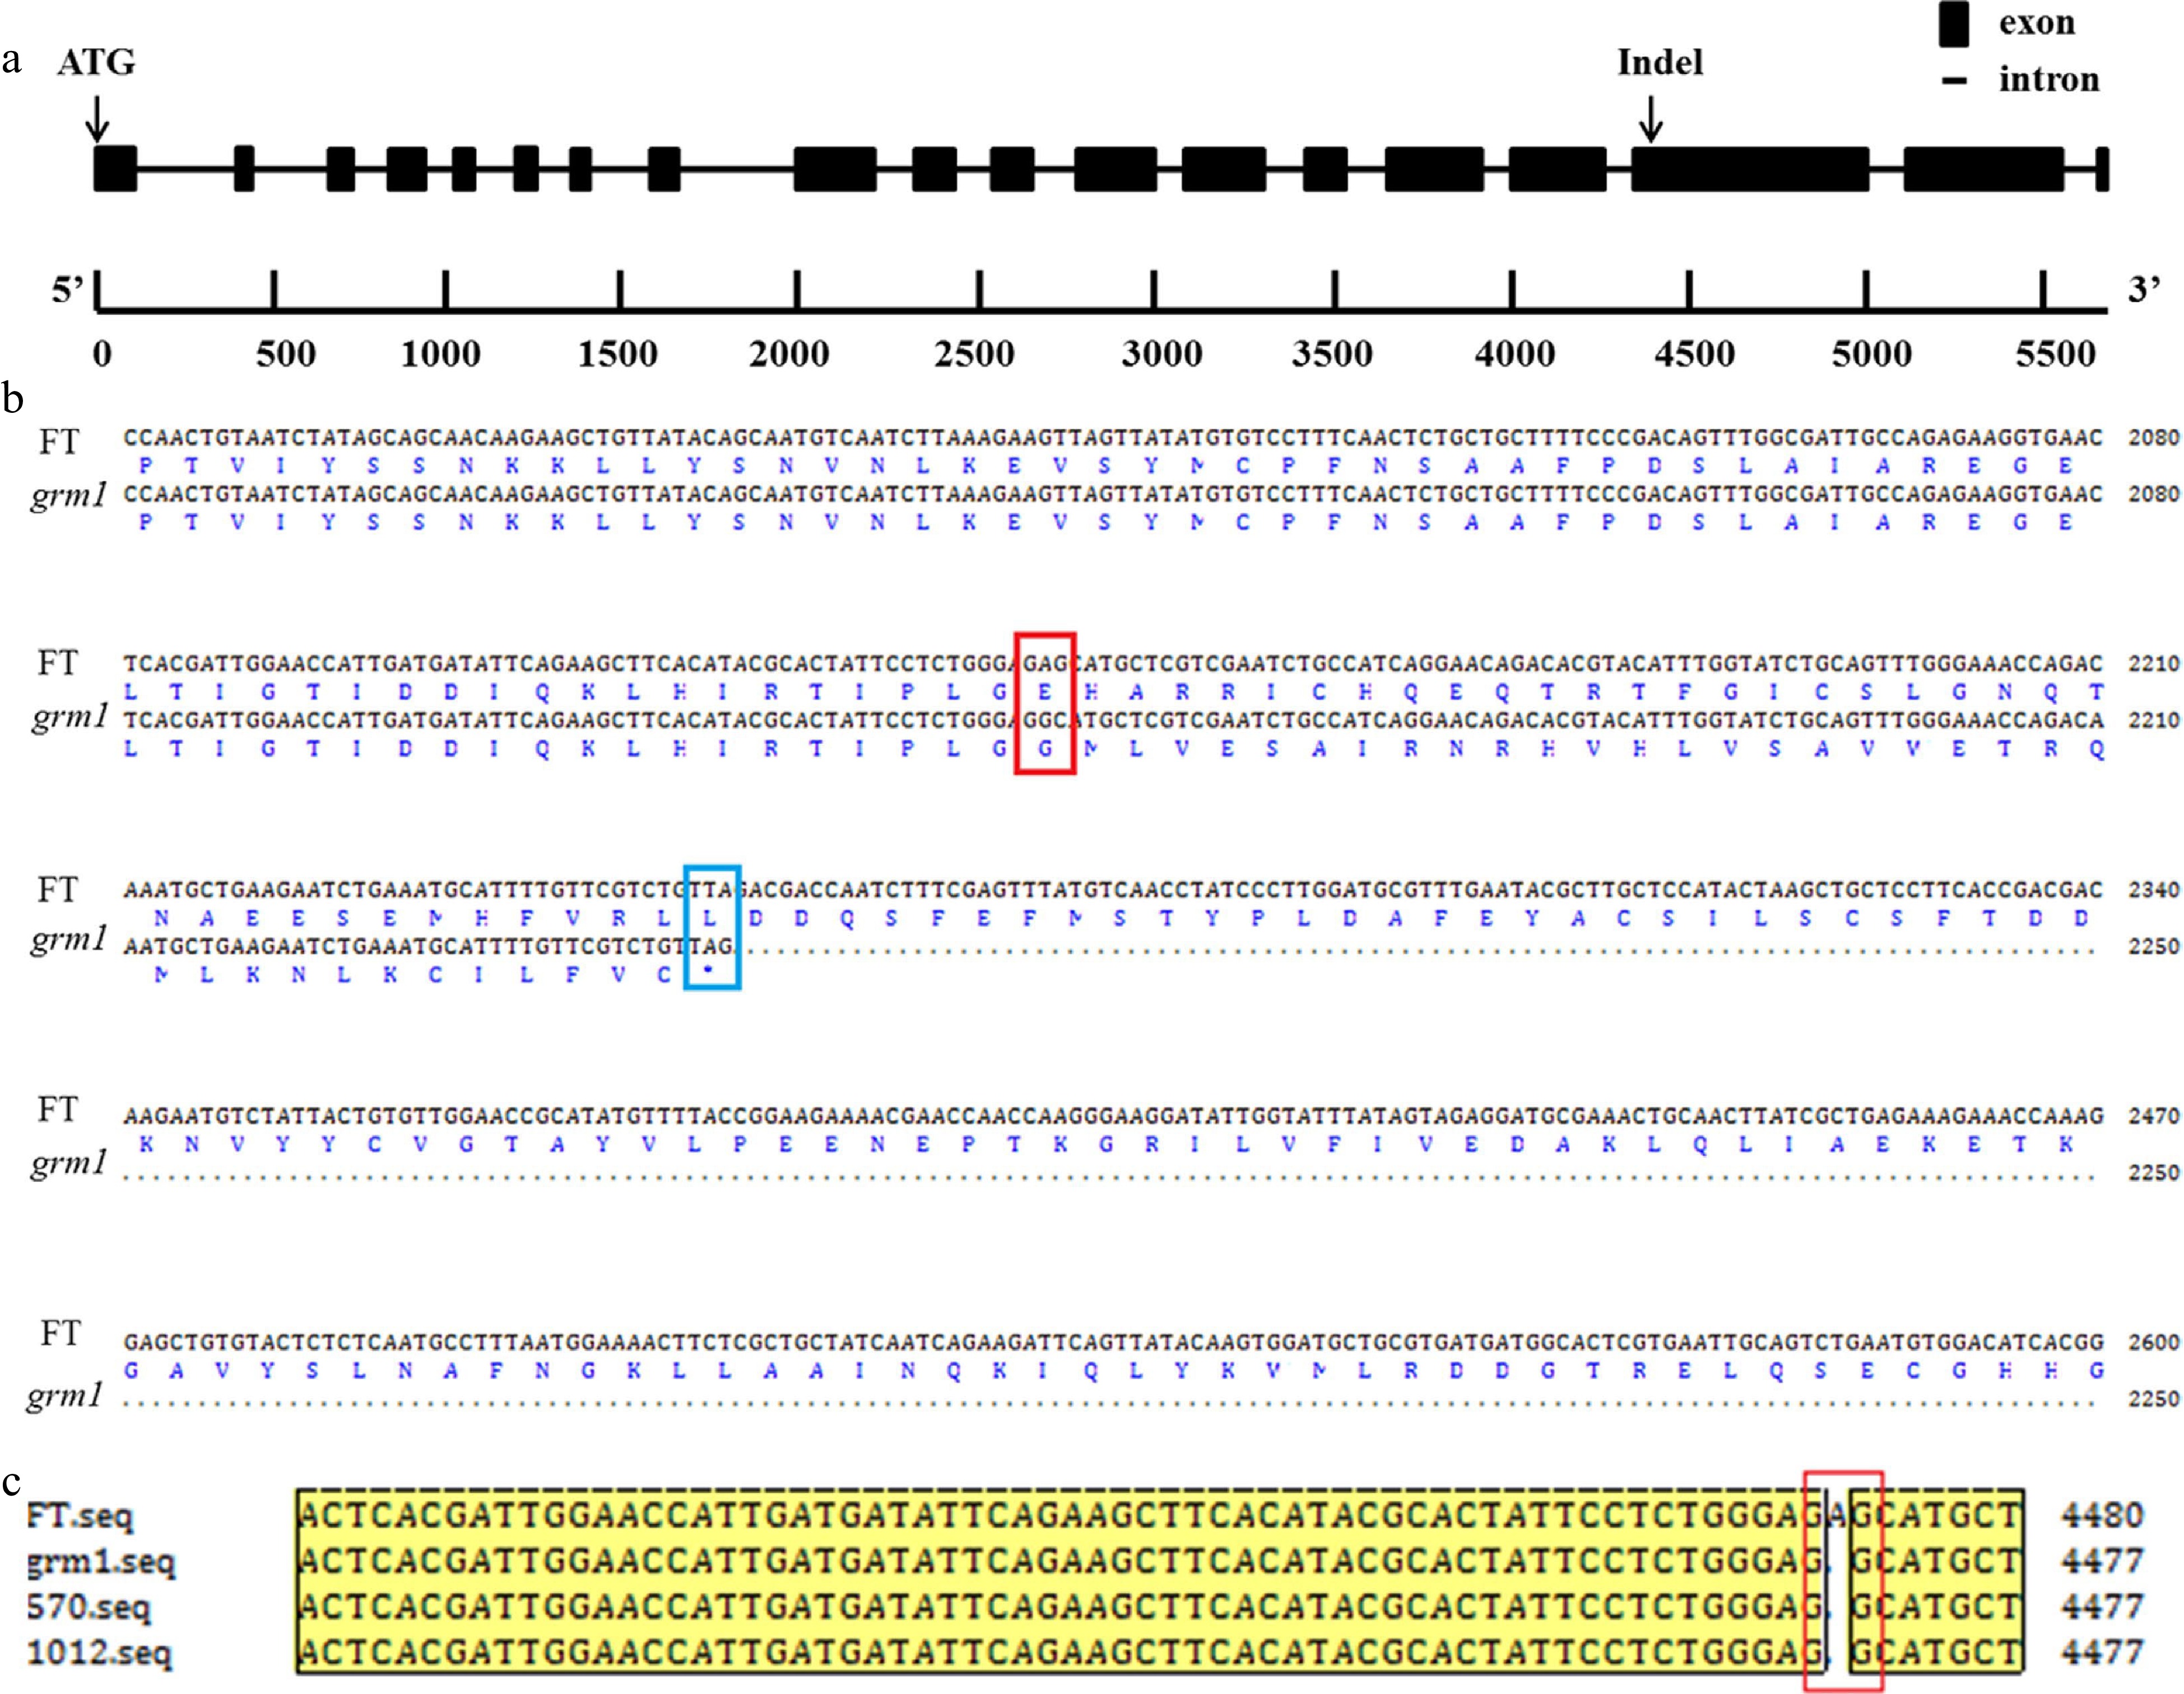
Figure 5.
Gene structure and amino acid sequence alignment. (a) Gene structure of BraA09g024830.3C with an insertion/deletion (InDel). (b) Alignment of nucleotide sequence and amino acid sequence of BraA09g024830.3C from 'FT' and grm1 mutant. The site created by the non-synonymous single nucleotide polymorphism (SNP) is shown by a red empty box and the coding termination is shown by a blue empty box. (c) Alignment of BraA09g024830.3C with nucleotide sequences in the two F2 recombinants, the grm1 mutant, and 'FT'. Note: the two F2 recombinants were from the most closely linked markers, XD-11 and ZMD-63.
-
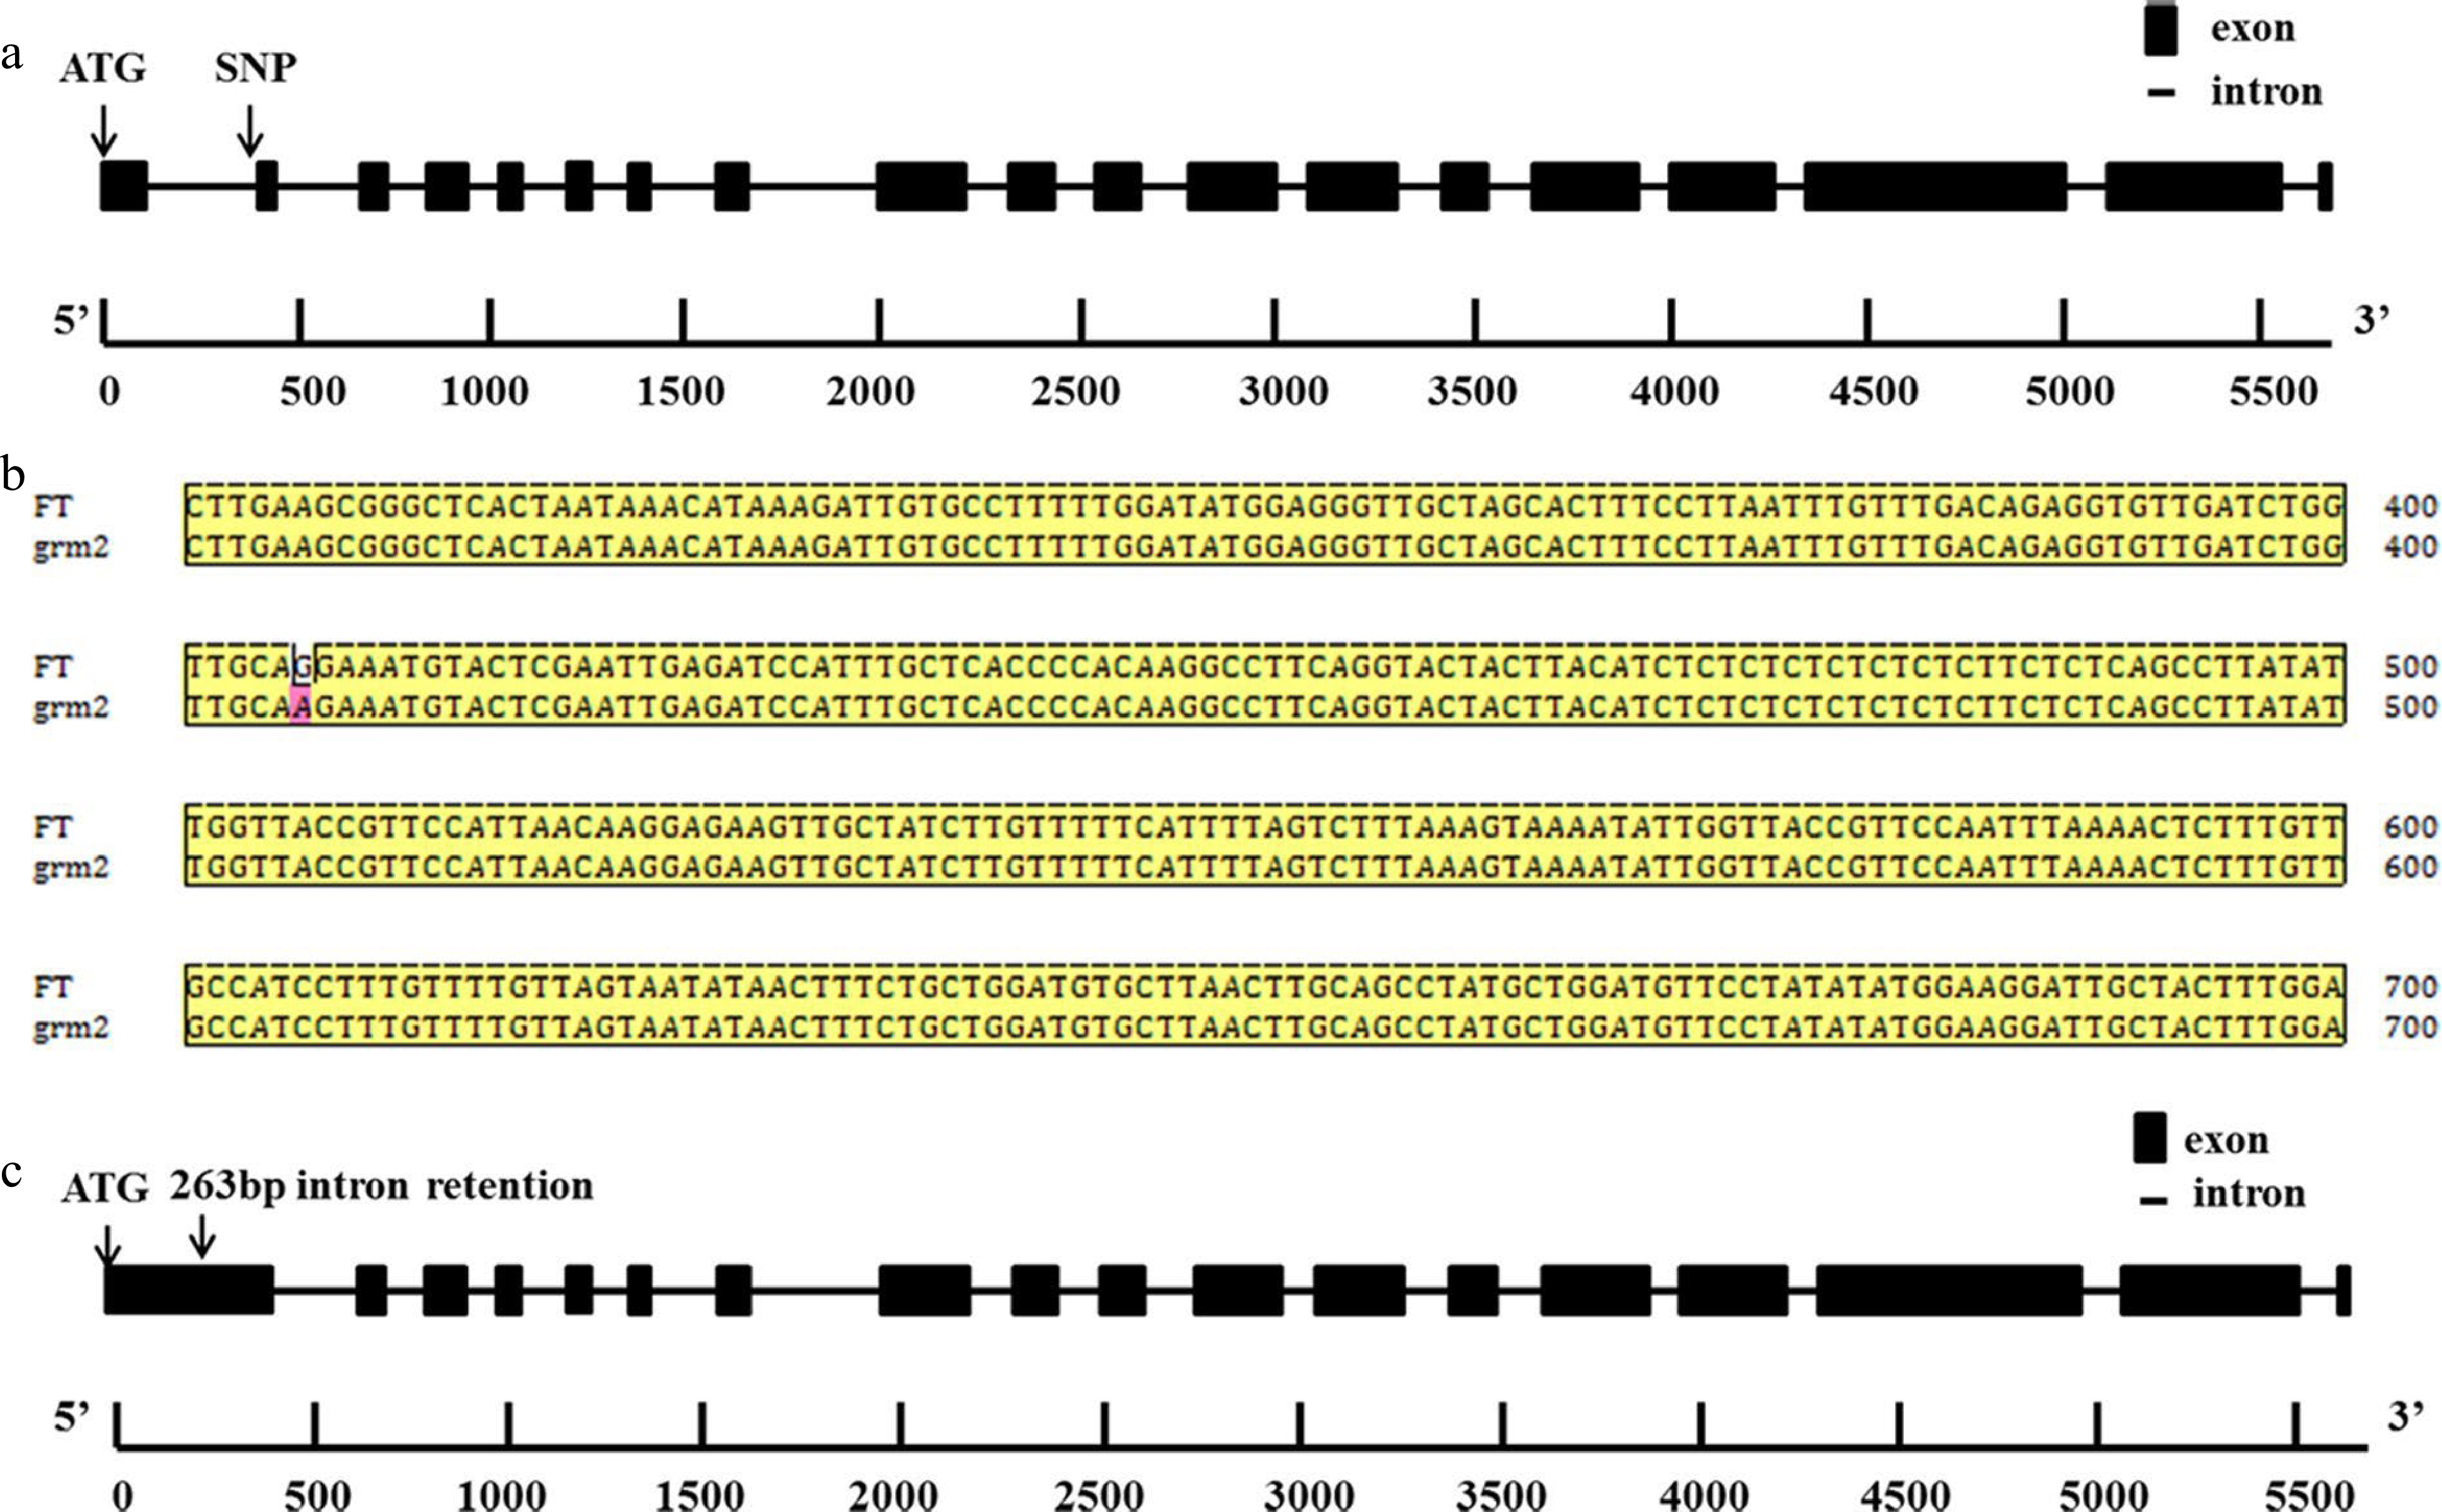
Figure 6.
Gene structure and nucleotide sequence alignment. (a) Gene structure of BrDDB1A in grm2 with a single nucleotide polymorphism (SNP). (b) Nucleotide sequence alignment of BrDDB1A.3C in 'FT' and grm2 mutant. c 263-bp intron retention occurred in the first intron of BrDDB1A in the grm2 mutant.
-
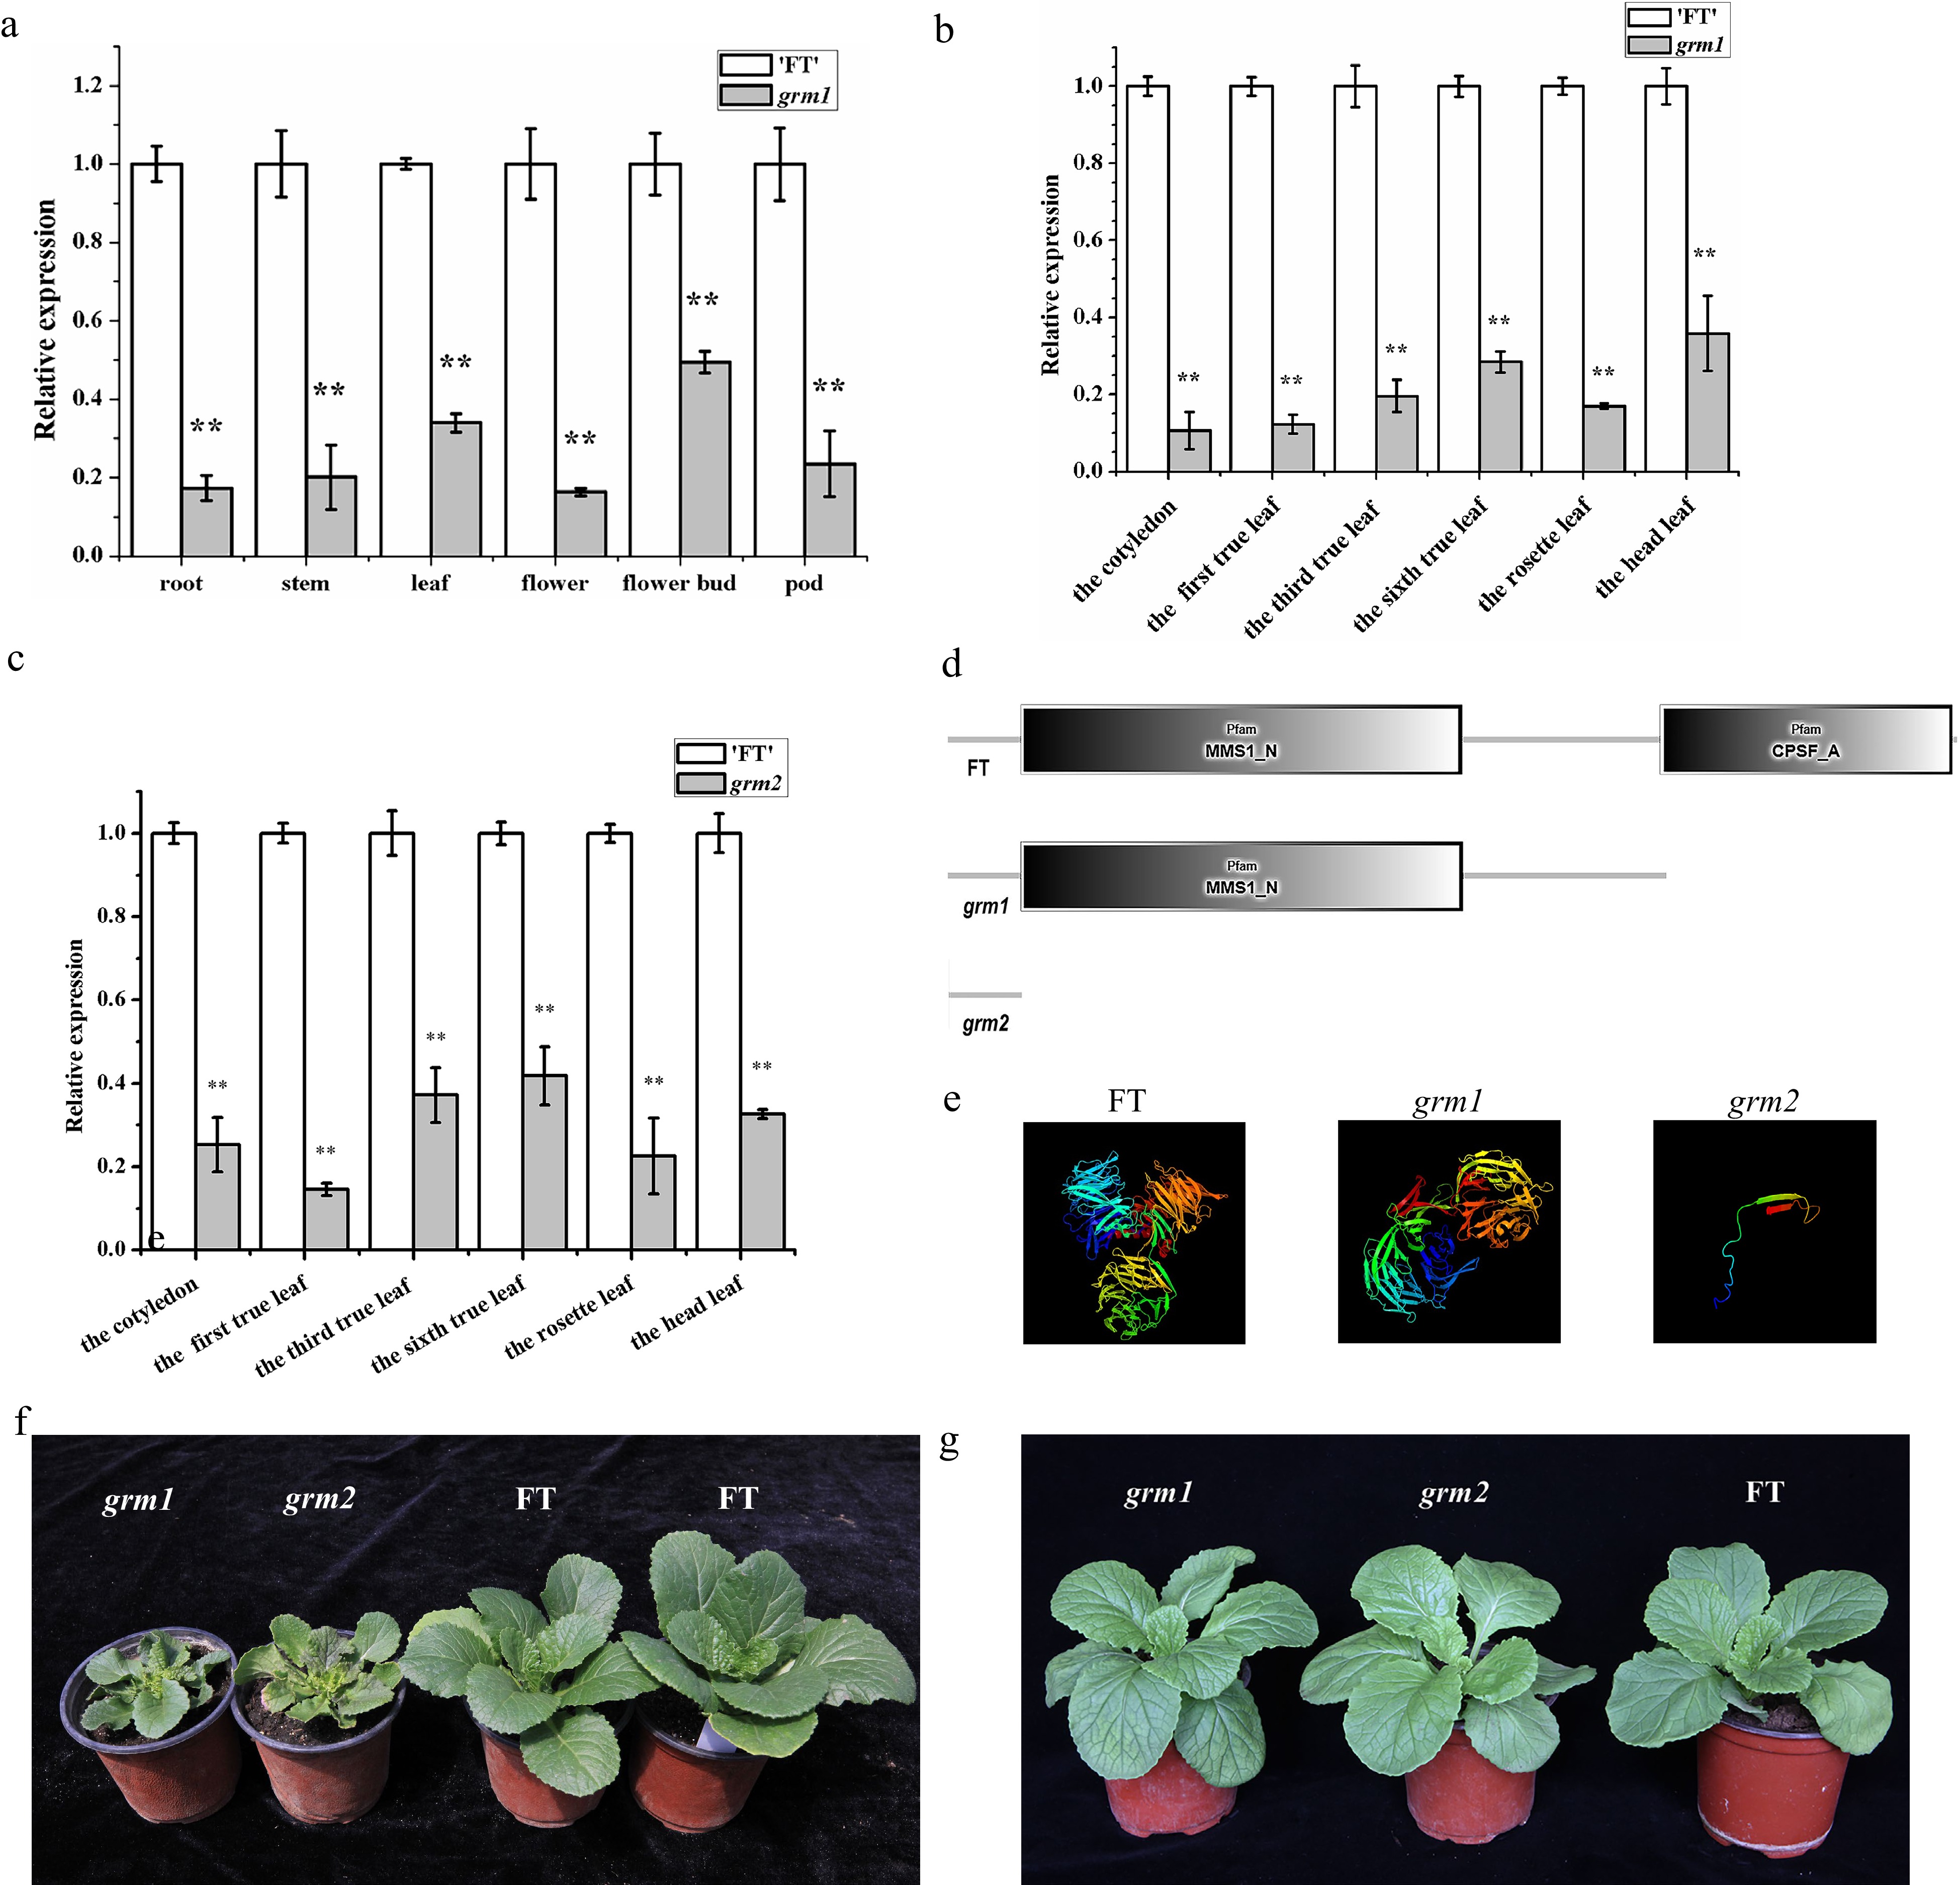
Figure 7.
The expression and protein analyses of BrDDB1A. (a) The expression pattern of BrDDB1A from different organs of 'FT' and grm1. (b) The expression pattern of BrDDB1A at different developmental periods from 'FT' and grm1 leaves. (c) The expression pattern of BrDDB1A at different developmental periods from 'FT' and grm2 leaves. Asterisks indicate significant differences among grm1, grm2 and 'FT' (t test, P < 0.05). (d) The analyses of conserved domains of BrDDB1A in 'FT', grm1, and grm2. (e) Protein tertiary structure of BrDDB1A in 'FT', grm1, and grm2. (f) The wild-type 'FT', grm1 and grm2 plants were cultured in the greenhouse with 1.89 mW/cm2 UV radiation. (g) The wild-type 'FT', grm1 and grm2 plants were cultured indoors with 0.01 mW/cm2 UV radiation.
-
Characteristics 'FT' grm1 grm2 Mean of head weight (kg) 0.41 ± 0.05 0.10 ± 0.00* 0.16 ± 0.03* Mean of head length (cm) 12.73 ± 0.68 11.14 ± 0.11* 11.71 ± 0.32* Mean of head width (cm) 9.22 ± 0.82 5.88 ± 0.07* 6.35 ± 0.29* Mean of head length/head
width ratio1.38 ± 0.09 1.89 ± 0.01* 1.84 ± 0.05* Table 1.
Identification of agronomic characters in grm1, grm2 and wild-type 'FT' at the heading stage
-
Generation Total 'FT' grm1 Segregation ratio χ2 P1 ('FT') 50 50 0 P2 (grm1) 50 0 50 F1 (P1 × P2) 50 50 0 F1 (P2 × P1) 50 50 0 BC1 (F1 × 'FT') 90 90 0 BC1 (F1×grm1) 106 61 45 1.356:1 2.424 F2 553 423 130 3.254:1 0.699 Table 2.
Genetic analysis of the grm1 mutant.
-
Generation Total 'FT' grm2 Segregation ratio χ2 P1 ('FT') 50 50 0 P2 (grm2) 50 01 50 1 F1 (P1 × P2) 50 50 0 F1 (P2 × P1) 50 50 0 BC1 (F1 × 'FT') 100 100 0 BC1 (F1 × grm2) 150 78 72 1.083:1 0.24 F2 300 231 69 3.348:1 0.682 Table 3.
Genetic analysis of the grm2 mutant.
Figures
(7)
Tables
(3)