-
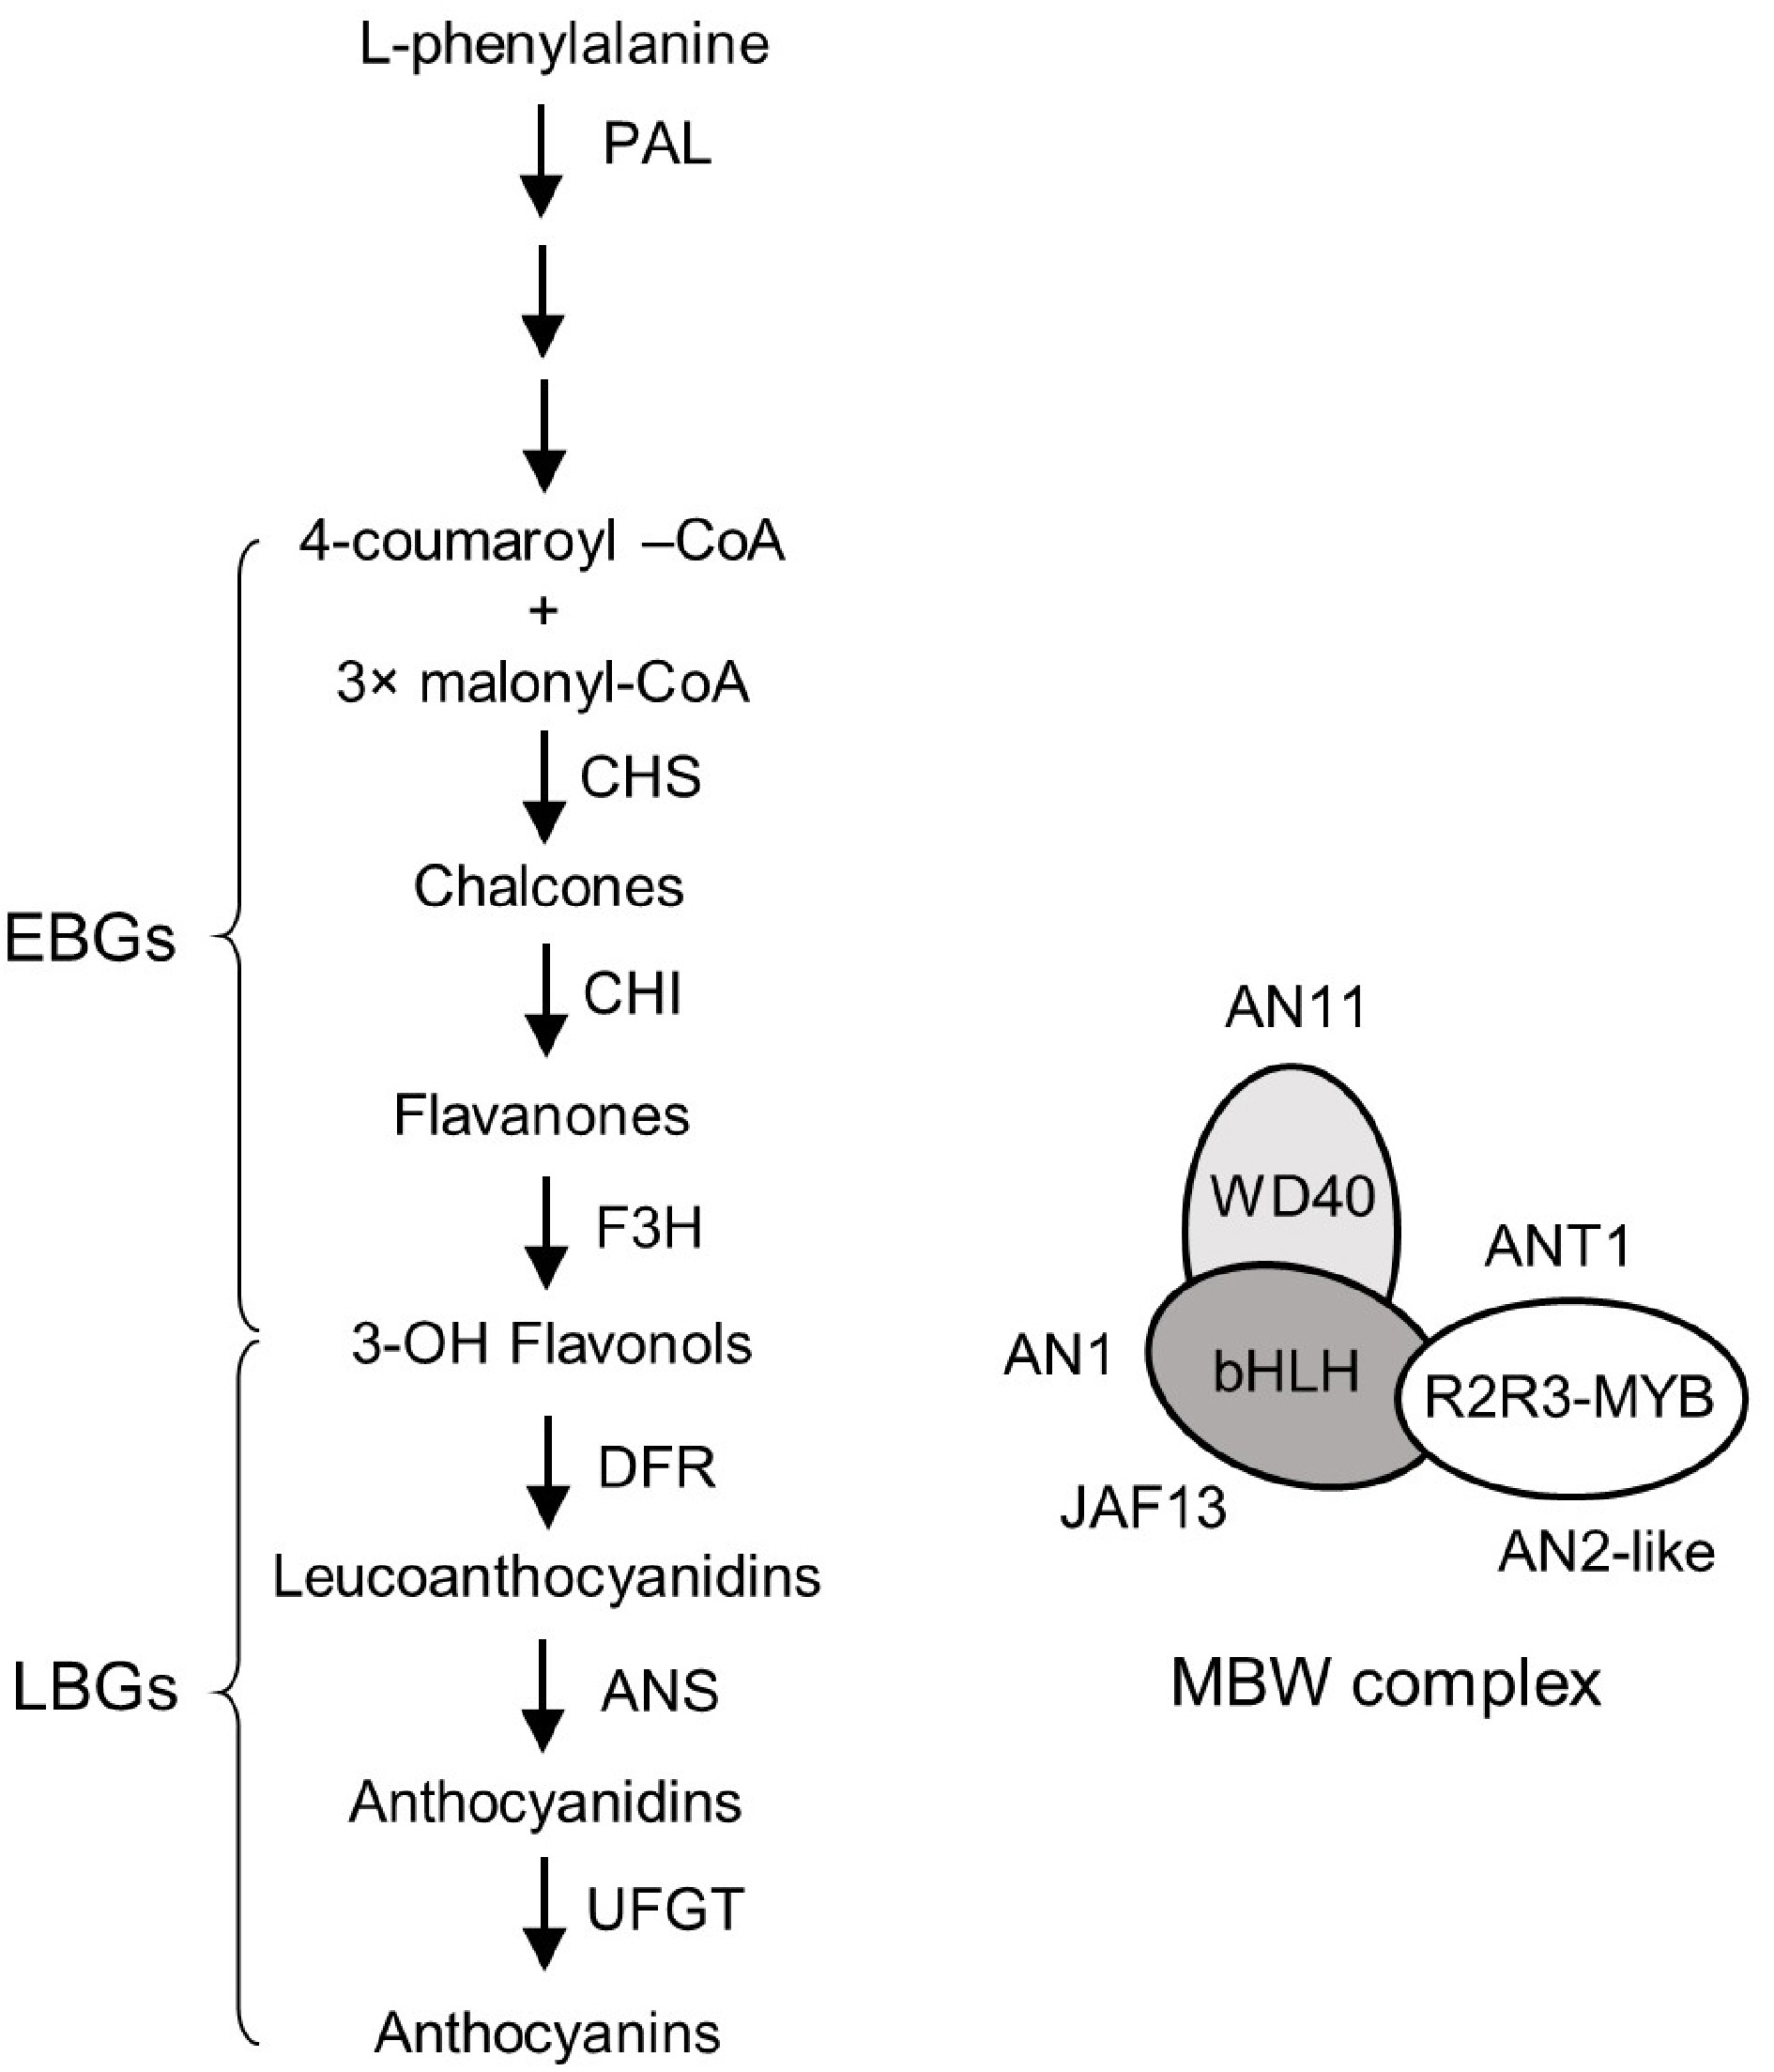
Figure 1.
Anthocyanin biosynthetic pathway and its regulatory genes in tomato. The anthocyanin biosynthetic pathway (ABP, left panel) consists of six core structural genes (CHS, CHI, F3H, DFR, ANS and UFGT) that can be divided into early biosynthetic genes (EBGs) (CHS, CHI and F3H) and late biosynthetic genes (LBGs) (DFR, ANS and UFGT). The phenylalanine ammonia lyase (PAL) gene, which is upstream from the ABP, is included in this figure. The identified regulatory genes of ABP encodes six transcription factors, including two members of the R2R3-MYB family (ANT1 and AN2-like), two bHLH proteins (AN1 and JAF13) and a WD40 protein (AN11), and they form a MBW complex (right panel).
-
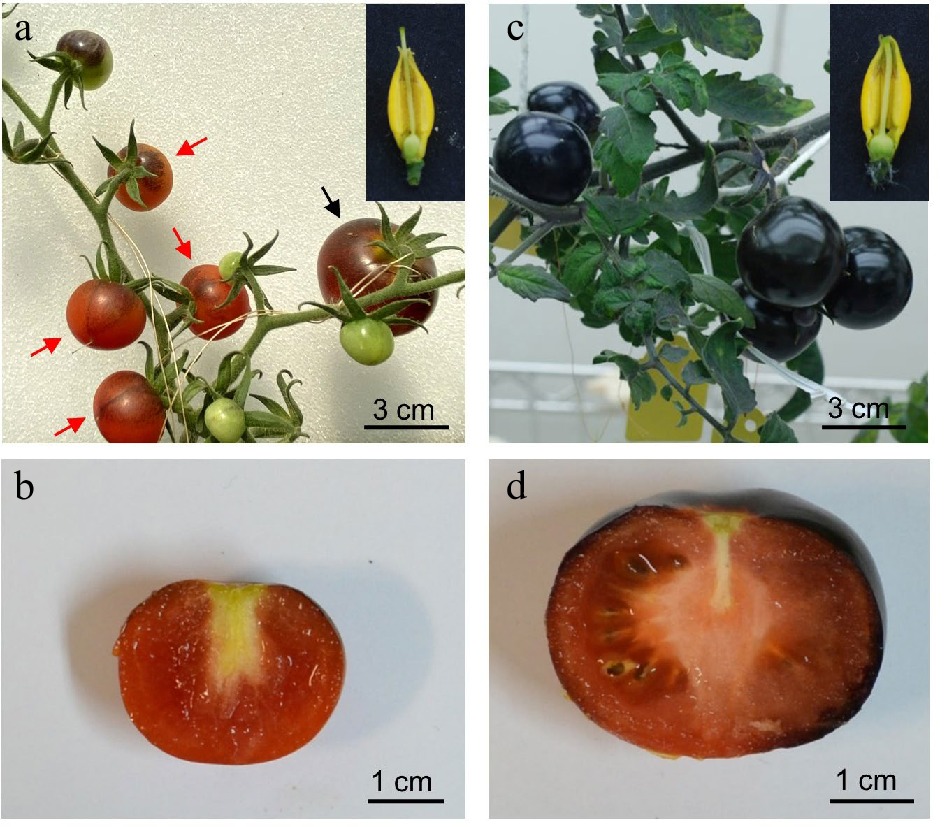
Figure 2.
Fruits developed on Indigo Rose plants grown in GH and GC. (a) Fruits developed on Indigo Rose plants grown in GH and cross section of flower with exserted stigma. Black and red arrows indicate normal and parthenocarpic fruits, respectively. (b) Cross section of a parthenocarpic Indigo Rose fruit grown in GH. (c) Fruits developed on Indigo Rose plants grown in GC and cross section of flower with recessed stigma. (d) Cross section of a normal Indigo Rose fruit grown in GC.
-
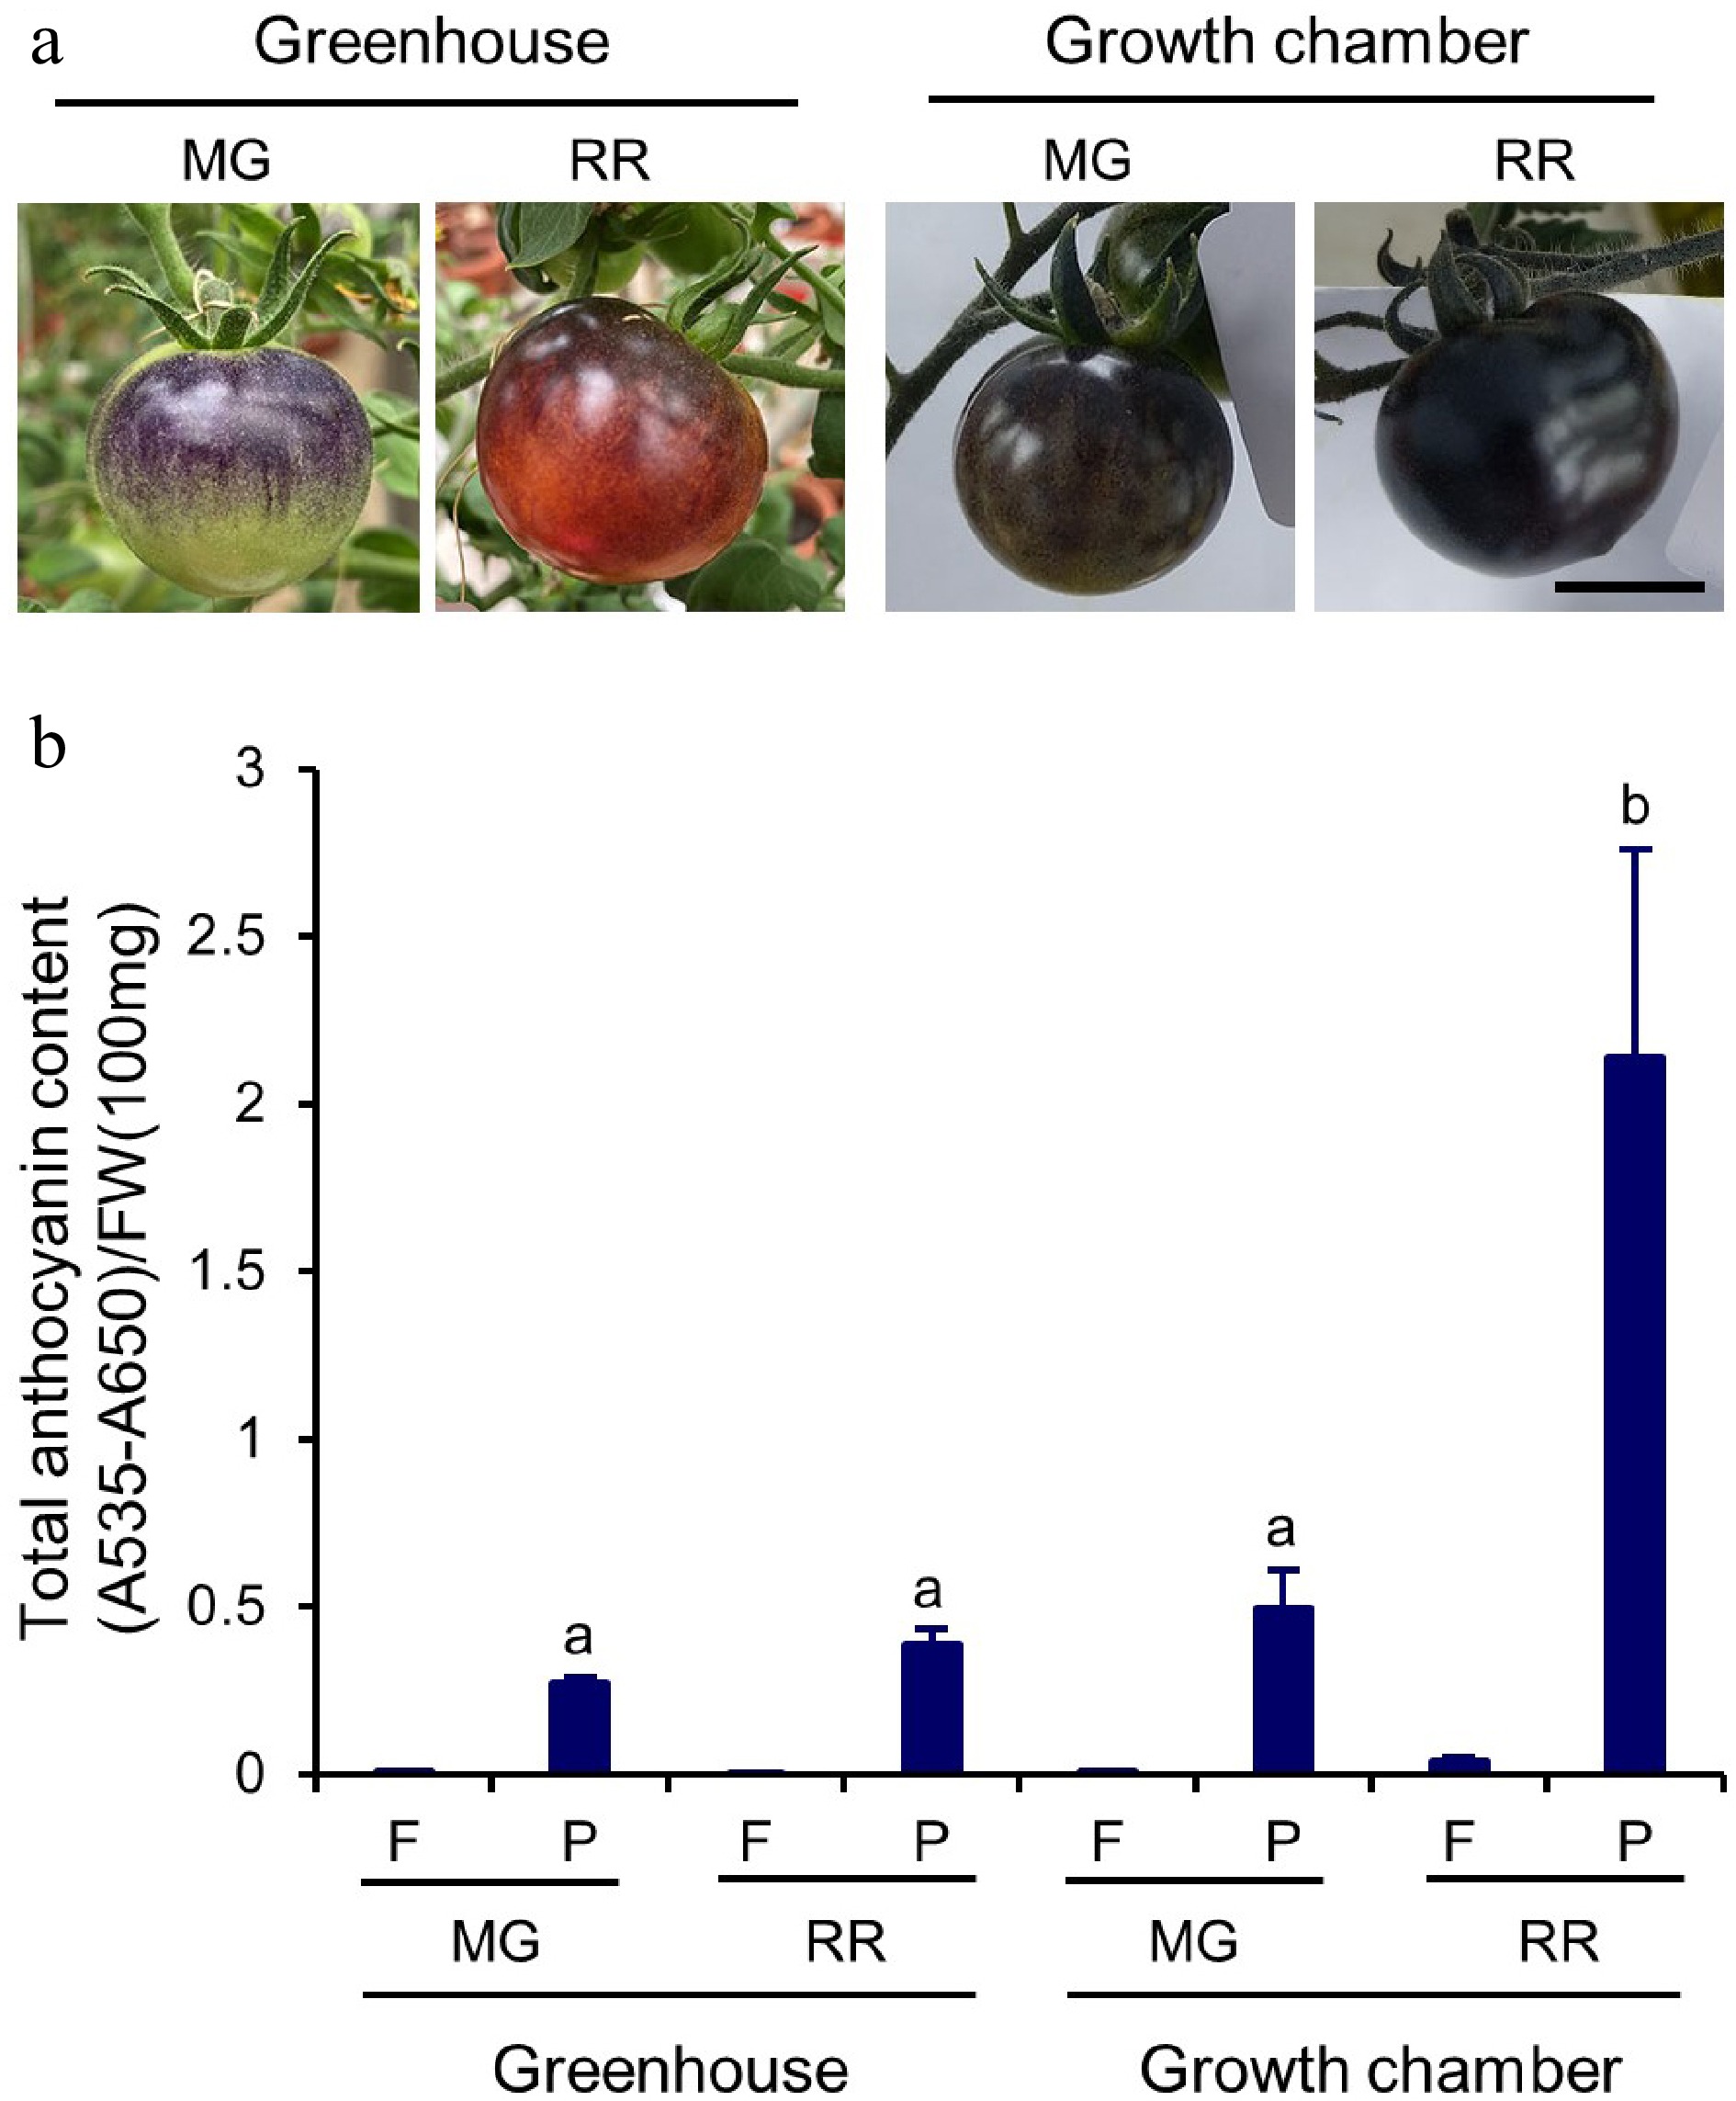
Figure 3.
Total anthocyanin content in Indigo Rose fruits grown in GH and GC. (a) Phenotype of Indigo Rose fruits grown in GH and GC. Scale bar = 2 cm. MG, mature green; RR, red ripe. (b) Total anthocyanin content in flesh (F) and peel (P) of Indigo Rose fruits in (a). FW, fresh weight. Data are means ± SD of three biological replicates. Statistical comparison was calculated by one way ANOVA followed by the Tukey’s test. Different letters indicate significant difference in anthocyanin content in peel at p < 0.05.
-
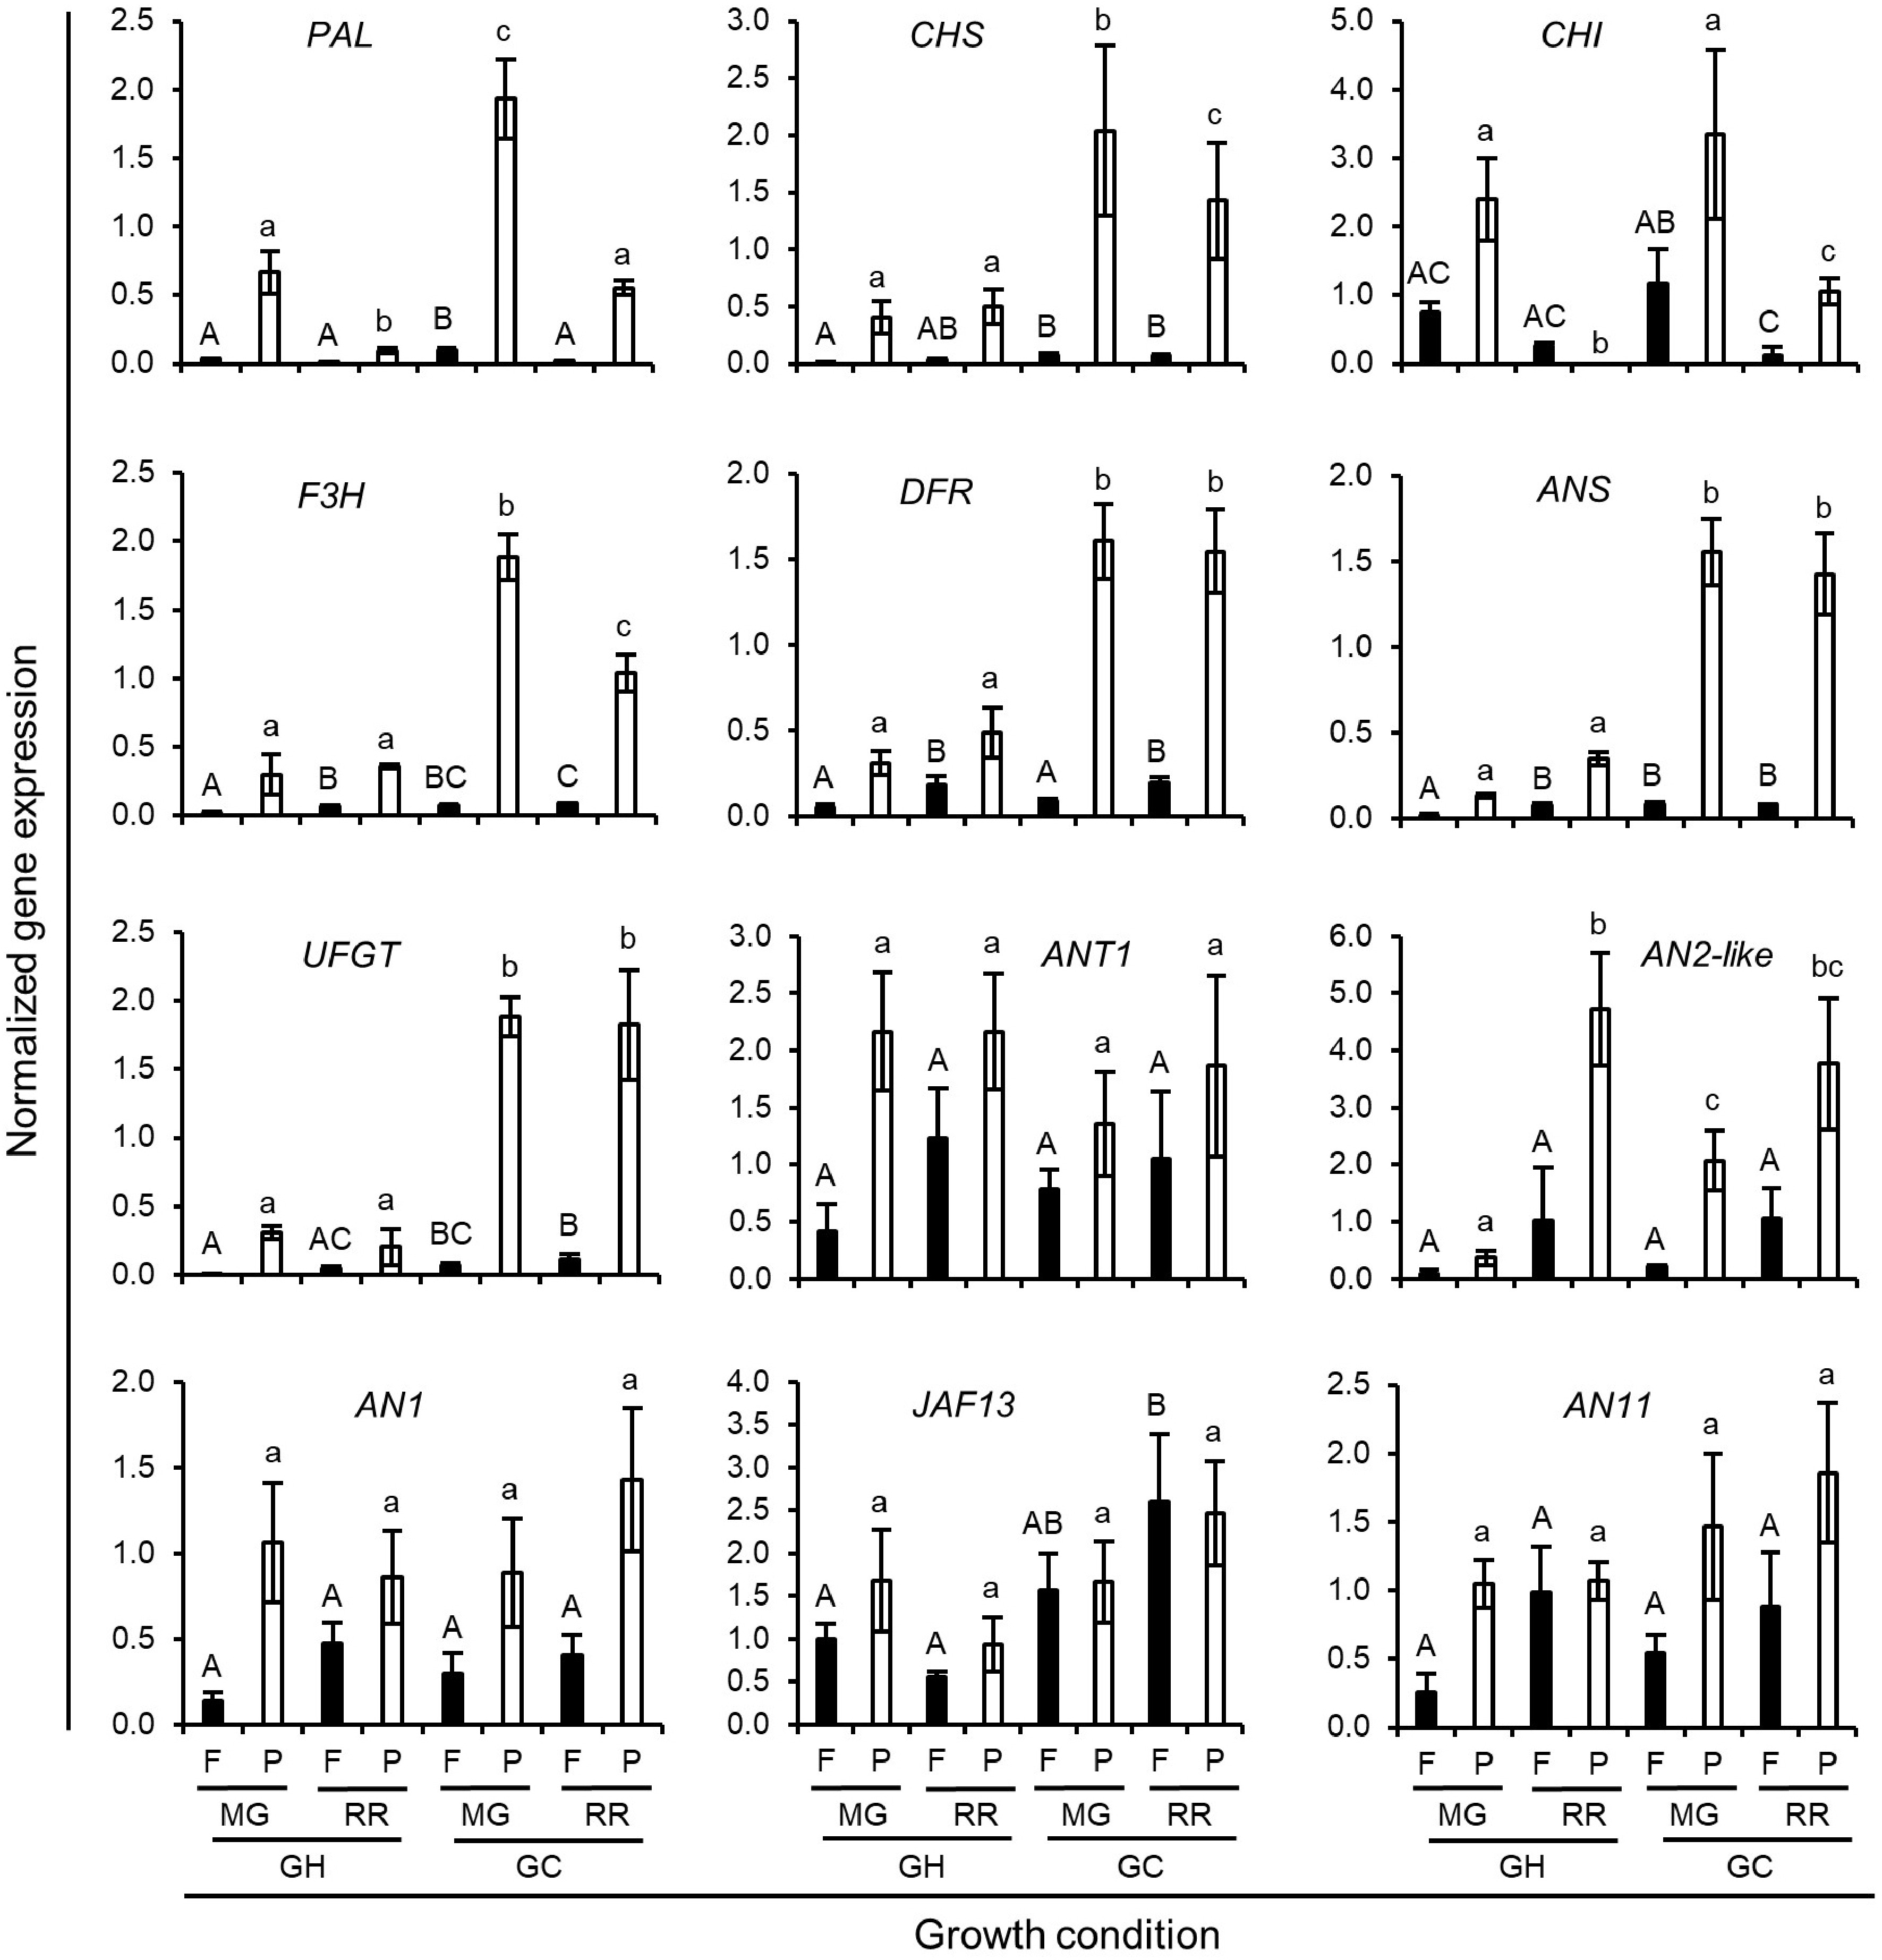
Figure 4.
Normalized expression level of anthocyanin biosynthetic genes in Indigo Rose fruits grown under GH and GC growth conditions. Data are means ± SD of three biological replicates. Statistical comparison was calculated by one way ANOVA followed by the Tukey’s test. Different letters indicate significant difference in gene expression in flesh (uppercase) or peel (lowercase) at p < 0.05. F, flesh; P, peel; MG, mature green; RR, red ripe.
-
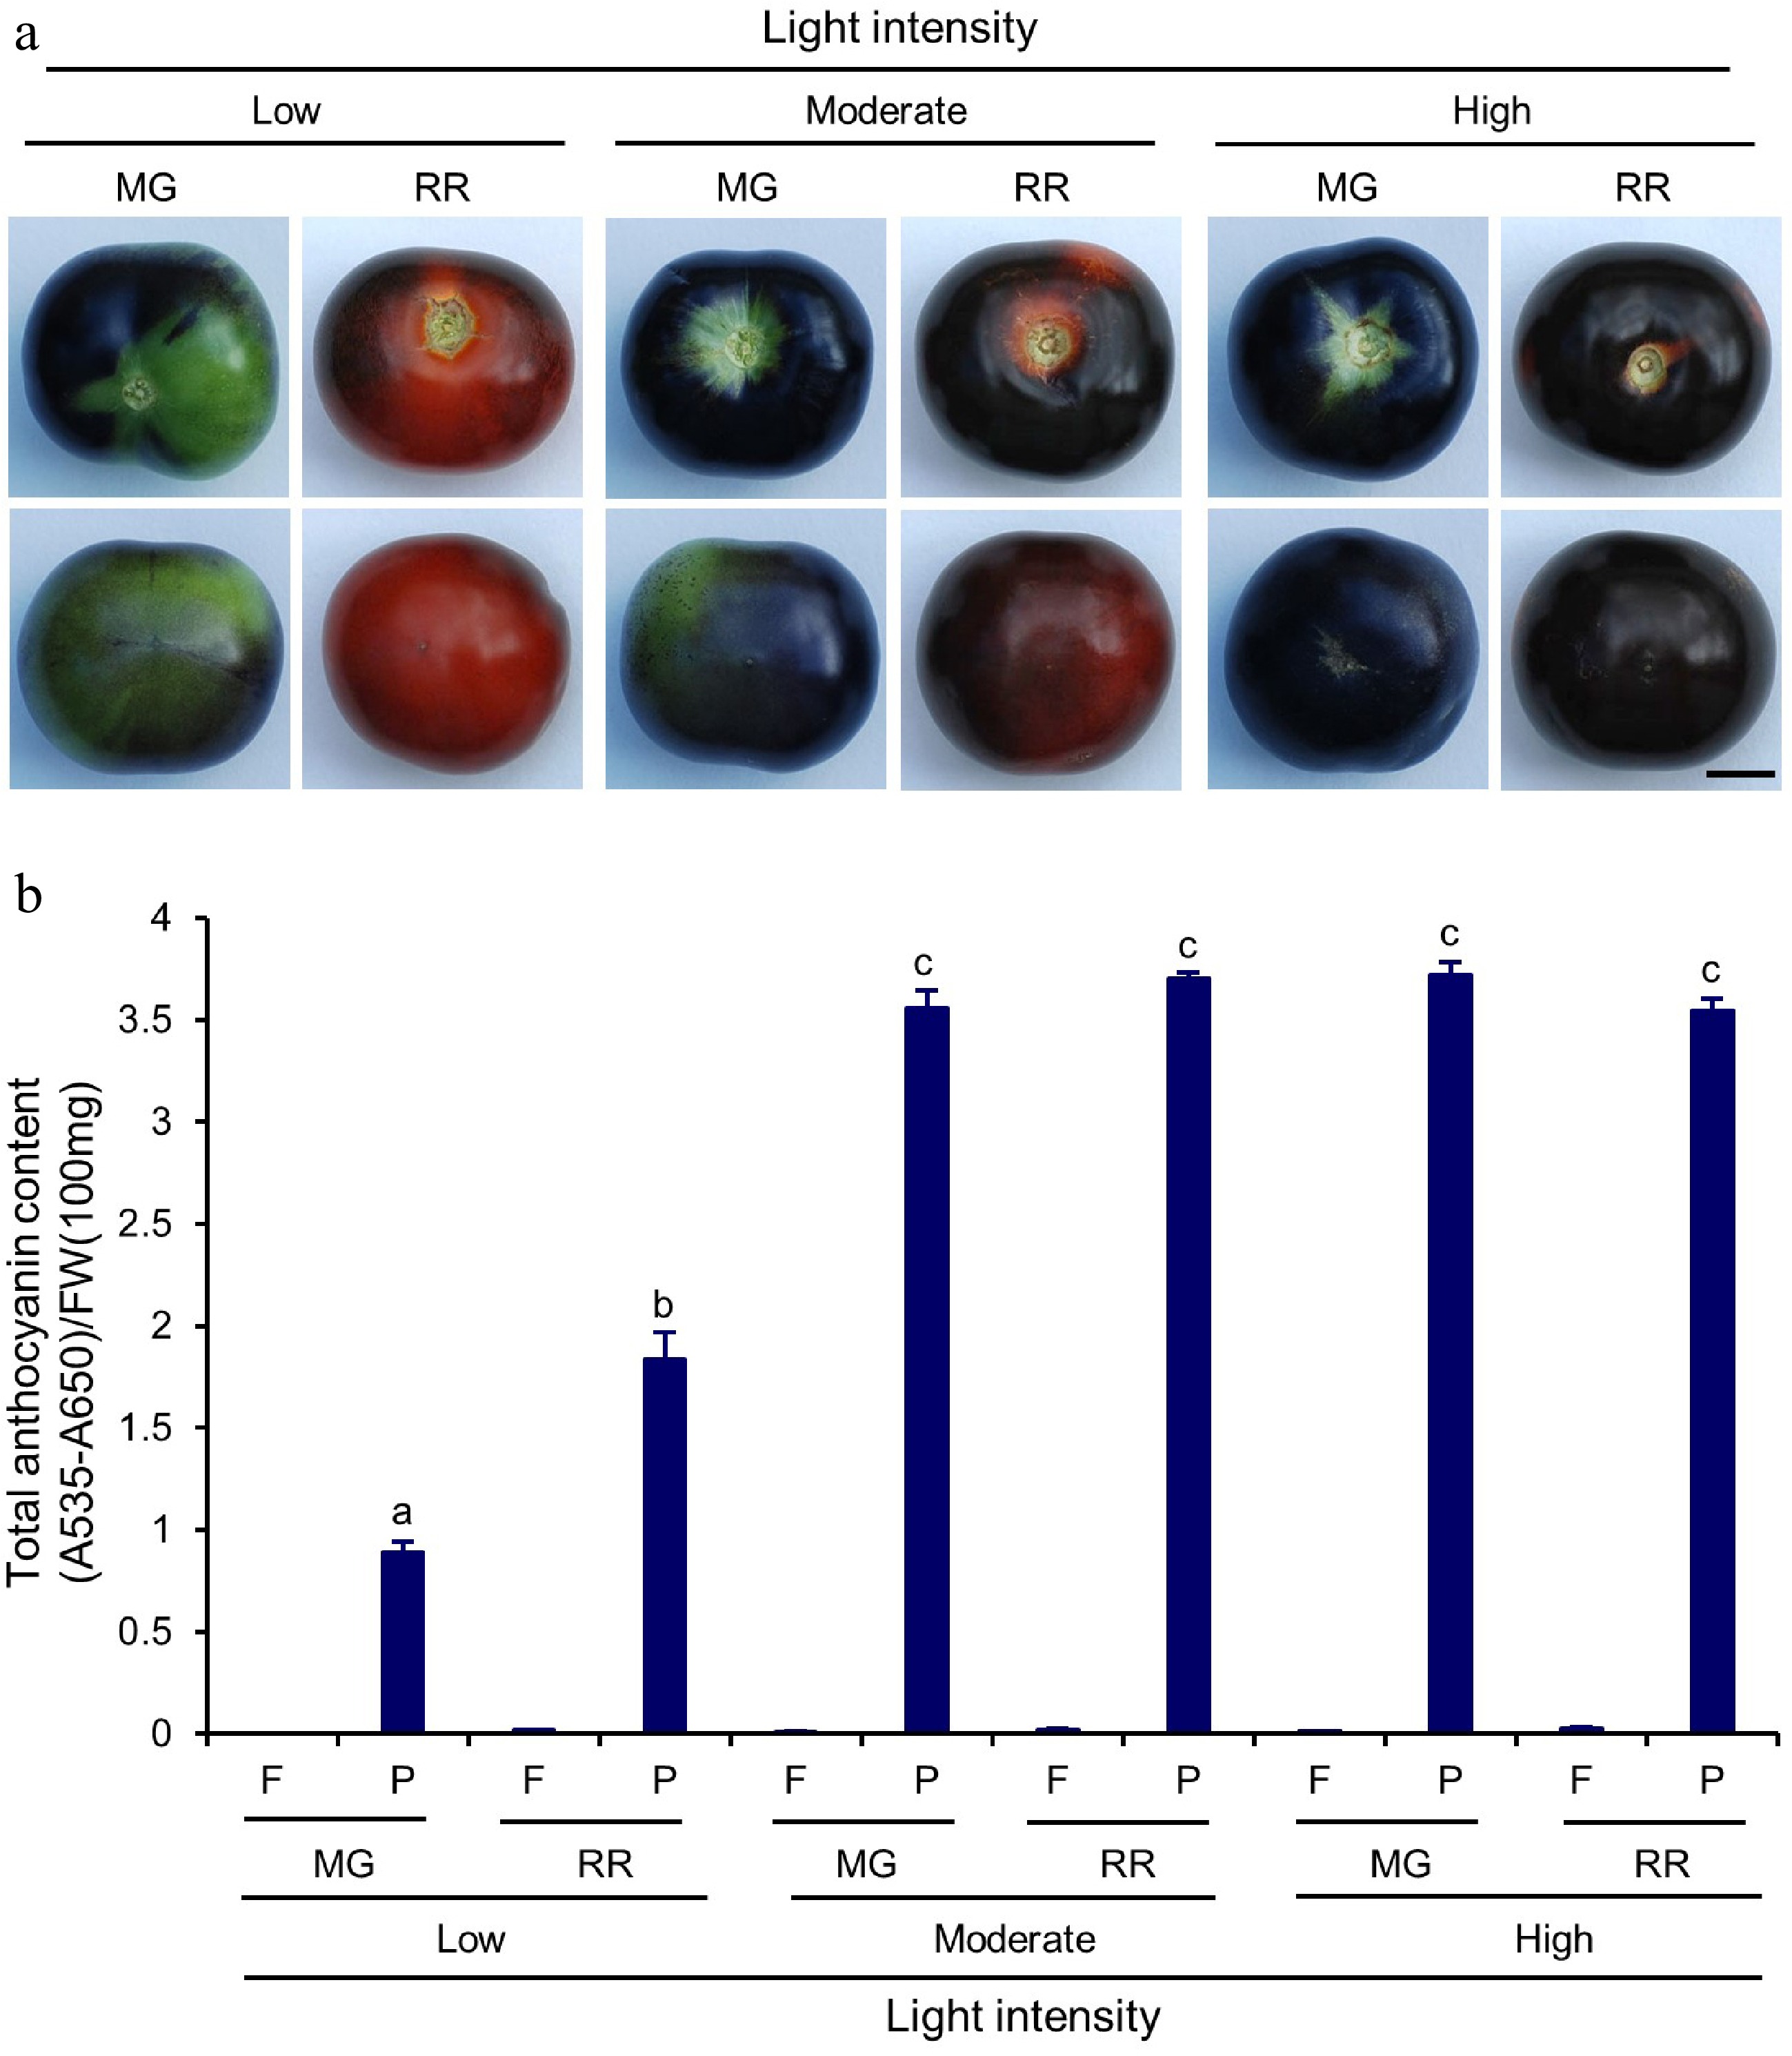
Figure 5.
Total anthocyanin content in Indigo Rose fruits grown in the GCs under different light intensity. (a) Top (upper row) and bottom (lower row) view of Indigo Rose fruits grown under low, moderate and high light intensity. Scale bar = 1 cm. MG, mature green; RR, red ripe. (b) Total anthocyanin content in flesh and peel of Indigo Rose fruits in (a). Statistical comparison was calculated by one way ANOVA followed by the Tukey's test. Different letters indicate significant difference in anthocyanin content in peel p < 0.05. FW, fresh weight; F, flesh; P, peel. Data are means ± SD of three biological replicates.
-
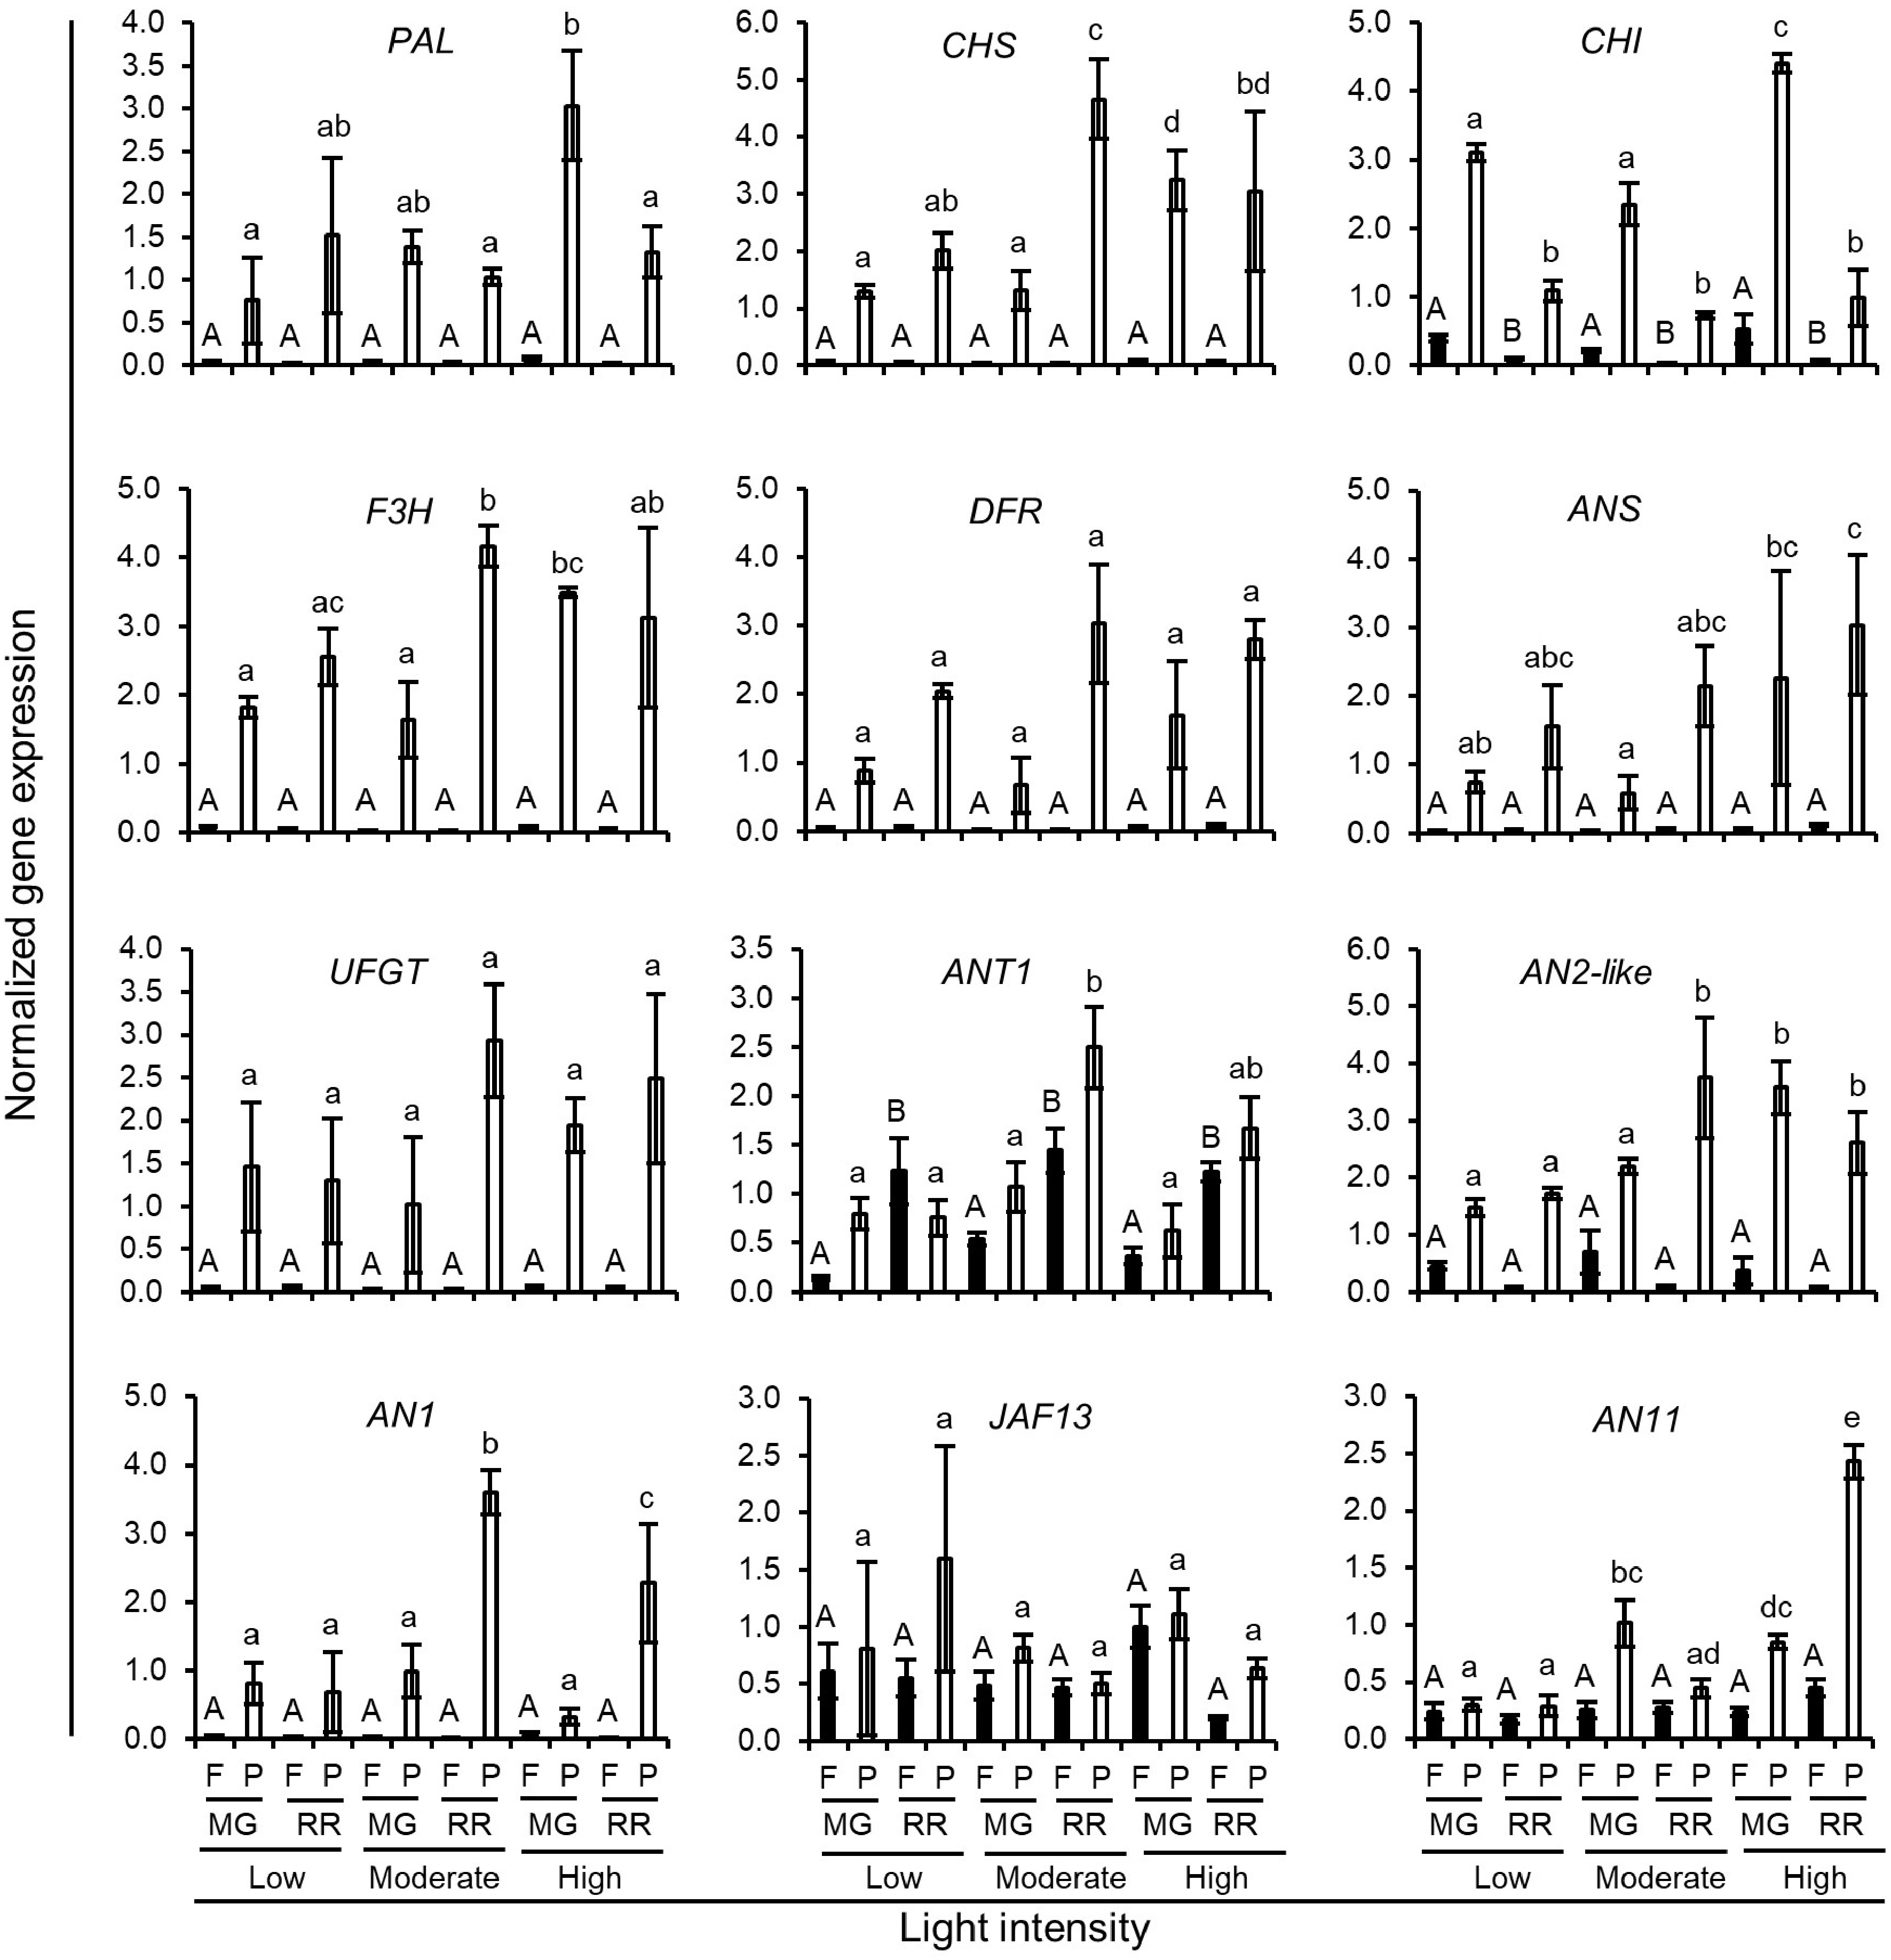
Figure 6.
Normalized expression level of anthocyanin biosynthetic genes in Indigo Rose fruits grown in the GCs under different light intensities. Data are means ± SD of three biological replicates. Statistical comparison was calculated by one way ANOVA followed by the Tukey's test. Different letters indicate significant difference in gene expression in flesh (uppercase) or peel (lowercase) at p < 0.05. F, flesh; P, peel; MG, mature green; RR, red ripe.
-
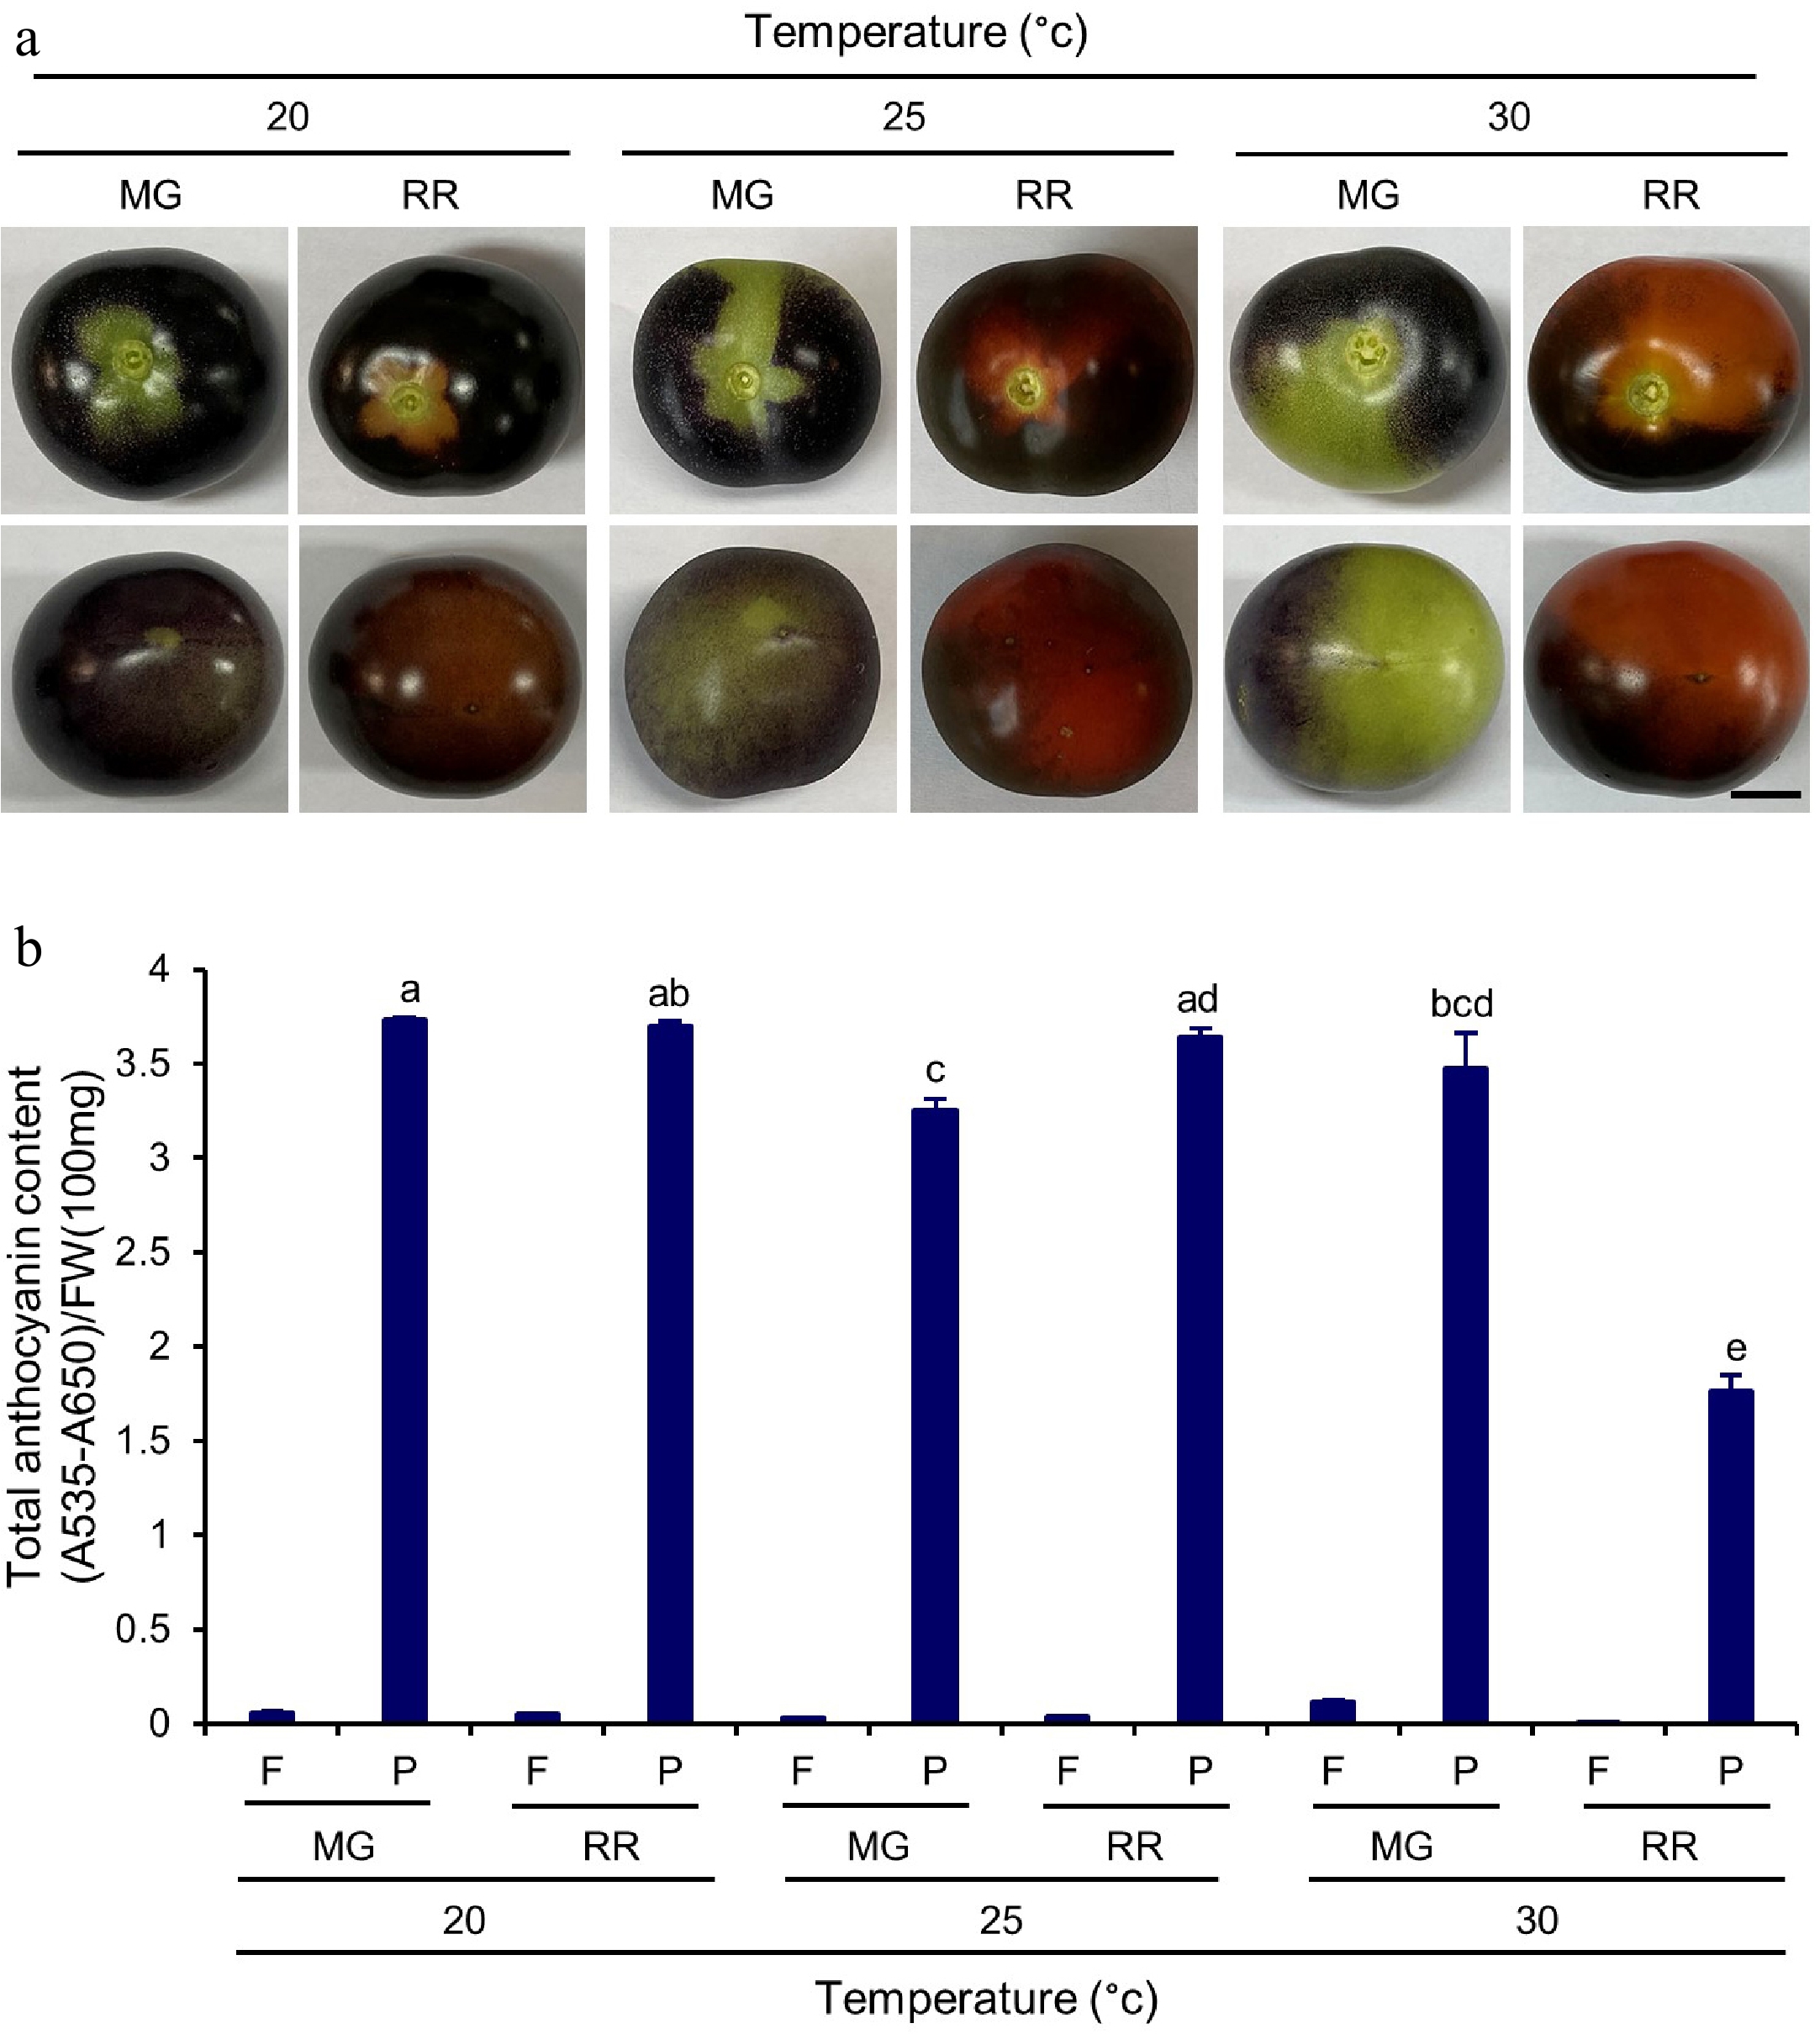
Figure 7.
Total anthocyanin content in Indigo Rose fruits grown in the GCs at different temperature. (a) Top (upper row) and bottom (lower row) view of Indigo Rose fruits grown in the GCs at different temperature. Scale bar = 1 cm. MG, mature green; RR, red ripe. (b) Total anthocyanin content in flesh and peel of Indigo Rose fruits in (a). Statistical comparison was calculated by one way ANOVA followed by the Tukey’s test. Different letters indicate significant difference in anthocyanin content in peel at p < 0.05. FW, fresh weight; F, flesh; P, peel.
-
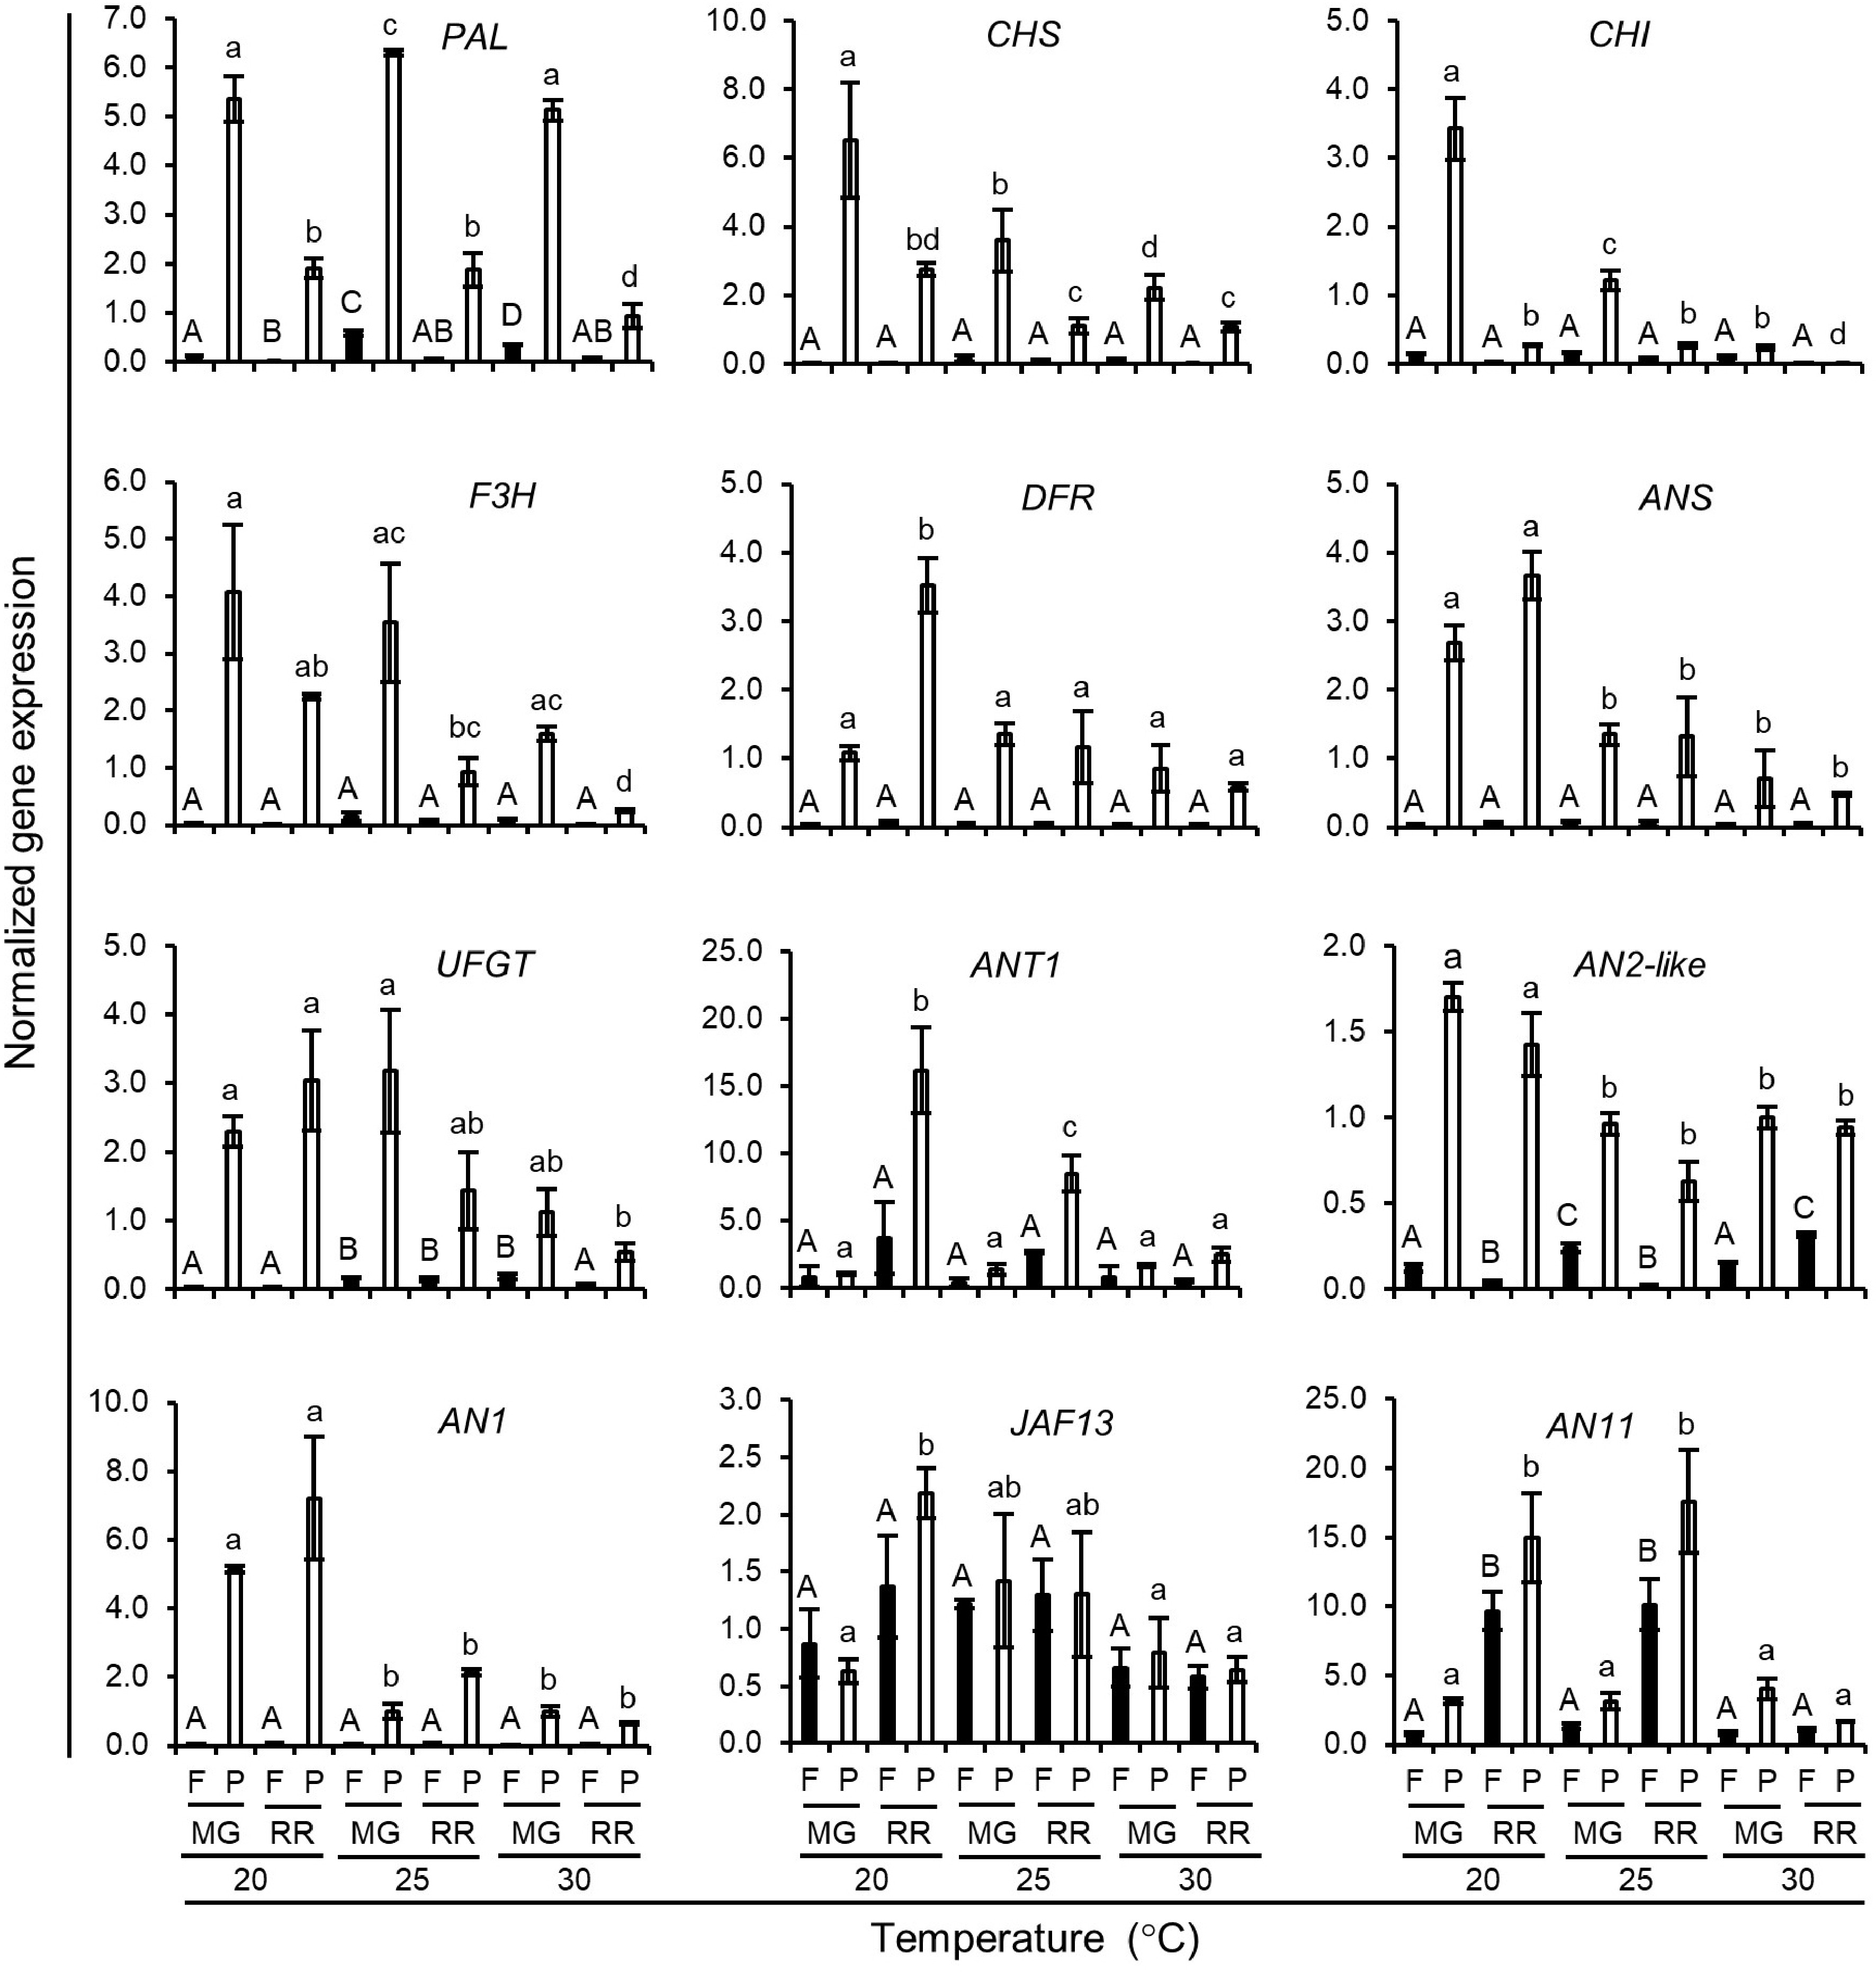
Figure 8.
Normalized expression level of anthocyanin biosynthetic genes in Indigo Rose fruits grown in the GCs at different temperature. Data are means ± SD of three biological replicates. Statistical comparison was calculated by one way ANOVA followed by the Tukey’s test. Different letters indicate significant difference in gene expression in flesh (uppercase) or peel (lowercase) at p < 0.05. F, flesh; P, peel; MG, mature green; RR, red ripe.
-
Gene Accession No. DNA oligo primer (5' to 3') Actin Solyc03g078400 F: TGGATTGGAGGATCCATTCTTG R: CCTTAGAAGCACTTTCTGTGGA AN1 Solyc09g065100 F: GTGGAAGTTGTAGCAATCCAATC R: CACTTCCAATATGCTTGCCTTC AN11 Solyc03g097340 F: GGTTGGCTTGGAACAAACAGC R: GCCCAAGCAATAGCATTCAC AN2-like Solyc10g086290 F: GAGGAAGAAGCAACAGCAGTAT R: CTCCATGTTGCATGGTTGTTG ANS Solyc08g080040 F: TGTTGCTGAGCACATAGTCC R: CTGCTCATCCTCCTTGAGAAC ANT1 Solyc10g086260 F: CAACGTAGATCAATGGTGGATAA R: GCATGGAGTTACCTTCACCA CHI Solyc05g010320 F: CTCAATCACCGCTTGGATCA R: CTCCGTGCTCGCCAATTAT CHS Solyc09g091510 F: GGCCTAGGAACTACTGGTGAA R: TGTAAGCCCAGCCCACTAA DFR Solyc02g085020 F: TGCTCGTCCCATCATGCTATC R: CACTACGGGCAAGTCCTTATC F3H Solyc02g083860 F: TTCAGCCCGTTGAAGGTG R: TGGATTCTGGAATGTGGCTATC JAF13 Solyc08g081140 F: CTTCCAACCTTGATGGGATTCTA R: CATACTACTCTCTGAAGTGCTTCTC PAL NM_001320609.1 F: GATCCATTGTTGGAGTGTCTCA R: GCACTAGACAAGCATTCACAAC UFGT Solyc10g083440 F: GATGGAACTCGATTCTGGAAGG R: CCACCTTCAATTTGCAAACCA F, forward primer; R, reverse primer. Table 1.
DNA oligo primers for qRT-PCR analysis.
Figures
(8)
Tables
(1)