-
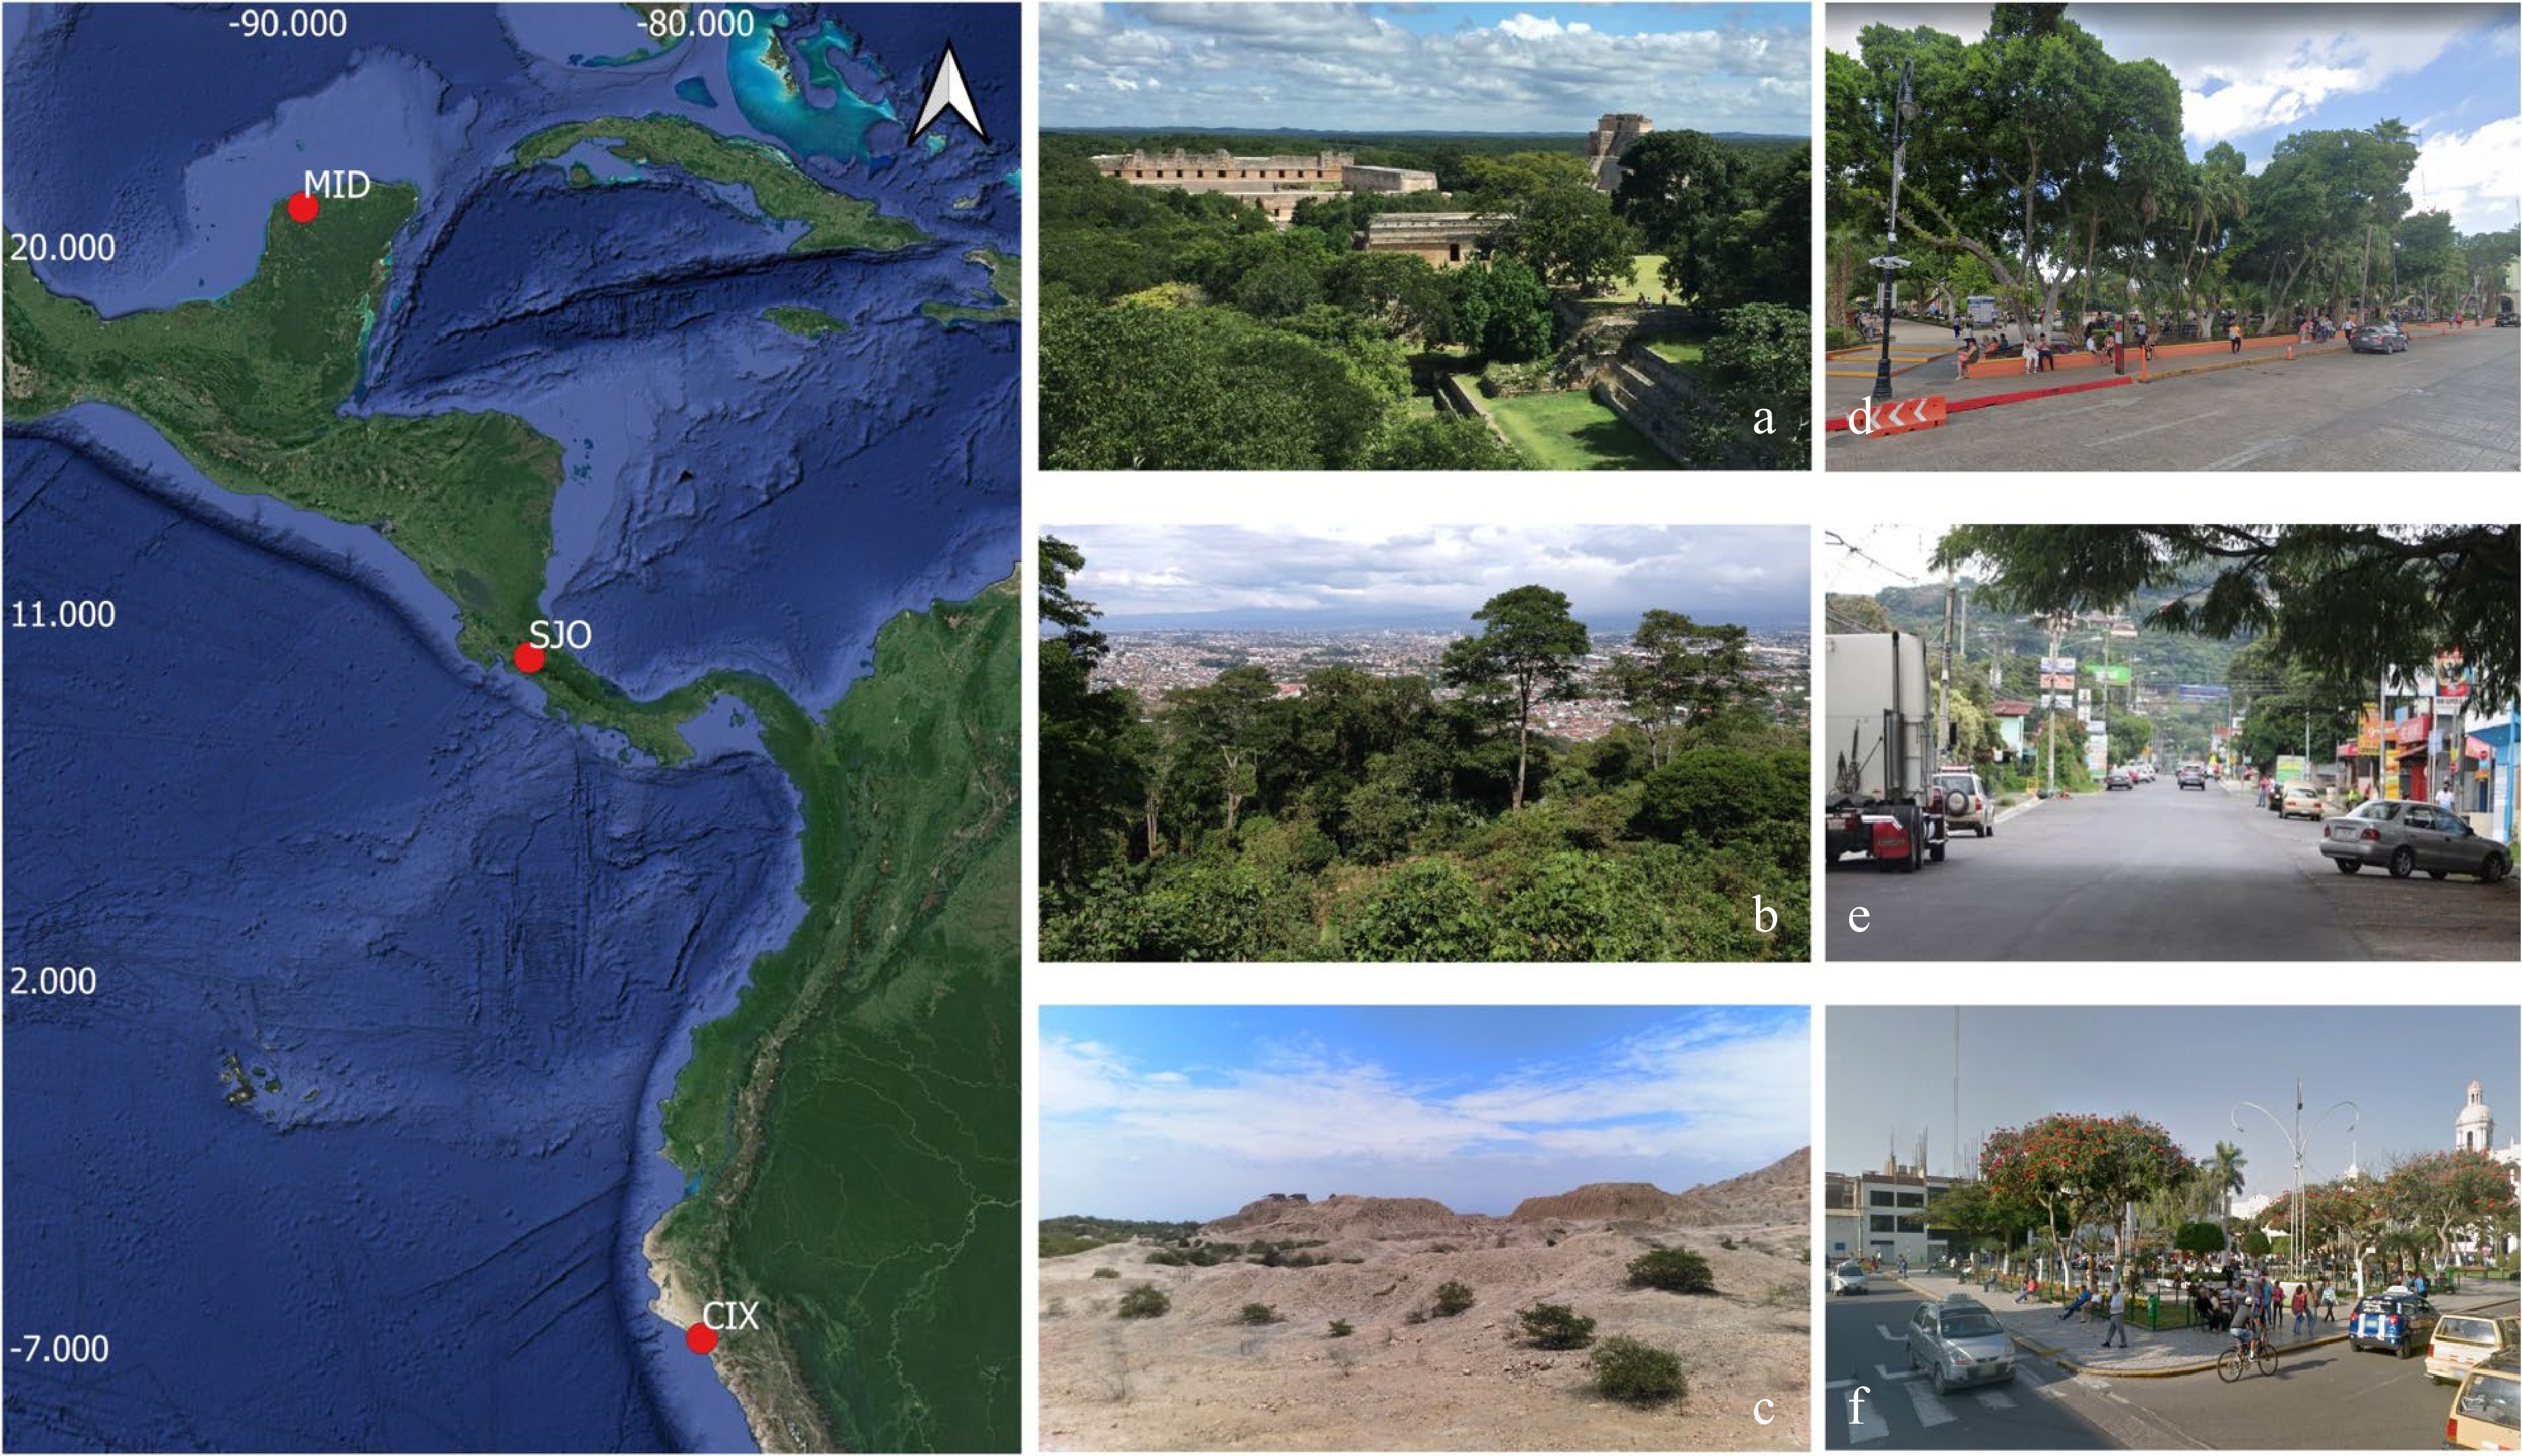
Figure 1.
Geographical location of the three urban landscapes studied in the present study (left) with images showing the characteristic vegetation and urbanization patterns in them. (a) Dry seasonal tropical forest (during rainy season) of the Yucatan Peninsula surrounding the city of Mérida, Mexico (MID). (b) Premontane moist forest of the Central Valley of Costa Rica surrounding the city of San José (SJO). (c) Desert with scattered vegetation of the Peruvian pacific coast surrounding the city of Chiclayo (CIX). (d), (e), (f) Examples of disturbance caused by urbanization and human activities in actual sampling locations in MDI (top), SJO (middle) and CIX (bottom) – the last three images are from Google Maps.
-
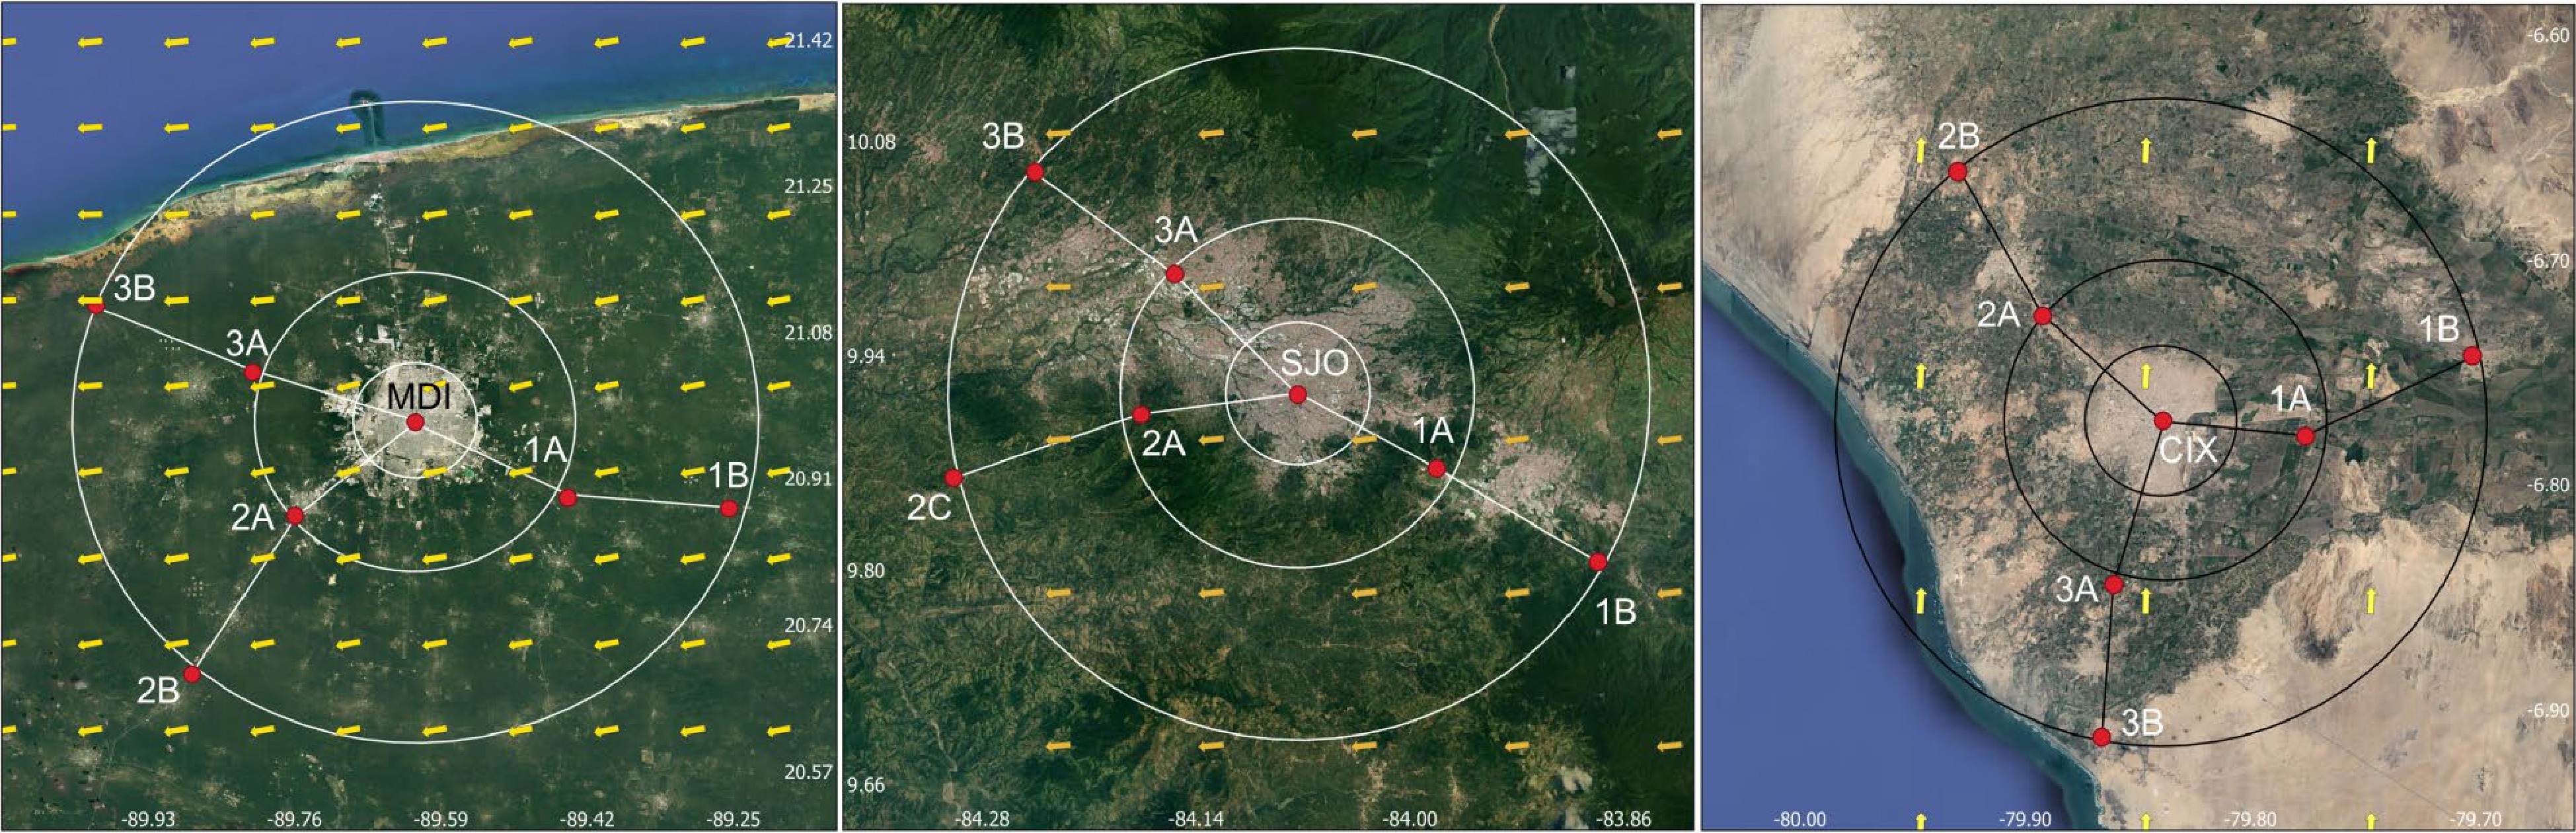
Figure 2.
General aspect of the three urban landscapes studied herein in relation with the sampling strategy of one central location, three sampling locations in an inner (A) ring and three more locations in an outer (B) ring. From left to right, Mérida, Mexico (MDI), San José, Costa Rica (SJO) and Chiclayo, Peru (CIX).
-
Species Urban landscapes MID SJO CIX Arcyria afroalpina 6 Arcyria cinerea 11 27 23 Arcyria denudata 1 Badhamia affinis 6 Badhamia melanospora 1 1 Comatricha elegans 3 Comatricha nigra 3 1 Comatricha pulchella 3 Didymium anellus 3 9 Didymium bahiense 18 22 16 Didymium clavus 1 6 1 Didymium difforme 42 5 Didymium dubium 2 Didymium iridis 3 8 Didymium minus 20 18 7 Didymium nigripes 2 Didymium squamulosum 10 36 Diachea leucopodia 3 Diderma hemisphaericum 4 43 Fuligo intermedia 3 Hemitrichia minor 3 Lamproderma scintillans 13 Perichaena chrysosperma 3 5 1 Perichaena depressa 13 4 12 Perichaena pedata 4 Perichaena vermicularis 2 2 Physarum atacamense 60 Physarum auriscalpium 1 Physarum bivalve 1 Physarum cinereum 9 3 5 Physarum citrinum 2 Physarum compressum 7 24 3 Physarum decipiens 1 Physarum didermoides 1 2 Physarum melleum 1 Physarum pusillum 7 5 5 Physarum stellatum 1 Stemonitis fusca 1 1 For abbreviations see Material and Methods. Table 1.
Number of records of myxomycetes per species associated with the three urban landscapes studied herein.
-
Urban landscape Sampling location Biodiversity parameter Number of records Species richness Simpson's
DIShannon's
DIMérida
(MDI)Urban center 19 8 0.79 1.81 1A 10 6 0.78 1.64 1B 32 14 0.88 2.39 2A 8 5 0.75 1.49 2B 18 7 0.83 1.87 3A 16 7 0.84 1.89 3B 18 8 0.78 1.79 San José
(SJO)Urban center 26 12 0.87 2.27 1A 33 17 0.91 2.65 1B 51 14 0.86 2.27 2A 44 17 0.89 2.49 2B 71 19 0.89 2.52 3A 30 12 0.87 2.25 3B 34 12 0.85 2.15 Chiclayo
(CIX)Urban center 32 11 0.85 2.13 1A 14 6 0.68 1.43 1B 16 7 0.74 1.59 2A 18 5 0.58 1.16 2B 29 11 0.78 1.9 3A 22 7 0.72 1.55 3B 29 7 0.76 1.62 The highest values for the different levels are highlighted in bold. Table 2.
Biodiversity parameters determined in the present study arranged by urban landscape and sampling location.
-
Urban landscape Route Biodiversity parameter Number of records* Species richness Simpson's DI Shannon's DI Mérida (MDI) Urban center 19 8 0.84 1.99 Route 1 14 16 0.93 2.77 Route 2 8.6 9 0.89 2.21 Route 3 11.3 12 0.9 2.44 San José (SJO) Urban center 26 12 0.91 2.49 Route 1 28 20 0.91 2.68 Route 2 38.3 23 0.92 2.78 Route 3 21.3 16 0.9 2.5 Chiclayo (CIX) Urban center 32 11 0.88 2.29 Route 1 10 9 0.77 1.87 Route 2 15.6 12 0.76 1.92 Route 3 17 10 0.77 1.84 * For normalization, this value was calculated as the number of records per set of 20 samples. The highest values for the different levels are highlighted in bold. Table 3.
Biodiversity parameters determined in the present study arranged by urban landscape and established sampling route.
-
Urban landscape Urban
impact
zoneBiodiversity parameter Number of records* Species richness Simpson's DI Shannon's DI Mérida (MDI) Urban center 19 8 0.79 1.8 Zone A (inner radius) 11.3 13 0.86 2.28 Zone B (outer radius) 22.6 16 0.9 2.52 San José (SJO) Urban center 26 12 0.87 2.27 Zone A (inner radius) 35.6 23 0.91 2.7 Zone B (outer radius) 52 23 0.88 2.53 Chiclayo (CIX) Urban center 32 11 0.85 3.13 Zone A (inner radius) 18 10 0.69 1.61 Zone B (outer radius) 24.6 13 0.81 2.07 * For normalization, this value was calculated as the number of records per set of 20 samples. The highest values for the different levels are highlighted in bold. Table 4.
Biodiversity parameters determined in the present study arranged by urban landscape and urban impact zone.
Figures
(2)
Tables
(4)