-
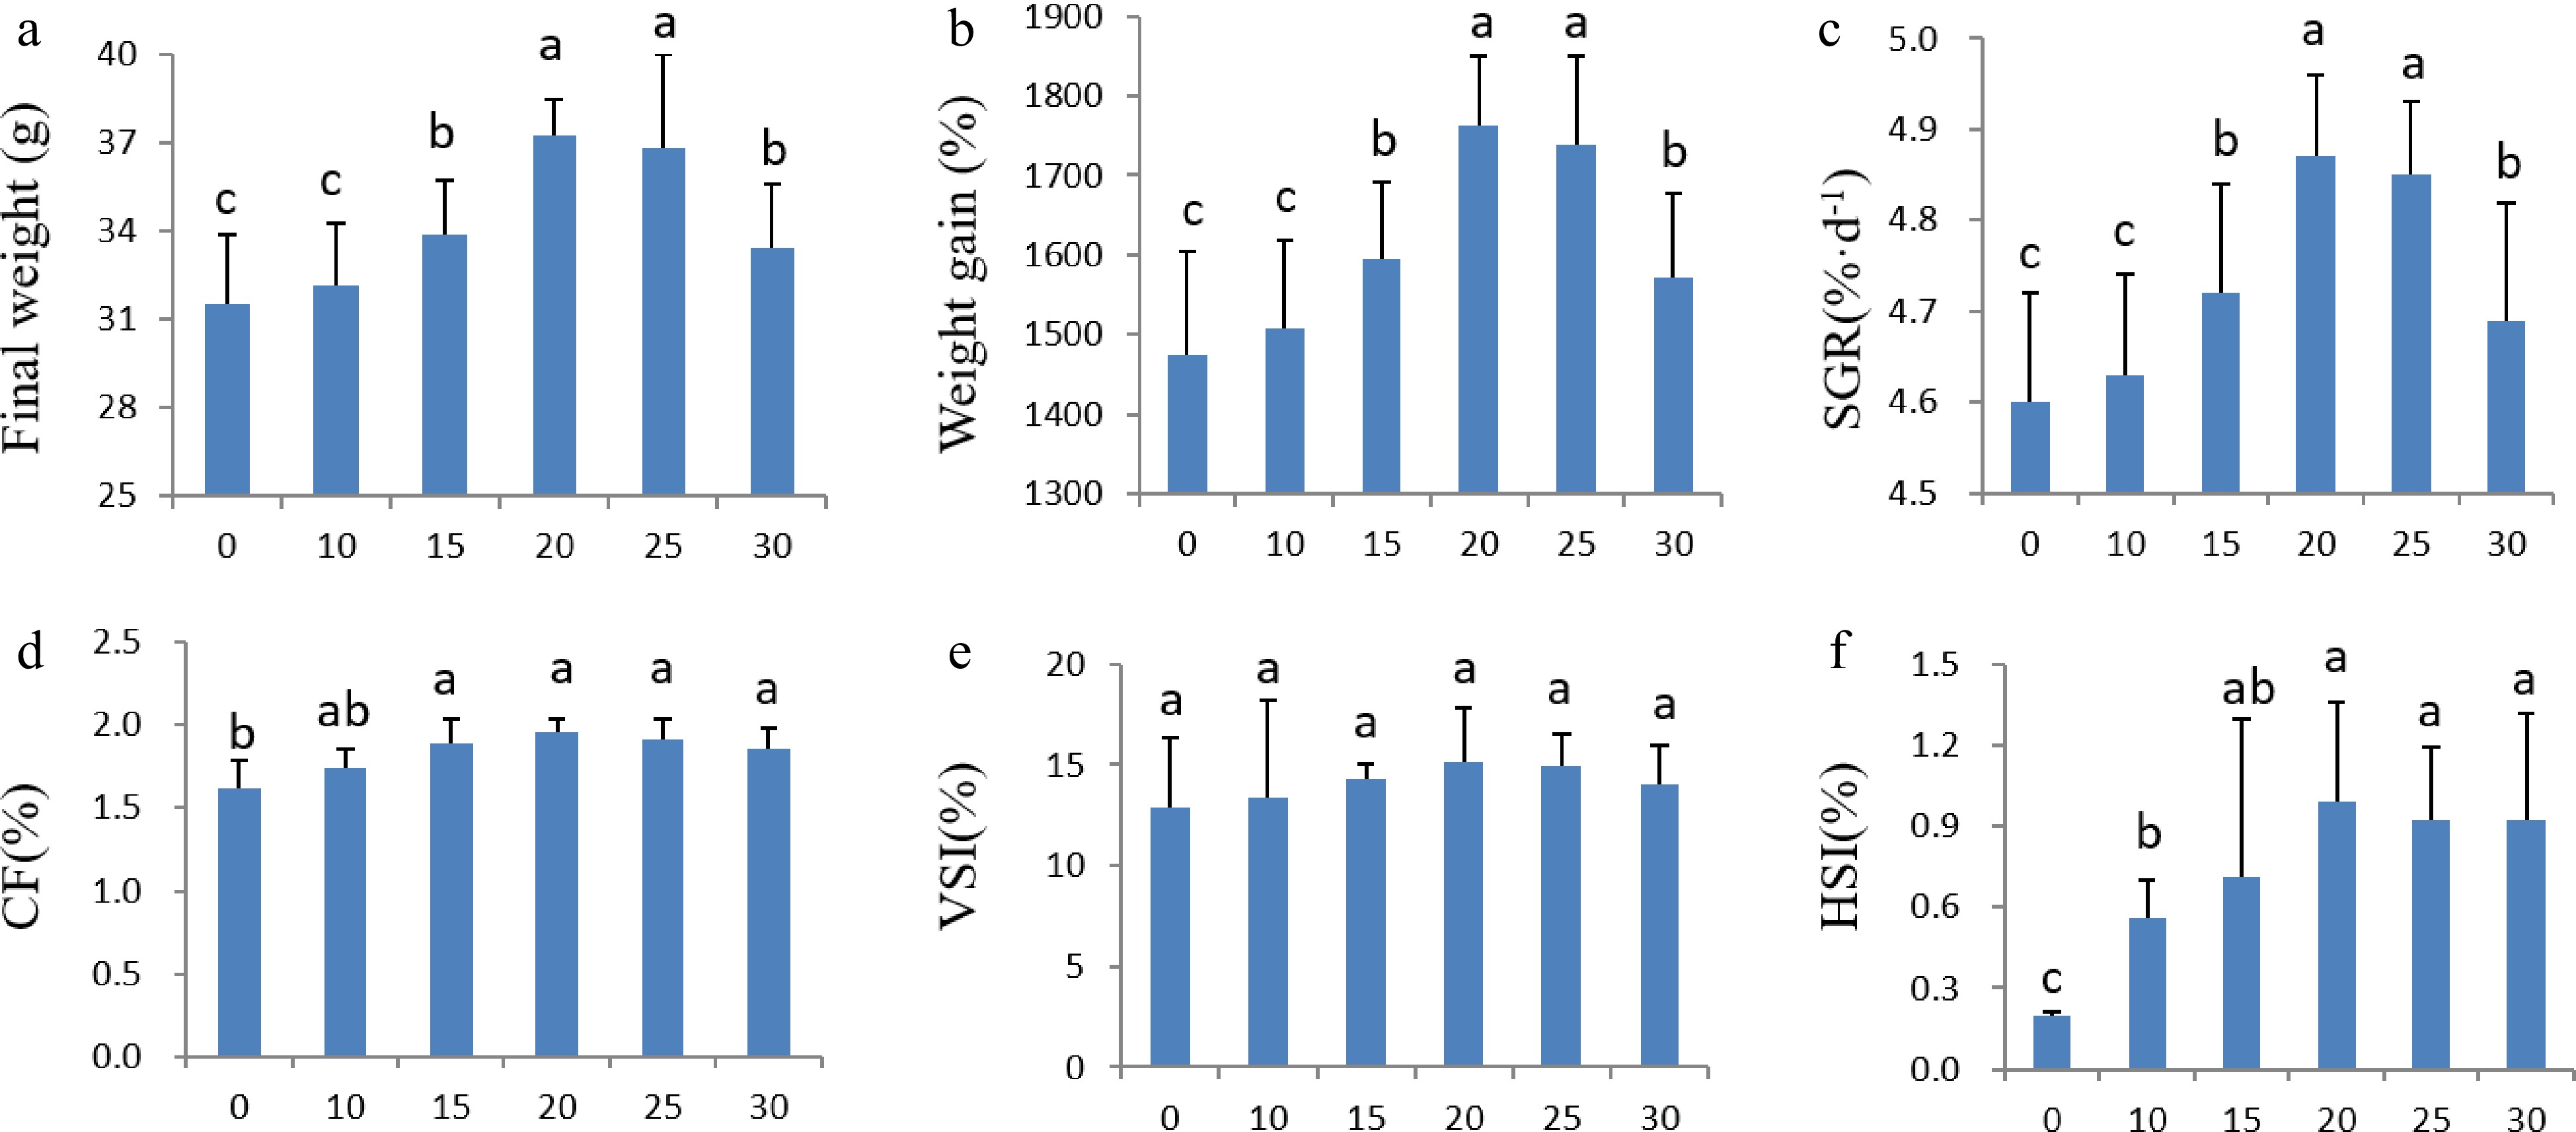
Figure 1.
Effects of dietary duckweed variety DW2602 on growth performance of tilapia. (a) Final weight. (b) Weight gain rate. (c) Specific growth rate (SGR). (d) Condition factor. (e) Viscerosomatic index (VSI). (f) Hepatosomatic index (HIS). The significance of differences was tested by one-way ANOVA and Duncan’s multiple range test using IBM SPSS Statistics version 24. Different letters above columns indicate significant differences at 5% level of significance.
-
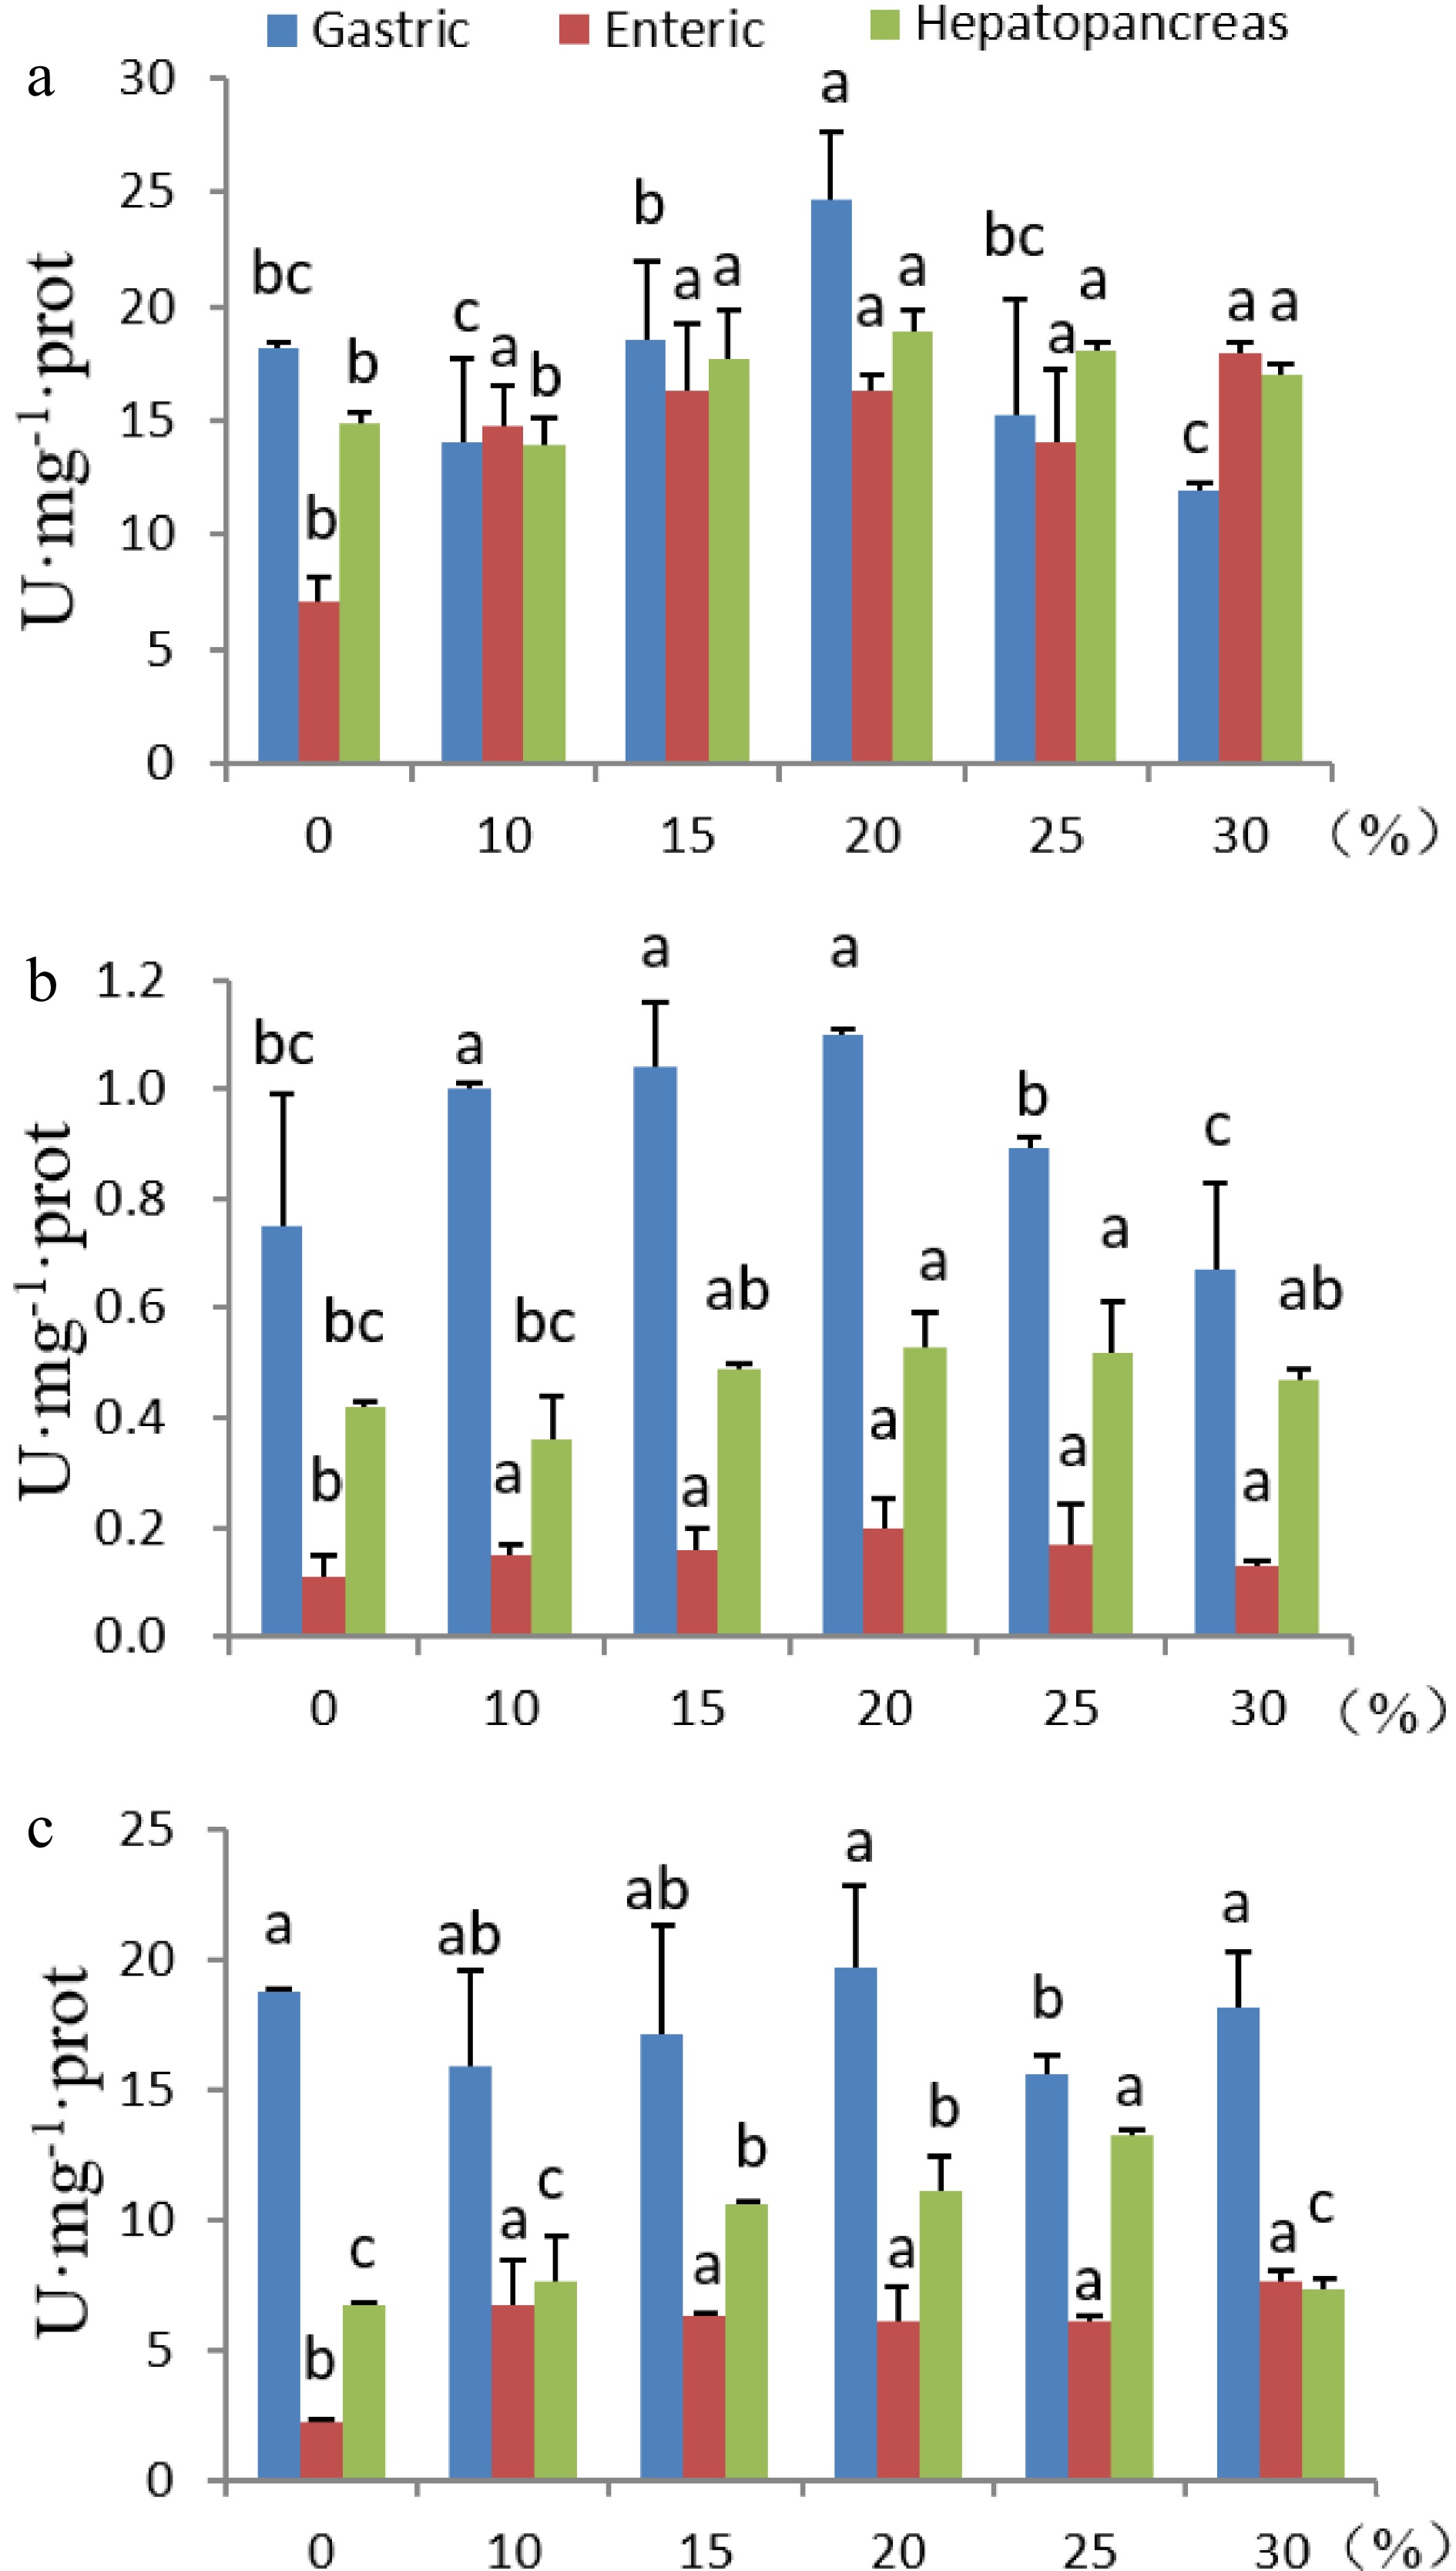
Figure 2.
Effects of dietary duckweed variety DW2602 on digestive enzyme activities. (a) proteolytic activity. (b) Amylase activity. (c) Lipase activity. The significance of differences was tested by one-way ANOVA and Duncan’s multiple range test using IBM SPSS Statistics version 24. Different letters above columns indicate significant differences at 5% level of significance.
-
Strain/varietiy Species Place of collection HL1001 Spirodela polyrhiza Heilongjiang HL1403 Landoltia punctata Heilongjiang HL2002 Lemna perpusilla Heilongjiang HB0203 Spirodela polyrhiza Hubei HB0602 Landoltia punctata Hubei HB0401 Lemna aequinoctialis Hubei YN2701 Spirodela polyrhiza Yunnan YN2702 Landoltia punctata Yunnan YN2704 Lemna aequinoctialis Yunnan DW2602 Spirodela polyrhiza Hainan DW2701 Landoltia punctata Hainan DW1301 Lemna aequinoctialis Hainan Table 1.
Duckweed strains and/or varieties used in this research.
-
HL1001 HL1403 HL2002 HB0203 HB0401 HB0602 DW1301 DW2602 DW2701 YN2701 YN2702 YN2704 Average Dry matter 4.01 5.51 6.08 5.39 5.58 7.15 4.79 5.57 5.61 4.82 5.59 5.38 5.46 Protein 38.71 41.18 35.70 38.33 40.70 32.56 39.62 44.52 35.04 33.66 39.52 35.37 37.91 Fat 4.85 5.04 7.75 4.25 8.12 6.33 7.65 4.69 6.35 5.13 5.68 5.35 5.93 Starch 3.56 6.38 2.37 4.39 6.76 6.81 6.34 3.25 6.18 4.37 6.76 6.43 5.30 Arg(R) 2.04 2.42 2.23 2.02 2.30 1.91 2.24 2.35 2.06 1.77 2.32 2.00 2.14 His(H) 0.79 0.81 0.89 0.78 0.82 0.64 0.80 0.91 0.69 0.69 0.77 0.71 0.78 Ile(I) 1.55 1.68 1.70 1.53 1.78 1.33 1.73 1.78 1.43 1.35 1.61 1.54 1.58 Leu(L) 3.42 3.68 3.84 3.38 3.89 2.91 3.79 3.93 3.13 2.97 3.53 3.38 3.49 Lys(K) 2.26 2.41 2.49 2.24 2.53 1.91 2.46 2.60 2.05 1.97 2.31 2.20 2.29 Met(M) 0.33 0.59 0.38 0.33 0.35 0.47 0.34 0.38 0.51 0.29 0.57 0.30 0.40 Phe(F) 2.27 2.29 2.54 2.25 2.41 1.81 2.34 2.61 1.94 1.97 2.19 2.09 2.23 Thr(T) 1.56 1.64 1.66 1.54 1.66 1.30 1.62 1.79 1.40 1.36 1.58 1.44 1.55 Val(V) 2.42 2.58 2.74 2.40 2.81 2.04 2.74 2.78 2.19 2.10 2.47 2.44 2.48 Tyr(Y) 1.00 1.25 0.95 0.99 1.22 0.99 1.18 1.15 1.07 0.87 1.20 1.06 1.08 Pro(P) 1.73 1.82 1.91 1.71 1.89 1.44 1.84 1.99 1.55 1.50 1.74 1.65 1.73 Gly(G) 2.00 2.23 2.15 1.98 2.20 1.76 2.14 2.30 1.89 1.74 2.14 1.91 2.04 Ala(A) 2.20 2.35 2.31 2.18 2.50 1.86 2.44 2.53 2.00 1.91 2.26 2.18 2.23 Ser(S) 1.85 1.92 1.90 1.83 1.82 1.52 1.77 2.13 1.64 1.61 1.85 1.58 1.79 Glu(E) 4.30 4.29 4.56 4.26 4.41 3.39 4.29 4.95 3.65 3.74 4.12 3.83 4.15 Table 2.
Nutrient and amino acid contents of duckweed strains (% dry weight).
-
Diet Water (%) Dissolution (%) Ash (%) Fat (%) Fiber (%) Protein (%) Lysine (%) Sulfur-AA (%) Control 8.2 10.0 10.9 8.3 4.2 31.2 2.0 0.9 20% duckweed 6.9 8.5 11.3 10.5 4.9 28.9 2.3 1.1 Standard ≤ 12.5 ≤ 10.5 ≤ 14 ≤ 6 ≤ 6 ≤ 28 ≤ 1.6 ≤ 0.8 Table 3.
Stability and nutritional value of control and the diet containing 20% S. polyrhiza DW2602.
-
Diet Arsenic Cadmium Mercury Lead Tongwei-156 0.20 0.05 0.01 0.72 20% duckweed 0.18 0.11 0.01 0.74 National standards ≤ 3 ≤ 0.5 ≤ 0.5 ≤ 5 Table 4.
Content of heavy metals in the control and the duckweed diets (mg/kg).
Figures
(2)
Tables
(4)