-
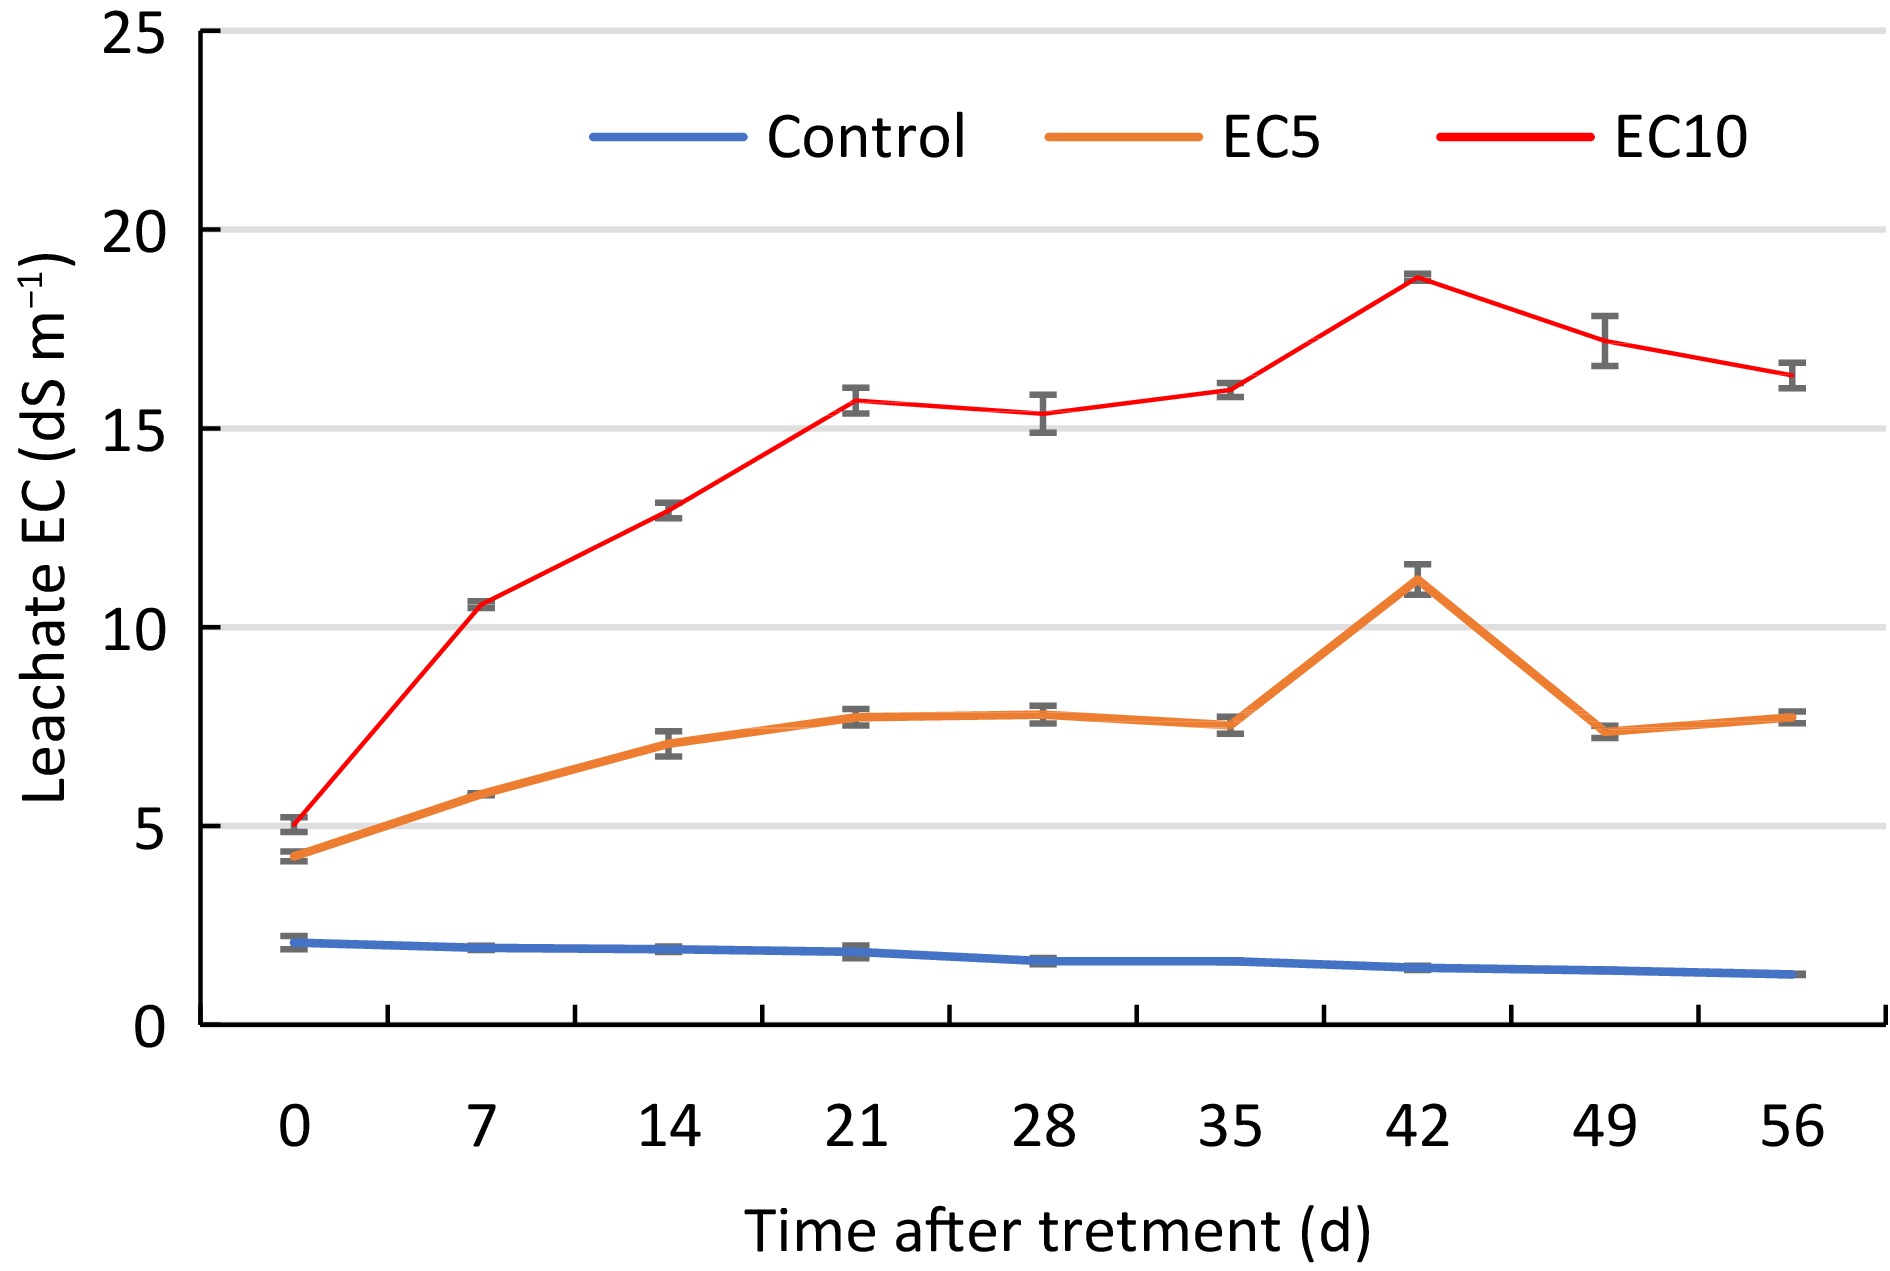
Figure 1.
Electrical conductivity (EC) of leachate collected from seven turfgrass genotypes treated with control or saline solutions (EC5 or EC10) for a total of eight weeks. Vertical bars indicate standard error (n = 5).
-
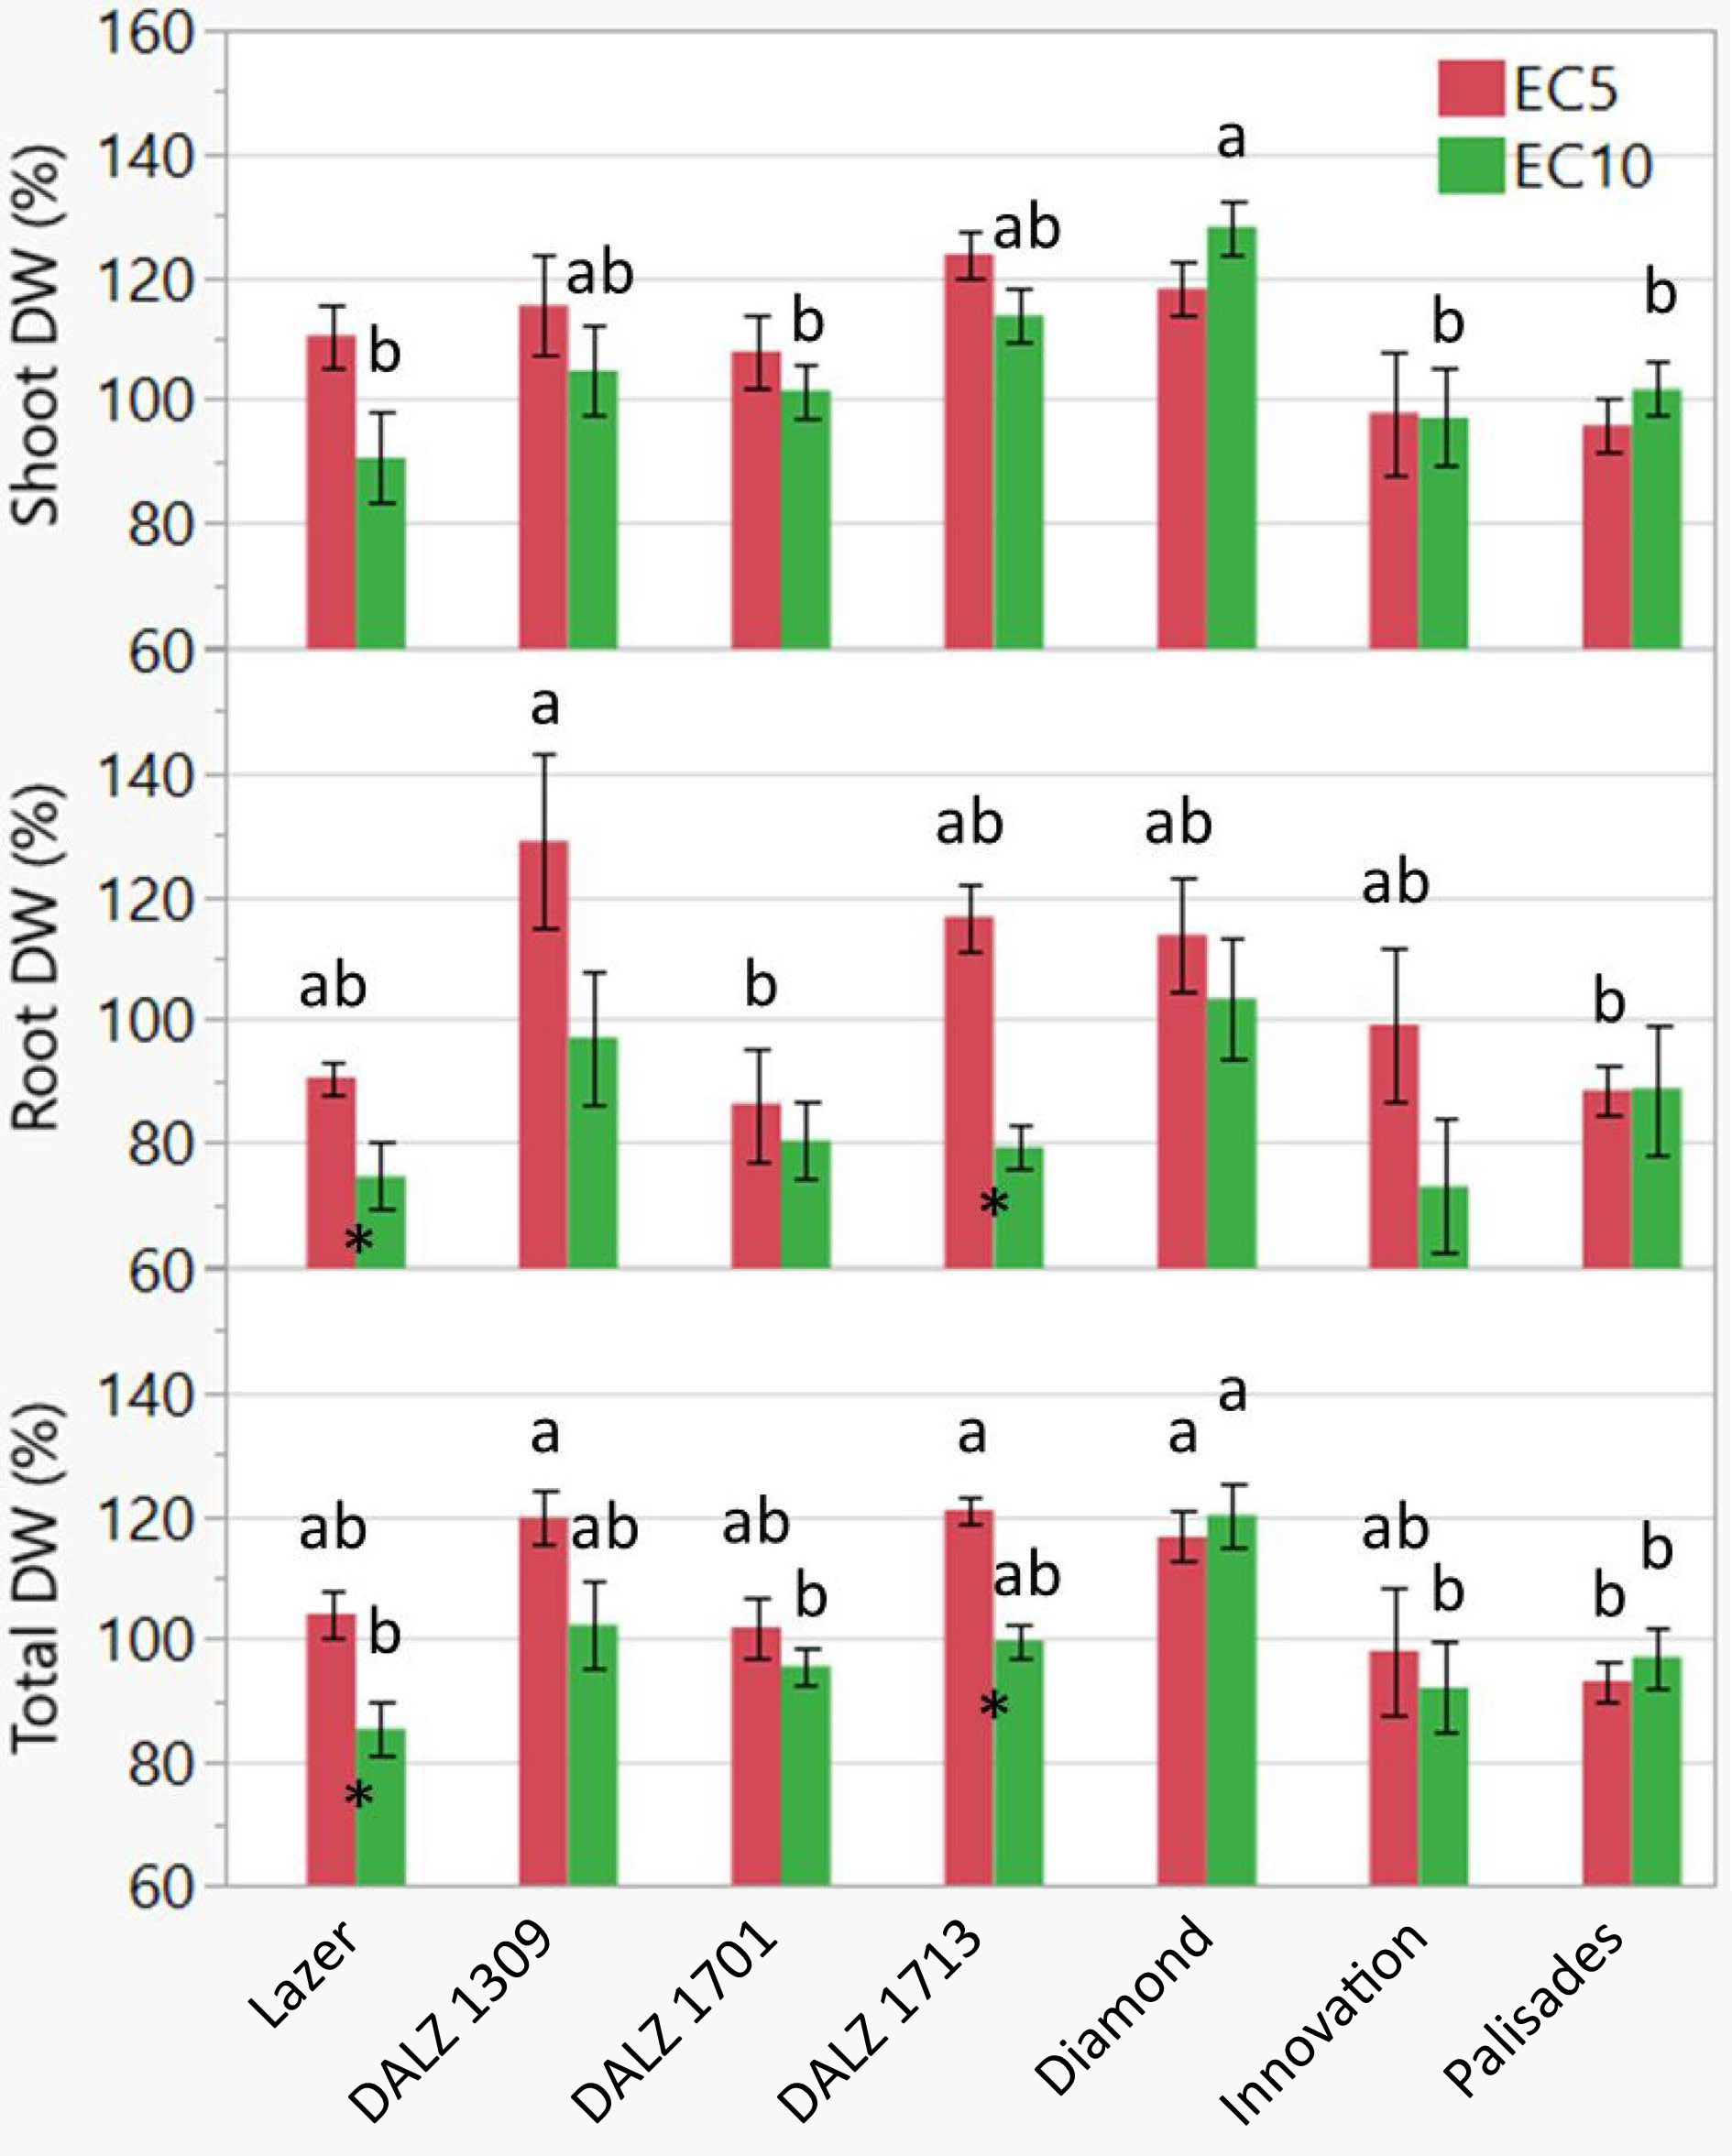
Figure 2.
Relative (percent of control) dry weight (DW) of shoot and root tissue, and the total (shoot + root) of the seven turfgrass genotypes treated with control or saline solutions (EC5 or EC10) for a total of eight weeks. Bars represent standard error (n = 8). Different letters indicate significant differences among genotypes for the same treatment according to Tukey's HSD test (P < 0.05). That is, the comparison was made for EC5 (red bars) or EC10 (green bars) separately. For those without any letters such as EC5 for shoot DW, no difference was observed. Asterisks indicate significant differences between treatments (EC5 and EC10) according to Student's t-test (P < 0.05). No asterisks mean no differences.
-
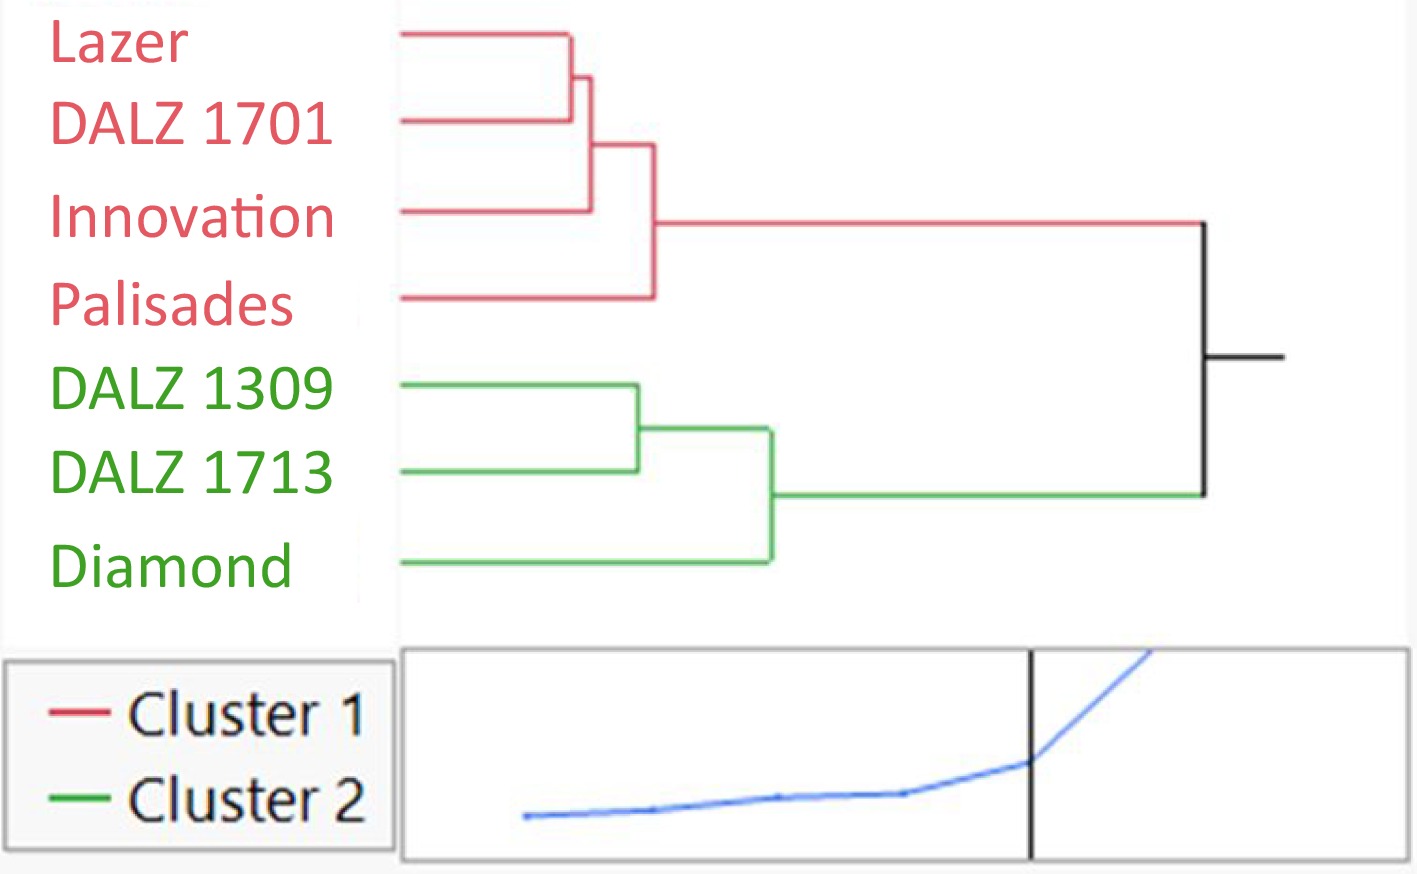
Figure 3.
Hierarchal cluster analysis based on relative (percent of control) tissue dry weight (DW) of the seven turfgrass genotypes treated with control or saline solutions (EC5 or EC10) for a total of eight weeks. Cluster 1 (red) indicates the least salt tolerant genotypes and Cluster 2 (green) indicates the most salt tolerant genotypes. The two clusters were determined by the distance graph at the bottom of the figure that shows the best separation between clusters.
-
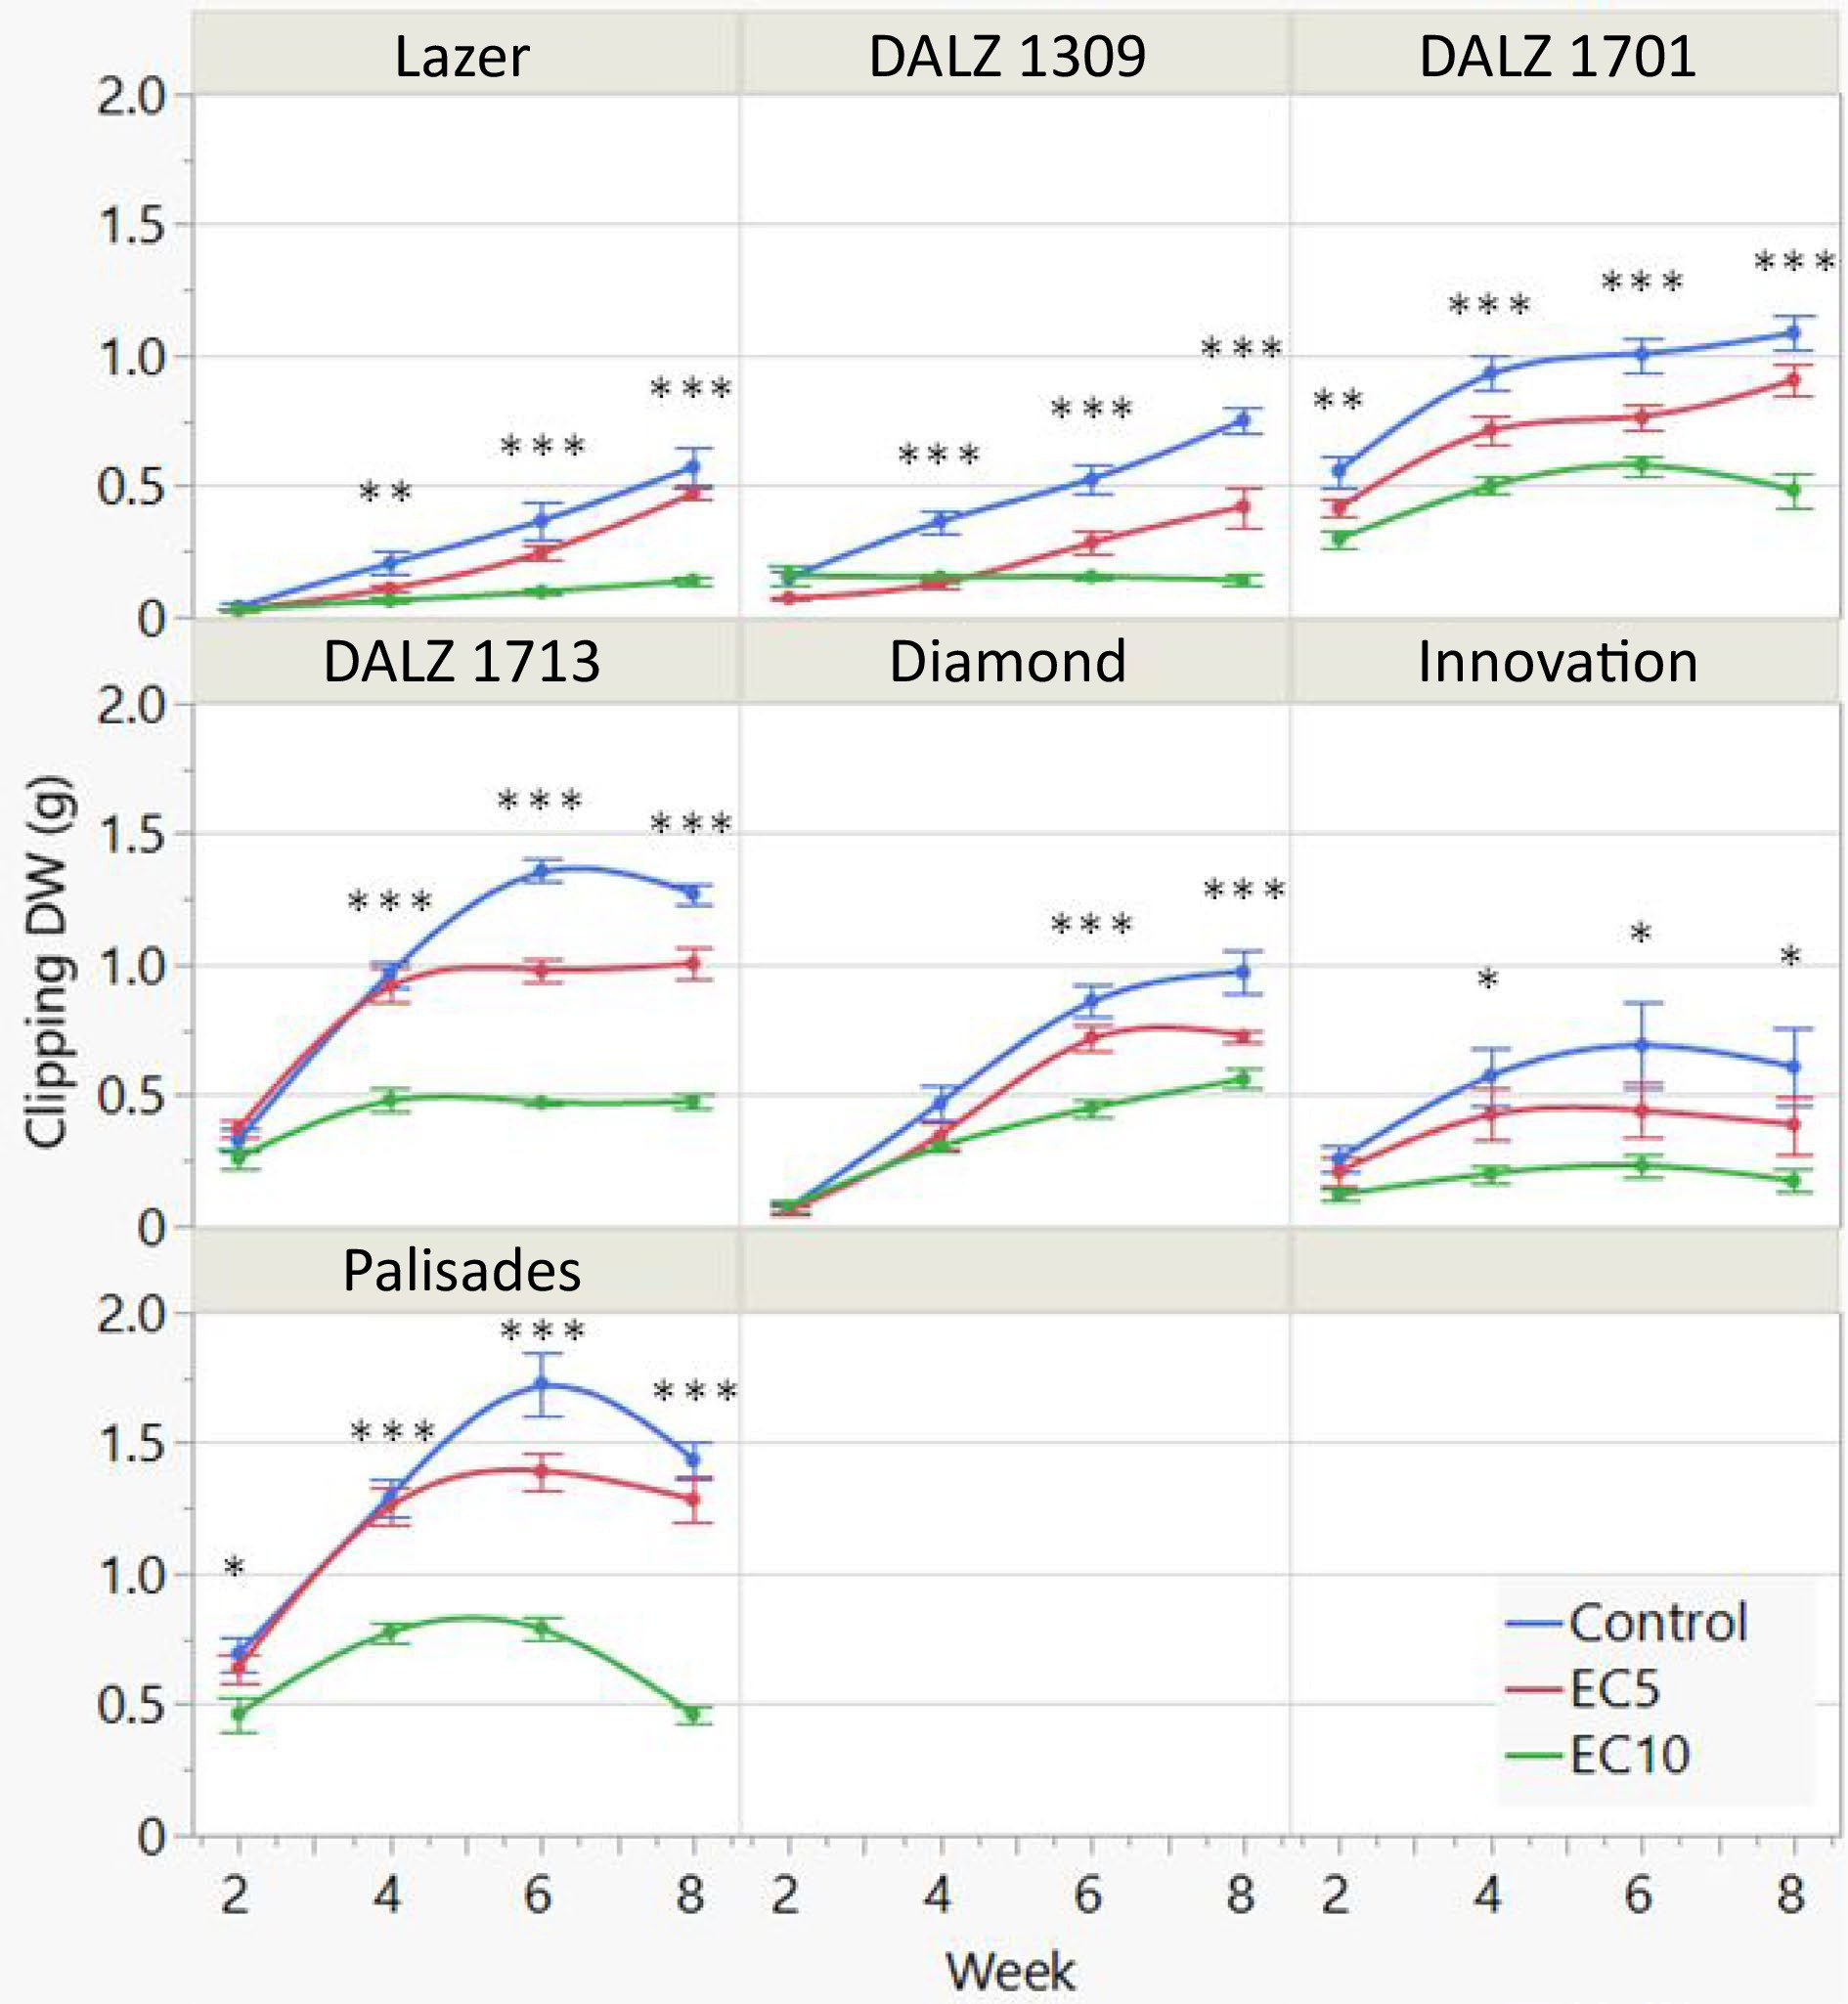
Figure 4.
Bi-weekly clipping dry weight (DW) of the seven turfgrass genotypes treated with control or saline solutions (EC5 or EC10: electrical conductivity at 5 or 10 dS m−1) for a total of eight weeks. The plants were clipped to a height of 2-cm. Bars represent standard error (n = 8). Significant differences among treatments per week are indicated by asterisks (*, P < 0.05; **, P < 0.01; and ***, P < 0.001).
-
Source Shoot DW Root DW Total DW R. Shoot DW R. Root DW R. Total DW GLA Clipping DW Shoot Na+ Shoot Cl− Model 0.0004 < 0.0001 < 0.0001 0.0003 0.0001 <.0001 < 0.0001 < 0.0001 < 0.0001 < 0.0001 Treatment (T) 0.008 0.0001 0.001 NS 0.0002 0.0013 < 0.0001 < 0.0001 < 0.0001 < 0.0001 Genotype (G) 0.0006 < 0.0001 < 0.0001 < 0.0001 0.0014 < 0.0001 < 0.0001 < 0.0001 < 0.0001 < 0.0001 T × G NS 0.0424 0.0109 NS NS NS < 0.0001 < 0.0001 < 0.0001 < 0.0001 Table 1.
ANOVA summary of the response variables of the seven zoysiagrass genotypes irrigated with a nutrient solution (control) or saline solution at electrical conductivity (EC) of 5 dS m−1 or 10 dS m−1 for eight weeks. The response variables are shoot DW (dry weight), root DW, total DW, relative shoot DW (R. shoot DW), relative root DW (R. root DW), relative total DW (R. total DW), green leaf area (GLA), cumulative clipping DW, shoot sodium (Na) and chloride (Cl) concentration.
-
Genotype Control EC5 EC10 Lazer 100.0 ± 0.0Aa 99.4 ± 0.6Aab 95 ± 2.1Ab DALZ 1309 95.6 ± 2.0Ba 88.8 ± 3.0Ca 69.4 ± 6.4Bb DALZ 1701 98.1 ± 0.9ABa 99.4 ± 0.6Aa 97.5 ± 0.9Aa DALZ 1713 100.0 ± 0.0Aa 99.4 ± 0.6Aa 100.0 ± 0.0Aa Diamond 99.4 ± 0.6ABa 100.0 ± 0.0Aa 98.8 ± 1.3Aa Innovation 98.1 ± 1.3ABa 91.9 ± 2.5BCab 88.1 ± 3.3Ab Palisades 100.0 ± 0.0Aa 98.1 ± 0.9ABa 98.1 ± 0.9Aa Different letters indicate significant differences Tukey's HSD test; uppercase among genotypes and lowercase among treatments. Table 2.
Green Leaf Area (GLA) index of the seven turfgrass genotypes treated with control or saline solutions (EC5 or EC10: electrical conductivity at 5 or 10 dS m−1) for a total of eight weeks. Means and standard errors are presented (n = 8). The GLA was assessed visually following a clipping.
-
Genotype Control EC5 EC10 Na+ Lazer 1.70 ± 0.04BCb 8.76 ± 0.90Aa 9.90 ± 0.42CDa DALZ 1309 2.07 ± 0.24ABCc 8.89 ± 0.13Ab 15.68 ± 1.43Aa DALZ 1701 1.39 ± 0.06Cc 6.58 ± 0.41Ab 7.92 ± 0.07Da DALZ 1713 2.79 ± 0.19Ac 9.33 ± 0.28Ab 12.86 ± 0.72ABCa Diamond 1.81 ± 0.02BCc 7.58 ± 0.33Ab 10.78 ± 0.36CDa Innovation 1.77 ± 0.15BCc 9.46 ± 1.02Ab 14.92 ± 0.56ABa Palisades 2.45 ± 0.37ABc 8.84 ± 1.12Ab 12.19 ± 0.30BCa Cl− Lazer 7.55 ± 0.30Ac 9.72 ± 0.56Db 14.00 ± 0.28Ba DALZ 1309 5.65 ± 0.23Ab 12.20 ± 0.02BCDb 23.97 ± 2.84Aa DALZ 1701 5.67 ± 0.22Ac 9.68 ± 0.68Db 13.25 ± 0.77Ba DALZ 1713 6.55 ± 0.10Ac 13.75 ± 0.31ABCb 19.15 ± 0.40ABa Diamond 6.43 ± 0.10Ac 11.52 ± 0.10CDb 15.38 ± 0.15Ba Innovation 5.72 ± 0.41Ac 14.88 ± 0.75ABb 25.18 ± 1.45Aa Palisades 7.27 ± 0.99Ab 15.97 ± 1.36Aa 18.87 ± 0.96ABa Means and standard errors are presented (n = 8). Different letters indicate significant differences Tukey's HSD test; uppercase among genotypes and lowercase among treatments. Table 3.
Sodium (Na+) and chloride (Cl−) content in the tissue of the seven turfgrass genotypes that were treated with control or saline solutions (EC5 or EC10: electrical conductivity at 5 or 10 dS m−1) for a total of eight weeks.
Figures
(4)
Tables
(3)