-

Figure 1.
Comparison of shoot growth and leaf anatomy between bermudagrass cultivars Yangjiang and Guanzhong. (a) Yangjiang exhibits more prostrate shoot growth whereas (b) Guanzhong exhibits more upright shoot growth. The leaves of Yangjiang have (c) no trichomes, whereas Guanzhong leaves have (d) many trichomes.
-
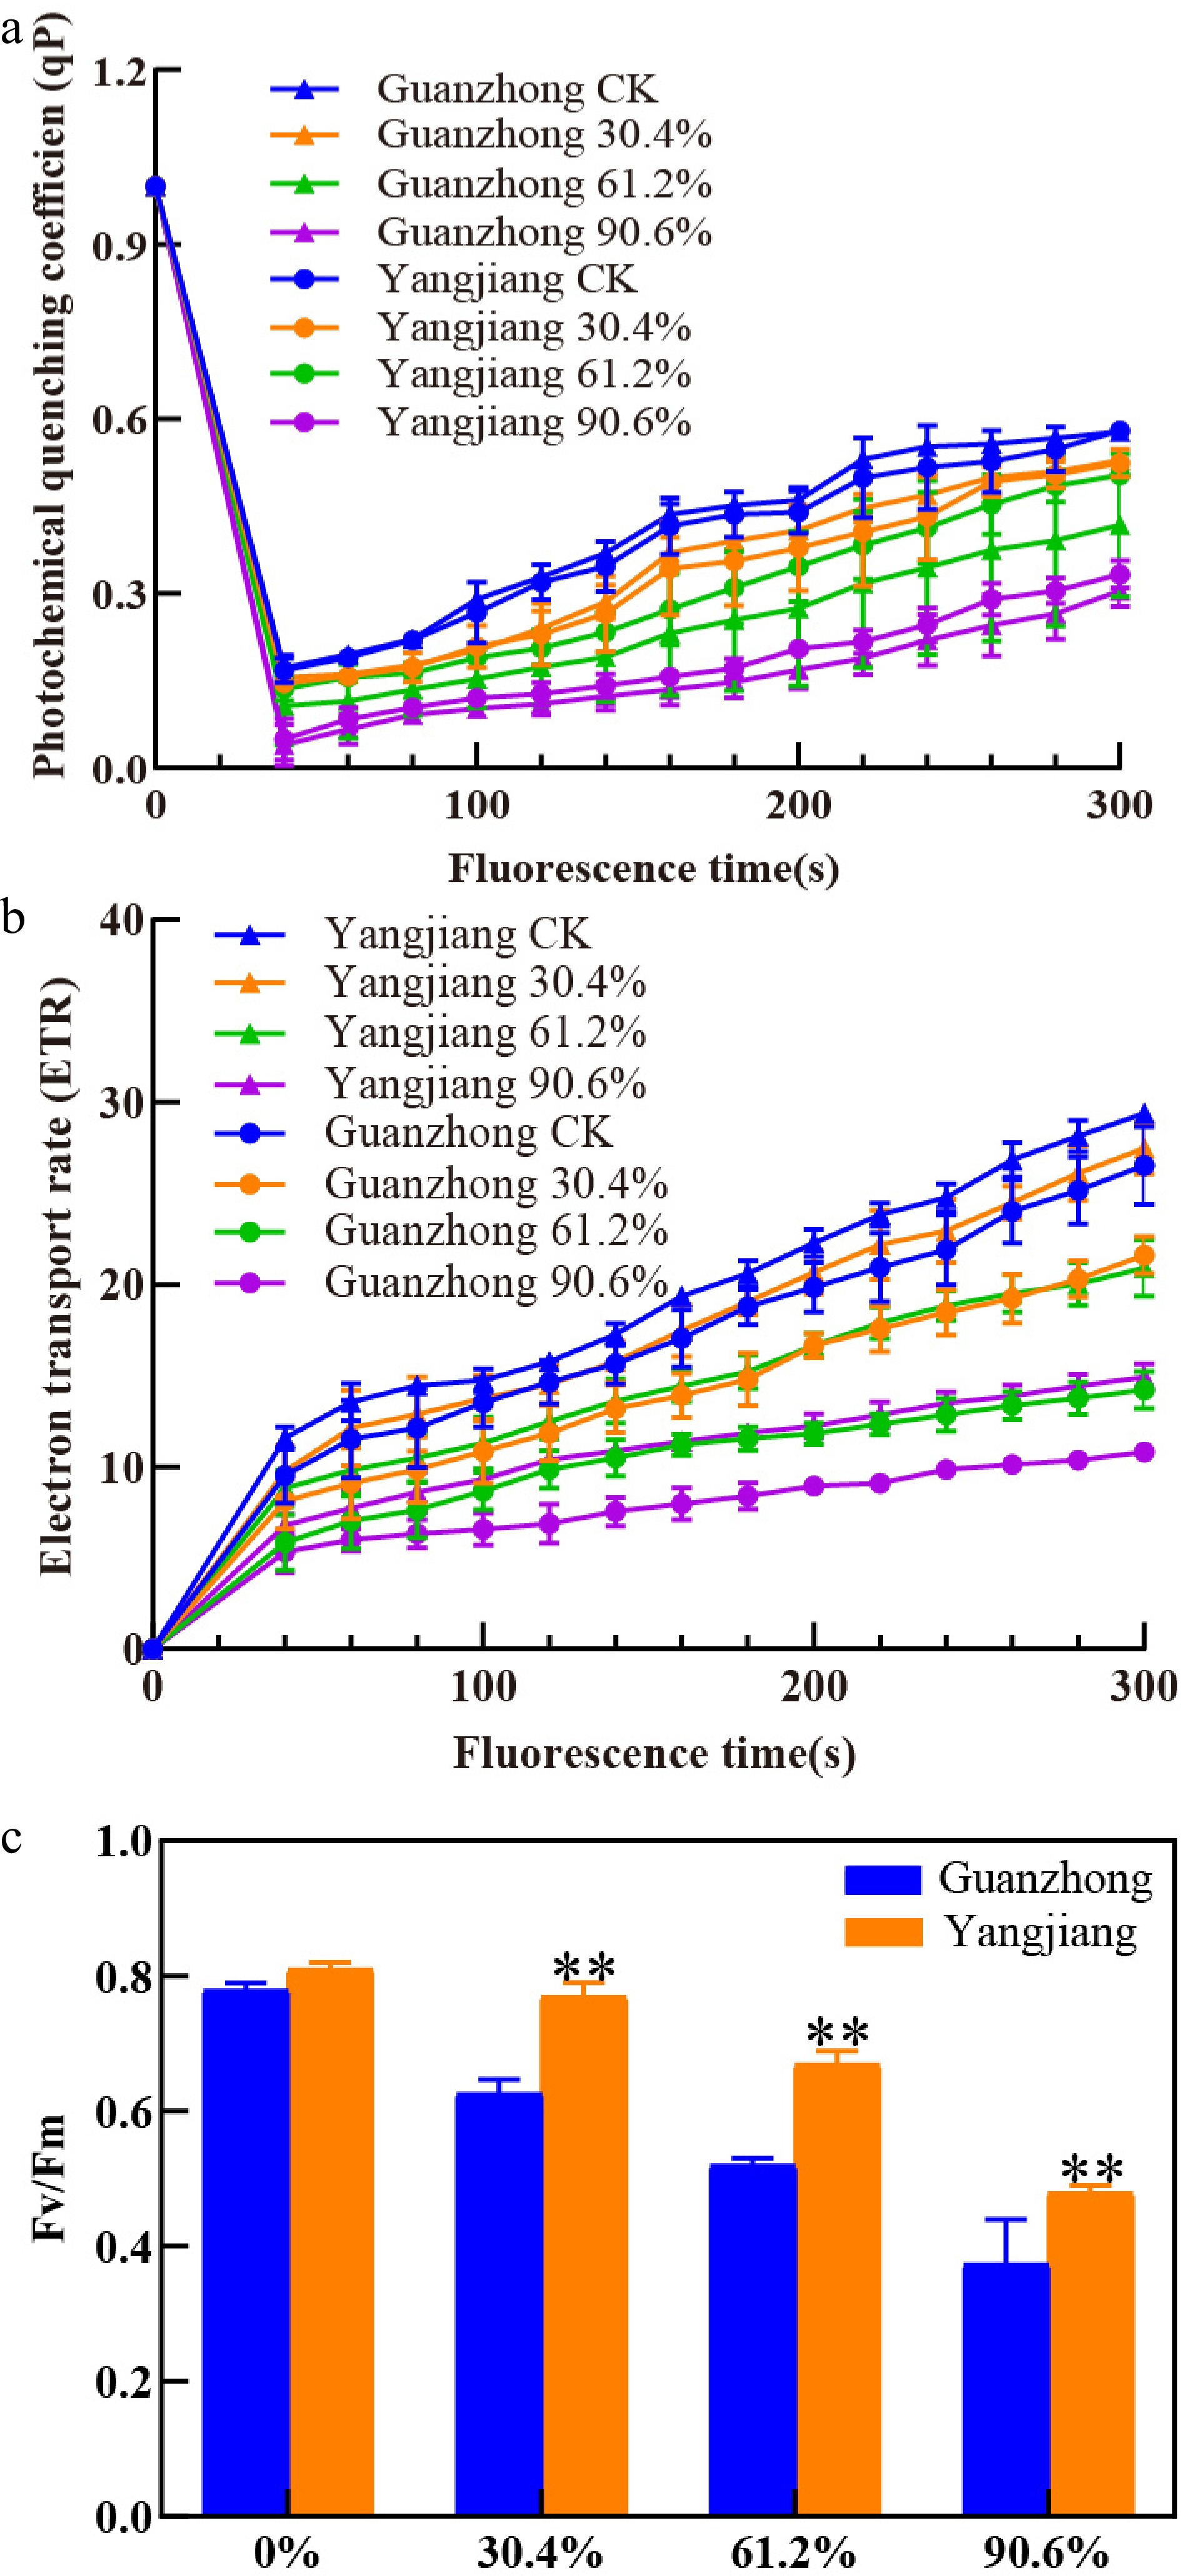
Figure 2.
Effects of shade on chlorophyll a fluorescence in Guanzhong and Yangjiang. (a) Photochemical quenching coefficient (qP), (b) electron transport rate (ETR), (c) ratio of variable fluorescence to maximal fluorescence (Fv/Fm) of both cultivars were measured under 30.4%, 61.2%, and 90.6% shade. ** indicates significant differences at 0.01 level between the two cultivars. CK, un-shaded control. Vertical bars represent standard errors of the mean (n = 4).
-

Figure 3.
Effects of shade on H2O2 production and antioxidant enzyme activity in Guanzhong and Yangjiang. (a) SOD, (b) POD, (c) CAT activities and (d) H2O2 production of both cultivars were measured under 30.4%, 61.2%, and 90.6% shade. * and ** indicate significant differences at 0.05 and 0.01 levels between the two cultivars, respectively. CK, un-shaded control. Vertical bars represent standard errors of the mean (n = 4).
-
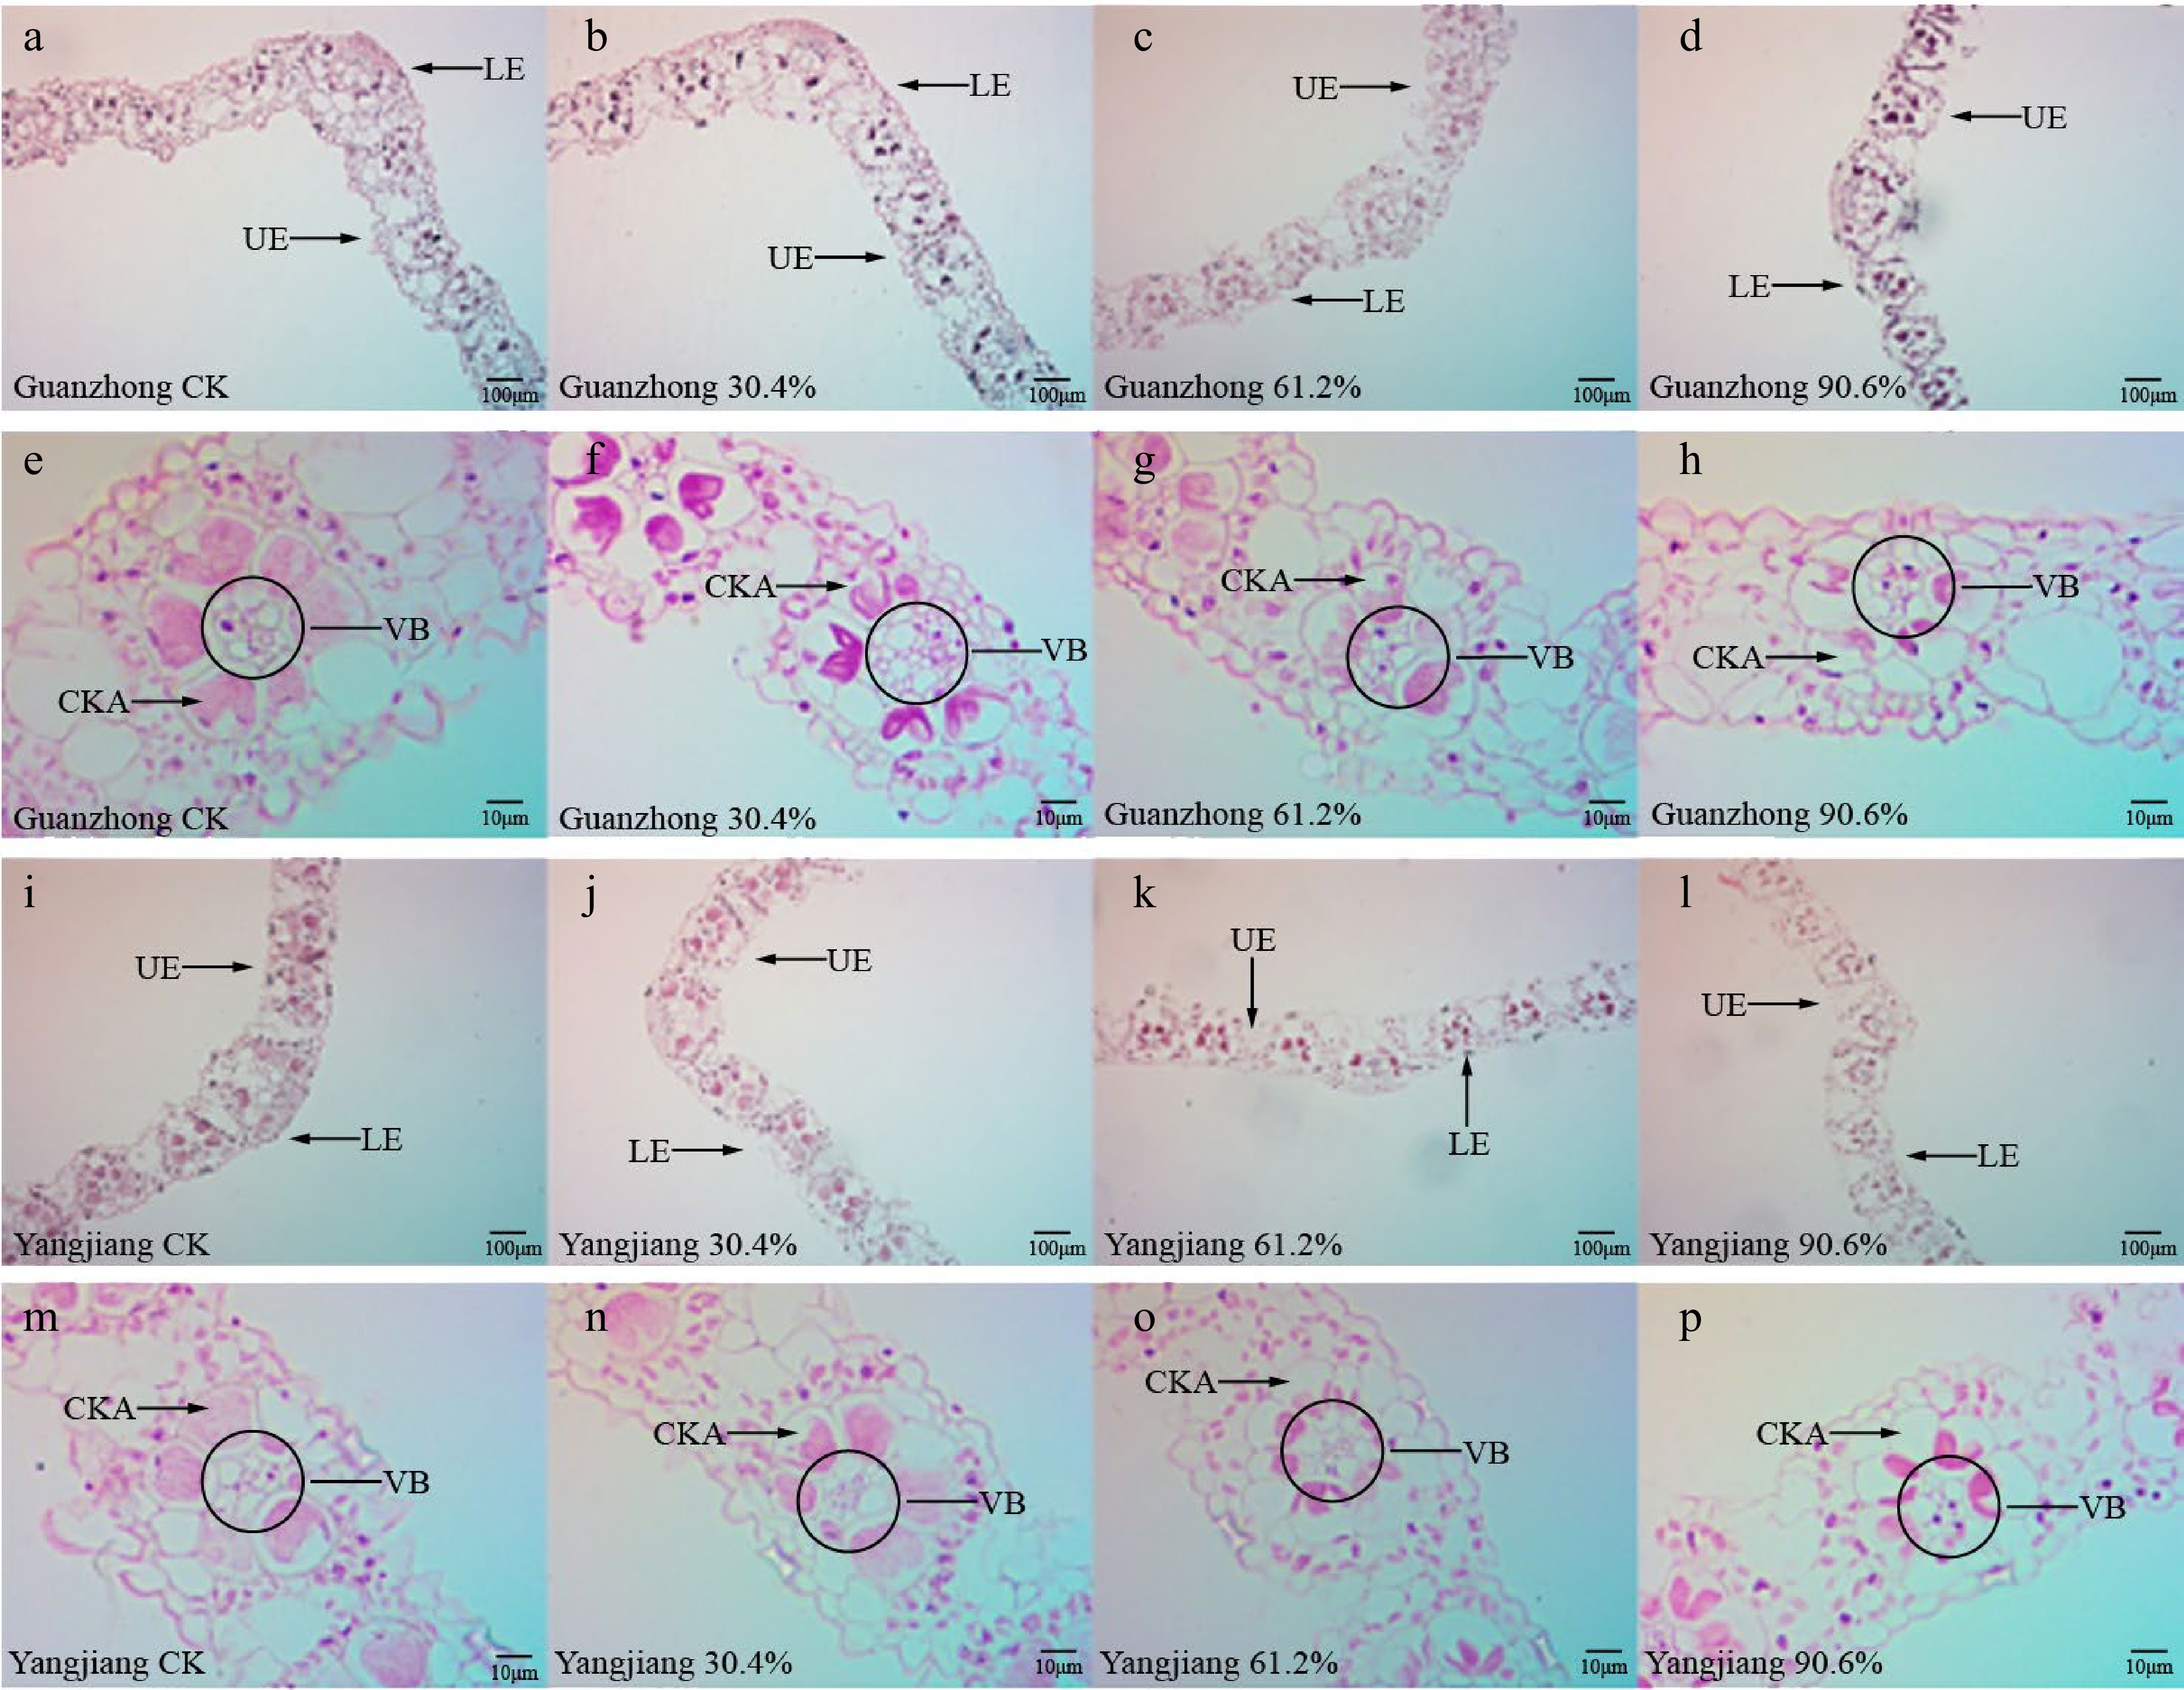
Figure 4.
Cross-sections of Guanzhong and Yangjiang leaves under different shading treatments. (a)−(d) Images of Guanzhong leaf ribs at 100× magnification highlighting the upper epidermal (UE) and lower epidermal (LE) cell layers of plants treated with (a) no shade, (b) 30.4% shade, (c) 61.2% shade, and (d) 90.6% shade. (e)−(h) Images of Guanzhong leaf ribs at 400× magnification highlighting the vascular bundle (VB) and cells of Kranz anatomy (CKA) of plants treated with (e) no shade, (f) 30.4% shade, (g) 61.2% shade, and (h) 90.6% shade. (i)−(l) Images of Yangjiang leaf ribs at 100× magnification highlighting the UE and LE cell layers of plants treated with (i) no shade, (j) 30.4% shade, (k) 61.2% shade, and (l) 90.6% shade. (m)−(p) Images of Yangjiang leaf ribs at 400× magnification highlighting the VB and CKA of plants treated with (m) no shade, (n) 30.4% shade, (o) 61.2% shade, and (p) 90.6% shade.
-
Cultivars Shading level (%) 5 d 20 d 35 d 50 d TCI TQ TCI TQ TCI TQ TCI TQ Guanzhong CK 7.2bc 8.2b 7.0c 8.5a 7.1b 8.5a 7.1bc 8.2b 30.4 7.3ab 8.3b 7.1bc 8.0b 7.2ab 7.9b 7.0c 7.7c 61.2 7.1c 8.2b 4.5e 4.7d 4.1d 4.3d 3.7f 3.9f 90.6 6.5d 7.6c 4.3f 4.4e 3.8e 4.1e 3.1g 3.5g Yangjiang CK 7.3ab 8.5a 7.3a 8.5a 7.3a 8.5a 7.2ab 8.3a 30.4 7.4a 8.5a 7.0c 8.5a 7.3a 8.5a 7.3a 8.0b 61.2 7.4a 8.5a 7.2ab 8.5a 7.3a 8.5a 6.2d 6.7d 90.6 7.2bc 8.5a 6.8d 7.7c 6.3c 7.0c 5.3e 5.7e Different lower case letters in the same column indicate significant difference at 0.05 probability level. CK, un-shaded control; d, number of days plants were exposed to shade. Table 1.
Effects of shade on turf quality (TQ) and turf color intensity (TCI) of Guanzhong and Yangjiang.
-
Cultivars Shading level (%) TB (g/per plant) AGB (g/per plant) BGB (g/per plant) RAB (g/per plant) Guanzhong CK 0.56 ± 0.04b 0.30 ± 0.04b 0.26 ± 0.02b 1.15 ± 0.03e 30.4 0.51 ± 0.05b 0.29 ± 0.0lb 0.22 ± 0.01c 1.31 ± 0.03cd 61.2 0.42 ± 0.04c 0.24 ± 0.01c 0.18 ± 0.01d 1.34 ± 0.04cd 90.6 0.33 ± 0.02d 0.19 ± 0.01d 0.14 ± 0.01e 1.36 ± 0.05bc Yangjiang CK 0.68 ± 0.04a 0.38 ± 0.01a 0.30 ± 0.01a 1.27 ± 0.03d 30.4 0.65 ± 0.04a 0.37 ± 0.01a 0.28 ± 0.01ab 1.33 ± 0.04cd 61.2 0.51 ± 0.02b 0.30 ± 0.01b 0.21 ± 0.01c 1.43 ± 0.07ab 90.6 0.42 ± 0.03c 0.25 ± 0.01c 0.17 ± 0.01d 1.47 ± 0.06a Data are mean ± SE (Standard Error). Different lower case letters in the same column indicate significant difference at 0.05 probability level. CK, un-shaded control. Table 2.
Effects of shade on total biomass (TB), above-ground biomass (AGB), below-ground biomass (BGB), and the ratio of above- to below-ground biomass (RAB) for Guanzhong and Yangjiang.
-
Cultivars Shading
level (%)1−15 d
(mm)16−30 d
(mm)31−45 d
(mm)Guanzhong CK 1.66 ± 0.04a 1.63 ± 0.03a 1.65 ± 0.04a 30.4 1.08 ± 0.02b 1.06 ± 0.02c 0.67 ± 0.03c 61.2 0.93 ± 0.03c 0.40 ± 0.01e 0.34 ± 0.01e 90.6 0.78 ± 0.04d 0.24 ± 0.01f 0.17 ± 0.01f Yangjiang CK 0.89 ± 0.06c 0.87 ± 0.03b 0.85 ± 0.04b 30.4 0.78 ± 0.04d 0.67 ± 0.02d 0.45 ± 0.02d 61.2 0.61 ± 0.03e 0.34 ± 0.01f 0.21 ± 0.01f 90.6 0.56 ± 0.07e 0.23 ± 0.01f 0.19 ± 0.01f Data are mean ± SE (Standard Error). Different lower case letters in the same column indicate significant difference at 0.05 probability level. CK, un-shaded control. Table 3.
Effect of shade on the average daily growth rate of Guanzhong and Yangjiang.
-
Cultivars Shading level (%) Chla [mg·g−1(FW)] Chlb [mg·g−1(FW)] Total Chl [mg·g−1(FW)] Chla/b Guanzhong CK 2.26 ± 0.08bc 4.33 ± 0.25cd 6.59 ± 0.28d 0.52 ± 0.02ab 30.4 2.11 ± 0.13bcd 4.03 ± 0.17d 6.14 ± 0.25de 0.52 ± 0.01ab 61.2 2.03 ± 0.06cd 4.06 ± 0.12d 6.09 ± 0.17e 0.50 ± 0.07ab 90.6 1.92 ± 0.02d 3.63 ± 0.04e 5.54 ± 0.12f 0.53 ± 0.05a Yangjiang CK 2.72 ± 0.21a 5.48 ± 0.22a 8.20 ± 0.28a 0.50 ± 0.03ab 30.4 2.65 ± 0.08a 5.18 ± 0.08a 7.83 ± 0.11b 0.51 ± 0.02ab 61.2 2.31 ± 0.21b 4.86 ± 0.16b 7.17 ± 0.16c 0.48 ± 0.05b 90.6 2.04 ± 0.14cd 4.52 ± 0.23c 6.56 ± 0.21d 0.45 ± 0.03b Data are mean ± SE (Standard Error). Different lower case letters in the same column indicate significant difference at 0.05 probability level. CK, un-shaded control. Table 4.
Effects of shade on leaf chlorophyll a (Chla), chlorophyll b (Chlb), total chlorophyll (Total Chl) contents, and the ratio of Chla to Chlb (Chla/b) in Guanzhong and Yangjiang.
-
Cultivars Shading level (%) Leaf thickness (μm) Thickness of UEC (μm) Thickness of LEC (μm) Vascular diameter (μm) Guanzhong CK 146.34 ± 6.34a 8.34 ± 1.17a 7.98 ± 1.23a 119.34 ± 6.32a 30.4 134.78 ± 7.25b 7.18 ± 1.26ab 6.25 ± 1.16abc 98.56 ± 5.26bc 61.2 122.91 ± 8.26bc 5.19 ± 1.86bc 4.98 ± 1.36bcd 76.69 ± 7.32ef 90.6 93.33 ± 6.31d 3.17 ± 1.79c 3.12 ± 1.79d 65.53 ± 6.29f Yangjiang CK 131.83 ± 5.32b 7.51 ± 1.66ab 6.97 ± 1.78ab 108.76 ± 7.67ab 30.4 122.84 ± 6.69bc 6.23 ± 1.47ab 5.81 ± 1.32abcd 94.32 ± 6.34cd 61.2 118.84 ± 4.86c 5.98 ± 1.25ab 4.96 ± 1.86bcd 84.09 ± 5.21de 90.6 102.71 ± 7.32d 4.78 ± 1.38bc 3.32 ± 1.79cd 72.32 ± 4.29f Data are mean ± SE (Standard Error). Different lower case letters in the same column indicate significant difference at 0.05 probability level. CK, un-shaded control. UEC, upper epidermal cells. LEC, lower epidermal cells. Table 5.
Effects of shade on leaf anatomical structures in Guanzhong and Yangjiang.
Figures
(4)
Tables
(5)