-

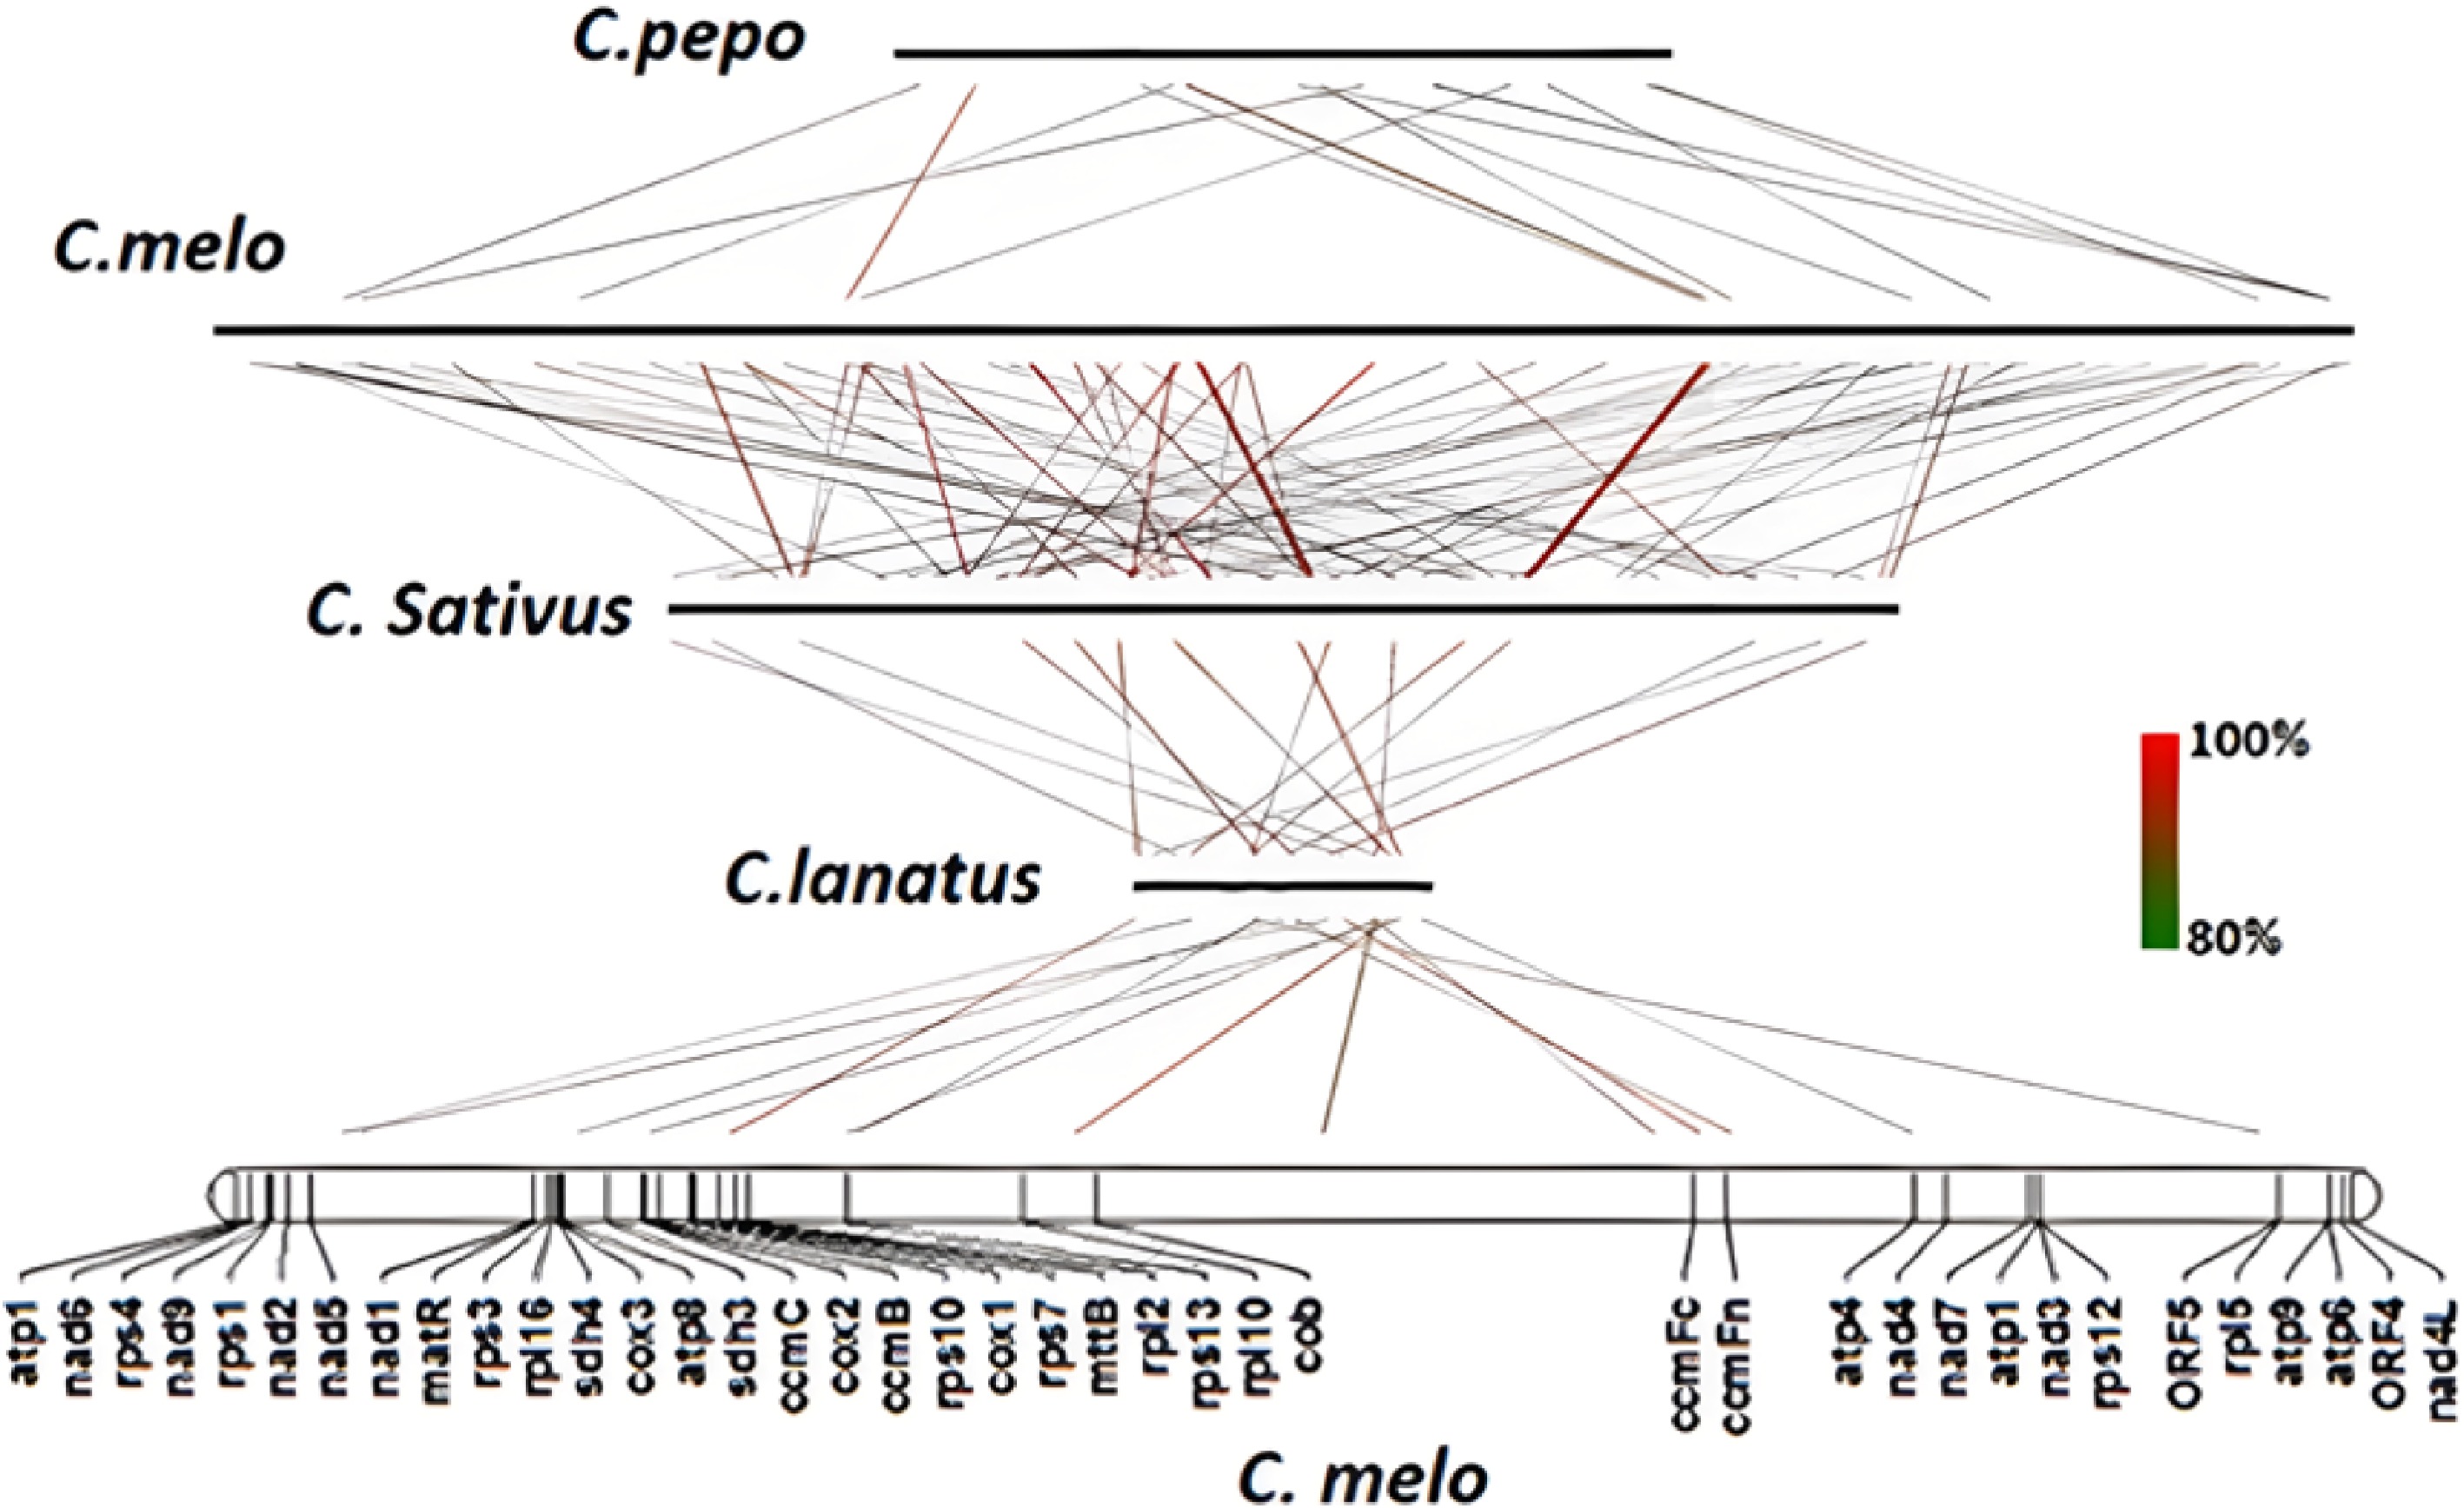
Figure 1.
Collinearity analysis of C. melo mitochondrial genome with other three Cucurbitaceae plants.
-

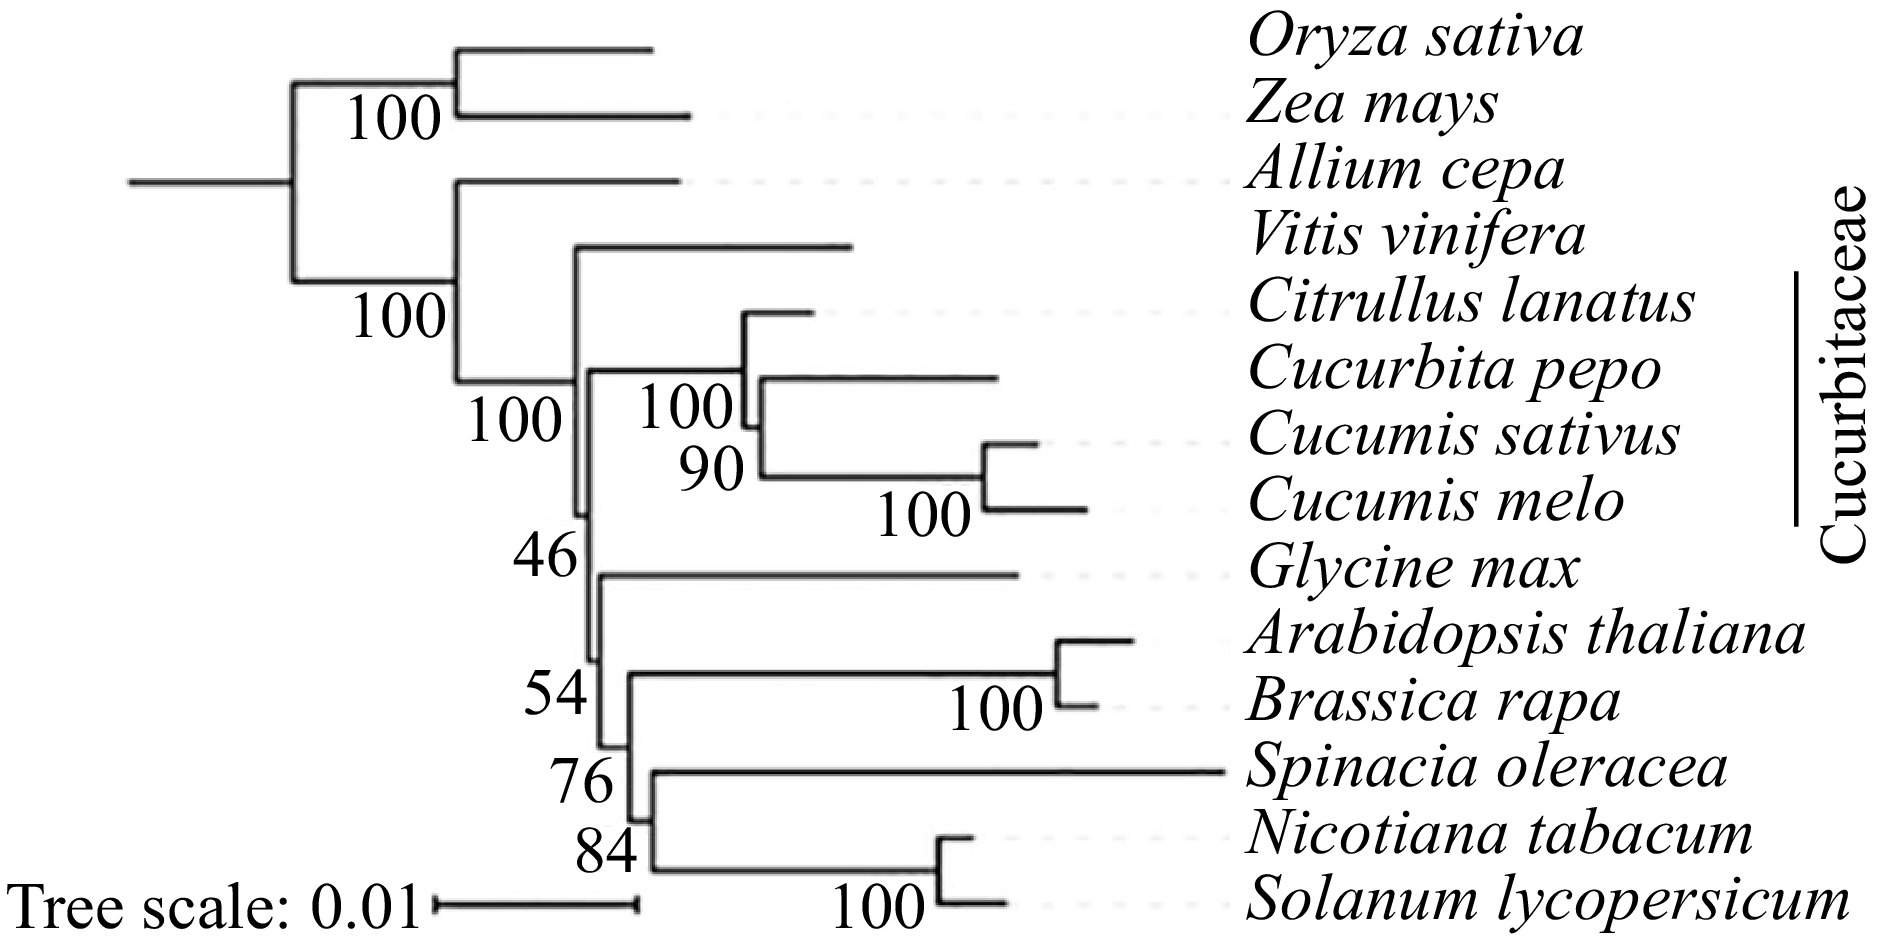
Figure 2.
The construction of phylogenetic tree among 14 species based on mitochondrial conserved genes.
-
Feature Value Total length (bp) 2,906,673 Chromosome number 3 GC content 44.77% Gene number 88 Protein genes 40 rRNA genes 8 tRNA genes 40 Genes with introns 10 Trans-spliced genes 3 Coding sequence 1.54% Protein coding 1.23% tRNAs and rRNAs 0.31% Non-coding sequence 98.46% Repetitive content 44.2% SSRs 0.1% (218) Tandem repeats (TRs) 2.1% (653) Inverted repeats (IRs) 2.4% (439) Forward repeats (FRs) 39.4 (4,861) Chloroplast-like 2.73% Nuclear-like 48.62% Table 1.
The basic features of the C. melo mitochondrial genome.
-
Species Amount C. melo C. lanatus 7 nad6-rps4; trnY-nad2; trnF-trnS; rps3-rpl16; sdh4-cox3-atp8; rrn5s-rrn18s; nad3-rps12 C. sativus 13 nad6-rps4; nad9-rps1; nad2-sdh3; trnF-trnS; matR-trnH; rps3-rpl16; sdh4-cox3-atp8; rrn5S-rrn18S; rpl10-trnD; ccmFc-trnW-atp4; nad3-rps12; atp9-atp6 C. pepo 8 nad6-rps4; nad9-rps1; rps3-rpl16; sdh4-cox3-atp8; rrn5S-rrn18S; nad3-rps12; atp9-atp6; trnM-trnG Gene clusters in bold are the gene clusters common to the four mitochondrial genomes. Table 2.
The gene clusters of melon collinearity with three other mitochondrial genomes.
-
Feature C. melo C. lanatus C. sativus C. pepo Genome Accession MG947207
MG947208
MG947209NC_014043 NC_016004
NC_016005
NC_016006NC_014050 Size in bp 2,906,673 379,236 1,644,236 982,833 Chromosome number 3 1 3 1 Topology Structure Circle Circle Circle Circle GC content (%) 44.8% 45.1% 44.3% 42.8% Gene Protein-coding genes 40 39 37 38 Protein-coding genes in bp (%) 35,613 (1.23%) 32,370 (8.5%) 32,550 (3.31%) 32,032 (3.26%) Single-copy protein genes 37 37 37 37 Single-copy protein genes in bp (%) 34,080 (1.17%) 31,986 (8.4%) 32,550 (3.31%) 31,806 (3.23%) Intron Trans-spliced 5 4 5 5 Cis-spliced 17 20 18 19 Cis-spliced introns in bp (%) 46,000 (1.6%) 32,476 (8.6%) 47,996 (2.9%) 30,557 (3.1%) tRNA genes 40 18 20 13 Native 17 3 7 3 Chloroplast-derived 23 15 13 10 Total tRNAs in bp (%) 2,999 (0.1%) 1,358 (0.4%) 1,486 (0.09%) 966 (0.1%) rRNA genes 8 3 6 3 Total rRNAs in bp (%) 5,815 (0.2%) 5,148 (1.4%) 11044 (0.67%) 5,109 (0.5%) Noncoding regions in bp (%) 2,862,246 (98.5%) 340,360 (89.7%) 1,599,156 (97.3%) 944,726 (96.1%) Repetitive content SSR (num.) 0.1% (218) 0.2% (54) 0.1% (144) 0.2% (144) TR (num.) 2.1% (653) 0.3% (14) 0.4% (120) 1.9 (287) IR (pairs) 2.4% (439) 0.4% (14) 6.3% (539) 0.2% (17) FR (pairs) 39.6% (4861) 8.7% (209) 37.3% (4974) 22.1% (1608) Maximum large repeat length (bp) 5,532 7,286 17,159 621 Number of repeats (>1 kb) 87 1 10 0 Total repeats (%) 44.2% 9.6% 44.1% 24.4% Chloroplast-like in bp (%) 79,463 (2.73%) 28,703 (7.6%) 70,702 (4.3%) 113,347(11.5%) Mitochondrial-like in bp (%) 967,450 (33.3%) 159,032 (41.9%) 907,251 (55.2%) 180,008 (18.3%) Nuclear-like in bp (%) 1,413,224 (48.62%) 24,352 (6.4%) 501,491 (30.5%) 20,638 (2.1%) Table 3.
Mitochondrial genome summary of C. melo, C. sativus, C. pepo and C. lanatus
-
Gene C. melo C. lanatus C. sativus C. pepo Complex I nad1,2,3,4,4L,5,6,7,9 + + + + Complex II sdh3 + 2 + + sdh4 + + + + Complex III cob + + + + Complex IV cox1,2,3 + + + + Complex V atp1 2 + + + atp4,6,8,9 + + + + Cytochrome c biogenesis ccmB, C, Fc, Fn + + + + Ribosomal RNAs rrn5S 6 + 2 + rrn18S + + 2 + rrn26S + + 2 + Ribosomal proteins rpl2,5,16 + + + + rpl10 + − + − rps1,3,4,7,10,12,13 + + + + rps19 − 2 − 2 Other ORFs matR, mttB + + + + orf1,2 + − − − Total number 48 42 43 41 +: indicates the presence and uniqueness of this gene; −: represents the absence of this gene, and the number represents the copy number of this gene. Table 4.
Comparison of the gene content among C. melo, C. sativus, C. pepo and C. lanatus mitochondrial genome.
-
tRNA C. melo C. lanatus C. sativus C. pepo trnC-GCA M MM M M trnD-GUC CCMM − C − trnE-UUC M M MM M trnF-GAA CM M CCC M trnfM-CAU − M M M trnG-GCC CM MM M M trnH-GUG CCM C CC C trnI-CAU − M MM M trnK-UUU − M − M trnL-CAA CM − − − trnM-CAU CCCMMM C M C trnN-GUU CCMM C − C trnP-UGG M M M M trnQ-UUG MM MM M M trnR-ACG M − M − trnS-GCU M M M − trnS-UGA C M − − trnV-GAC C − − − trnW-CCA CCCMMMM − C − trnY-GUA M M M M Choloroplast-derived 17 3 7 3 Mitochondrial-derived 23 15 13 10 Total (type) 40 (18) 18 (15) 20 (15) 13 (13) Table 5.
Comparison of the tRNA genes.
-
Order Genes C. melo C. lanatus C. sativus C. pepo 1 Atp1 4 5 5 5 2 Atp4 11 13 12 13 3 Atp6 23 22 22 22 4 Atp8 2 4 2 2 5 Atp9 5 6 5 6 6 ccmB 34 34 33 30 7 ccmC 28 27 27 26 8 ccmFc 17 17 18 17 9 ccmFn 36 36 36 35 10 Cob 16 14 16 14 11 Cox1 17 17 18 19 12 Cox2 13 13 13 13 13 Cox3 8 9 8 7 14 matR 12 12 12 12 15 mttB 27 24 23 24 16 Nad1 21 21 21 20 17 Nad2 25 25 25 24 18 Nad3 12 12 12 10 19 Nad4 37 38 36 33 20 Nad4L 13 13 13 13 21 Nad5 28 27 28 23 22 Nad6 15 10 10 10 23 Nad7 25 27 27 26 24 Nad9 7 7 7 7 25 Rpl2 5 3 3 2 26 Rpl5 10 10 9 8 27 Rpl16 5 5 5 5 28 Rps1 3 4 3 4 29 Rps3 7 9 7 8 30 Rps4 17 17 17 18 31 Rps7 2 2 2 2 32 Rps10 6 5 6 5 33 Rps12 5 7 7 7 34 Rps13 4 3 3 4 35 Rps19 pseudo 3 pseudo 4 36 Sdh3 3 4 3 5 37 Sdh4 4 4 4 3 Total − 507 509 498 486 Note: pseudo indicates that the gene is a pseudogene. Table 6.
Number of RNA editing sites in the four mitochondrial genomes.
Figures
(2)
Tables
(6)