-
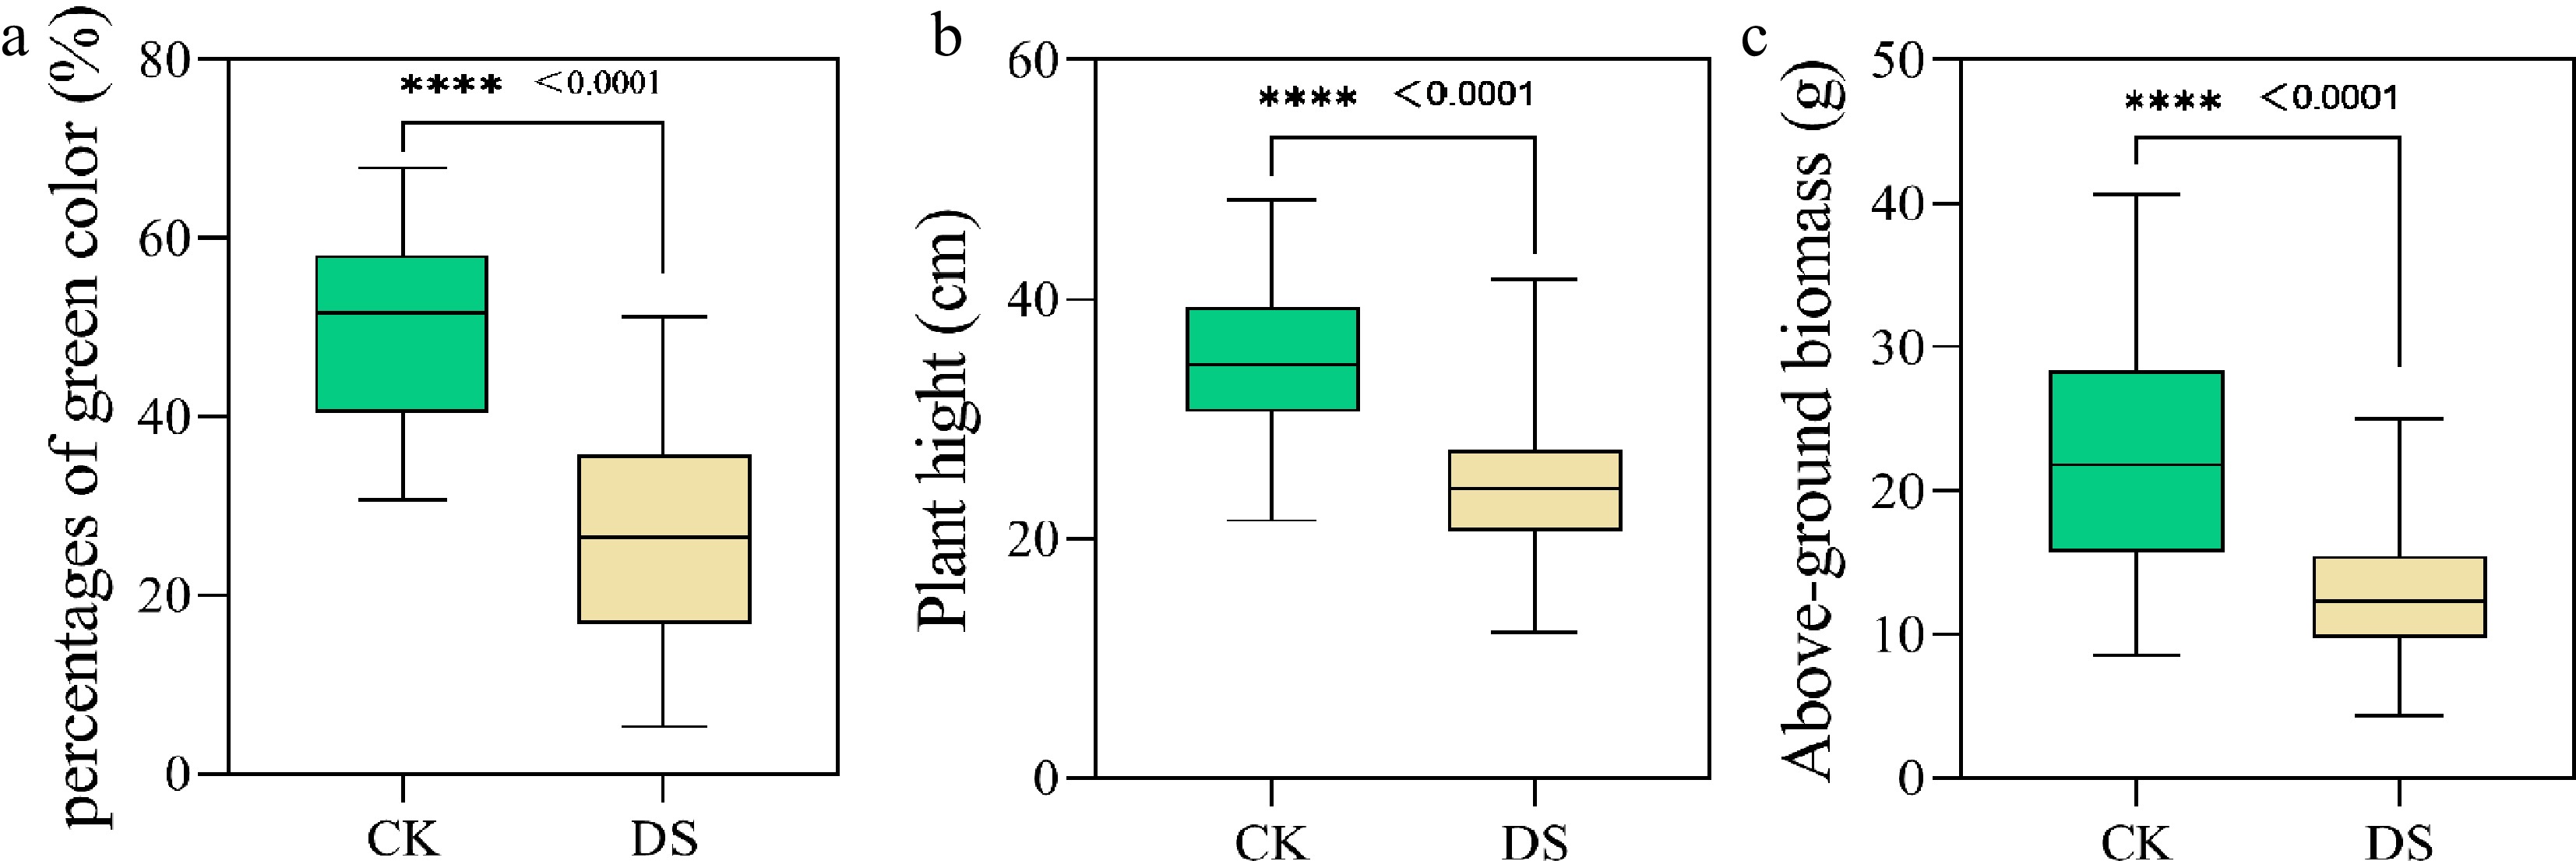
Figure 1.
Phenotypic analysis of the PH, AGB, and PGC of the 80 cotton genotypes at the initial flowering stages. AGB, above-ground biomass; DS, drought stress; CK, control check; PH, plant height; PGC, percentages of green color. **** P < 0.0001.
-
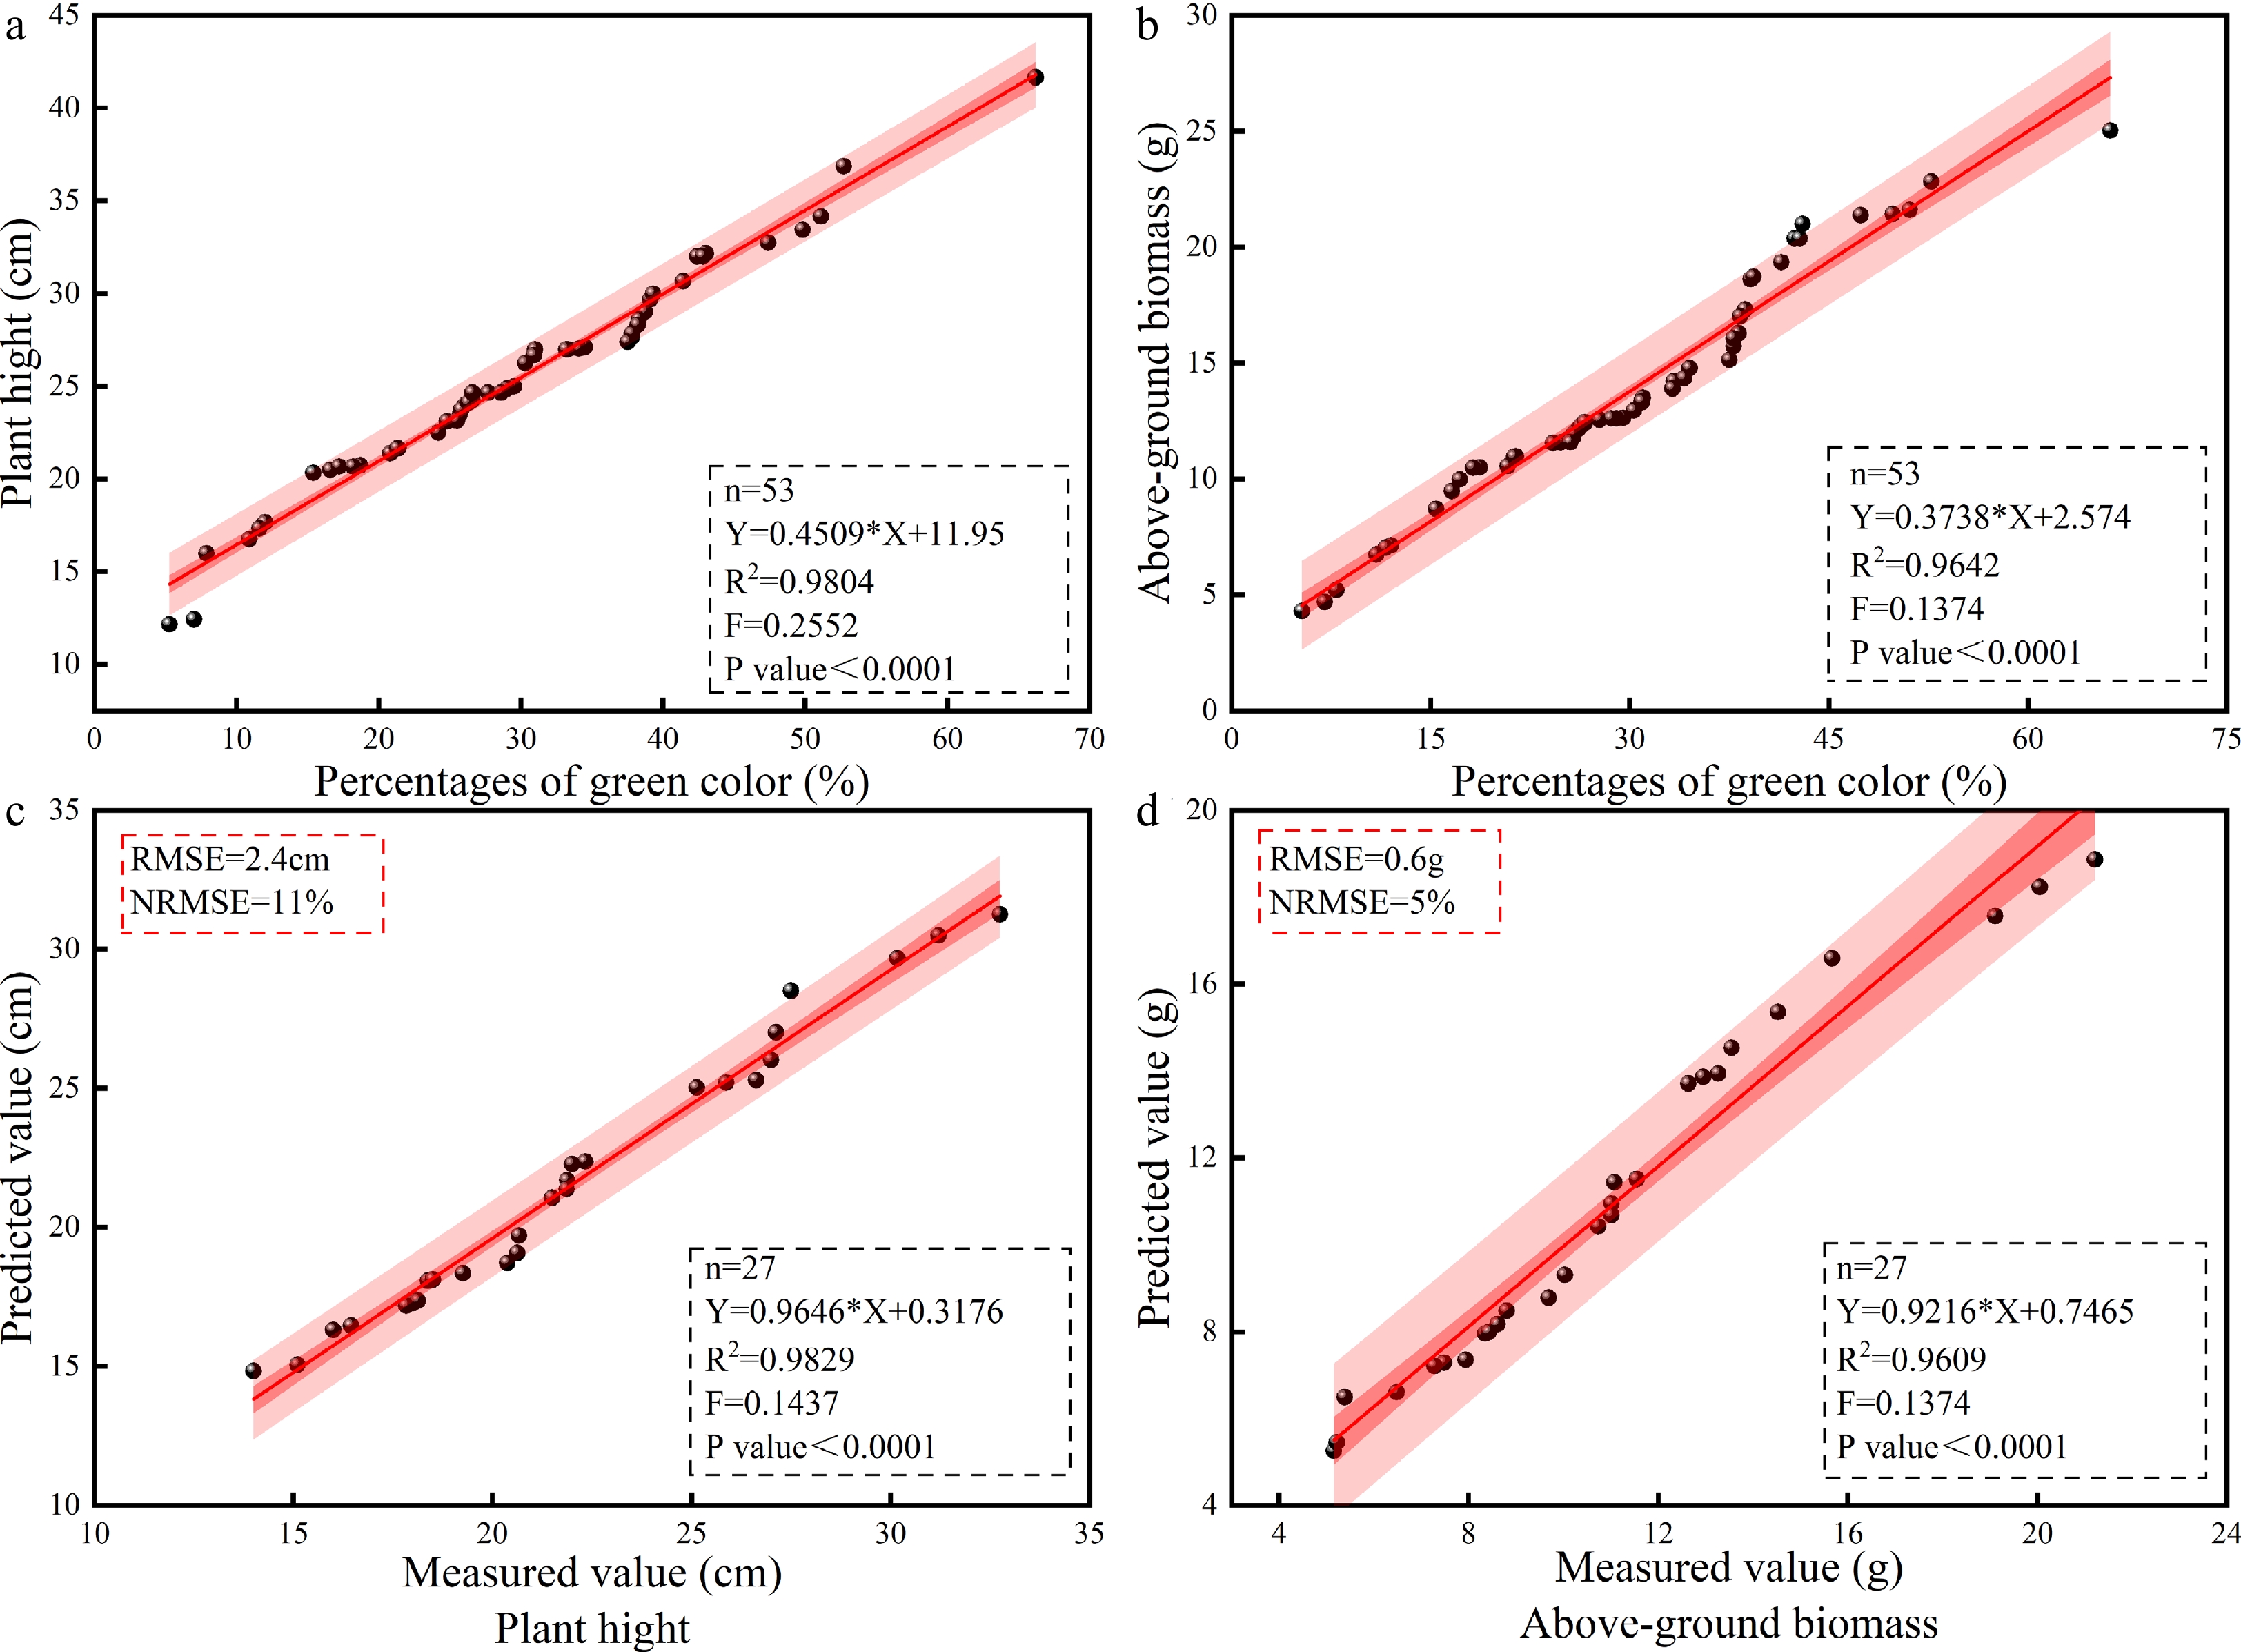
Figure 2.
Validation results of the PH and AGB prediction model for the different cotton genotypes. Model fitting of (a) PGC and PH, (b) measured and predicted PH values, (c) PGC and AGB, (d) measured and predicted AGB values. N, number of samples; R2, coefficient of determination (according to formula [1]); RMSE, root mean square error (according to formula [2]); NRMSE, standard root mean square error (according to formula [3]); AGB, above-ground biomass; PGC, percentages of green color; PH, plant height.
-
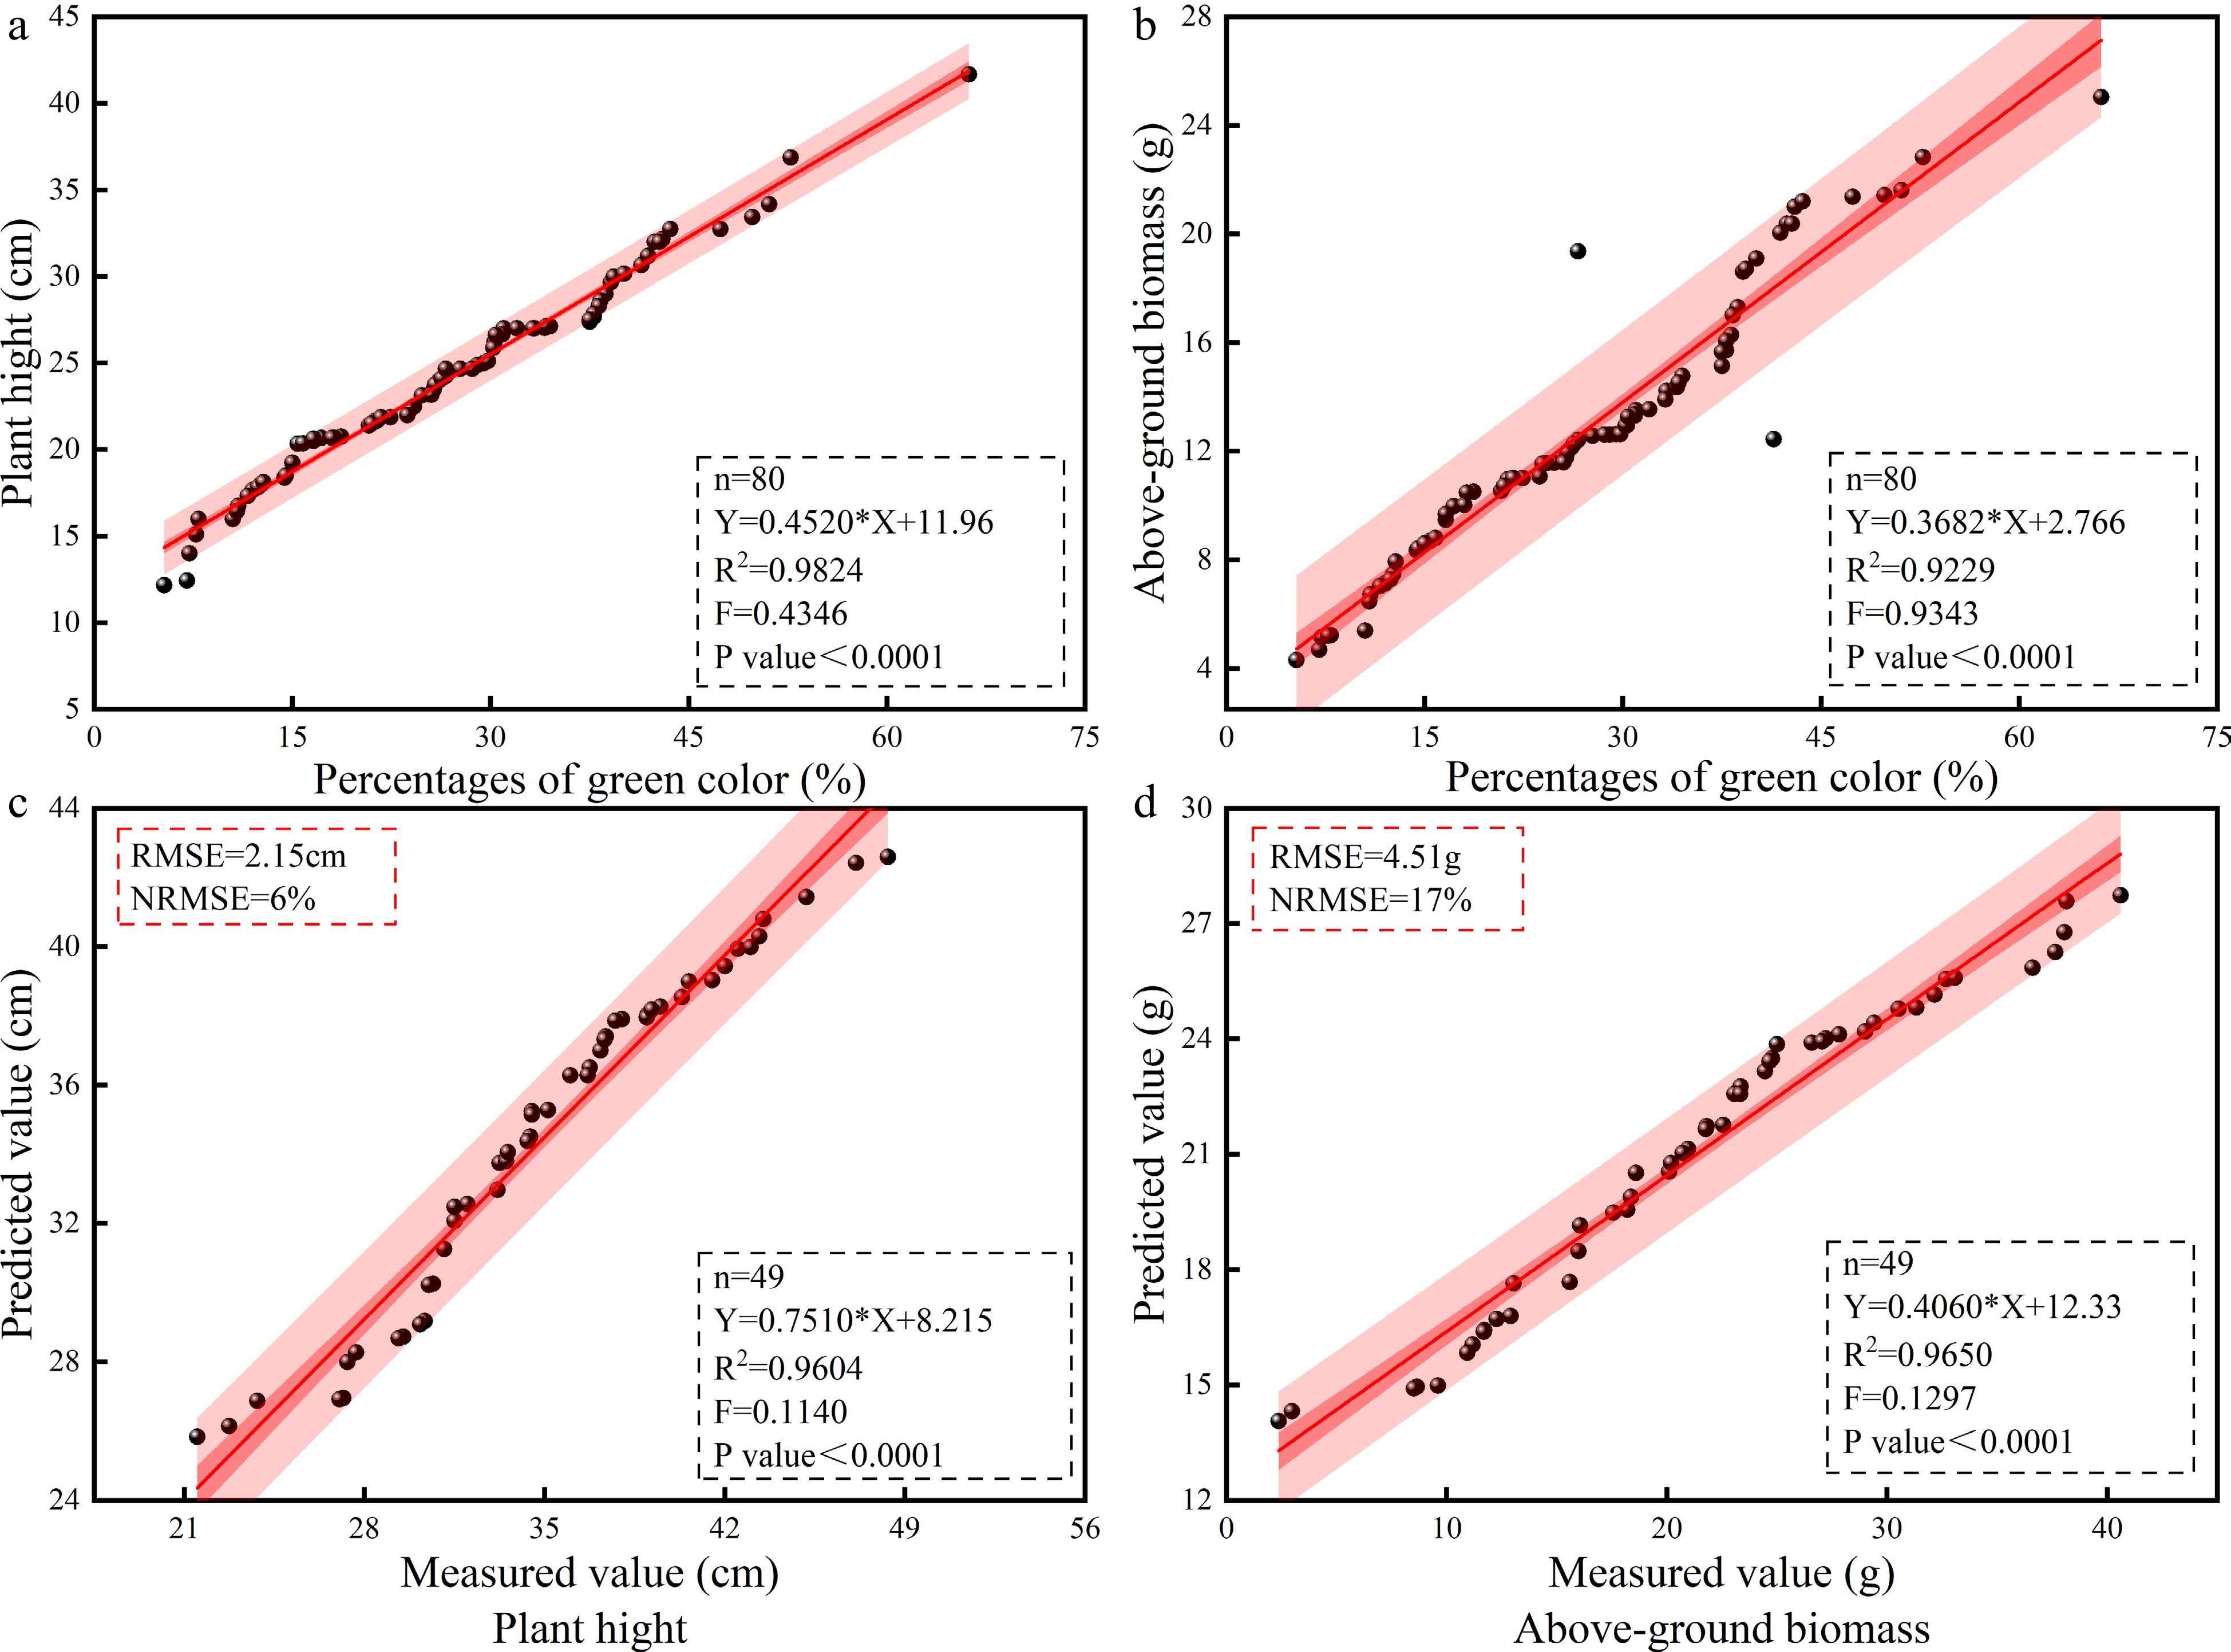
Figure 3.
The fitting effects of the PGC, PH, and AGB models under the DS and CK conditions. (a) The PGC and PH models under DS. (b) The fitting effect of the measured and predicted PH values in the CK, (c) PGC, and AGB model under DS. (d) The fitting effect of the measured and predicted AGB values. N, the number of samples; R2, coefficient of determination (according to formula [1]); RMSE, root mean square error (according to formula [2]); NRMSE, standard root mean square error (according to formula [3]); AGB, above-ground biomass; CK, control check; DS, drought stress; PGC, percentage of green color; PH, plant height.
-
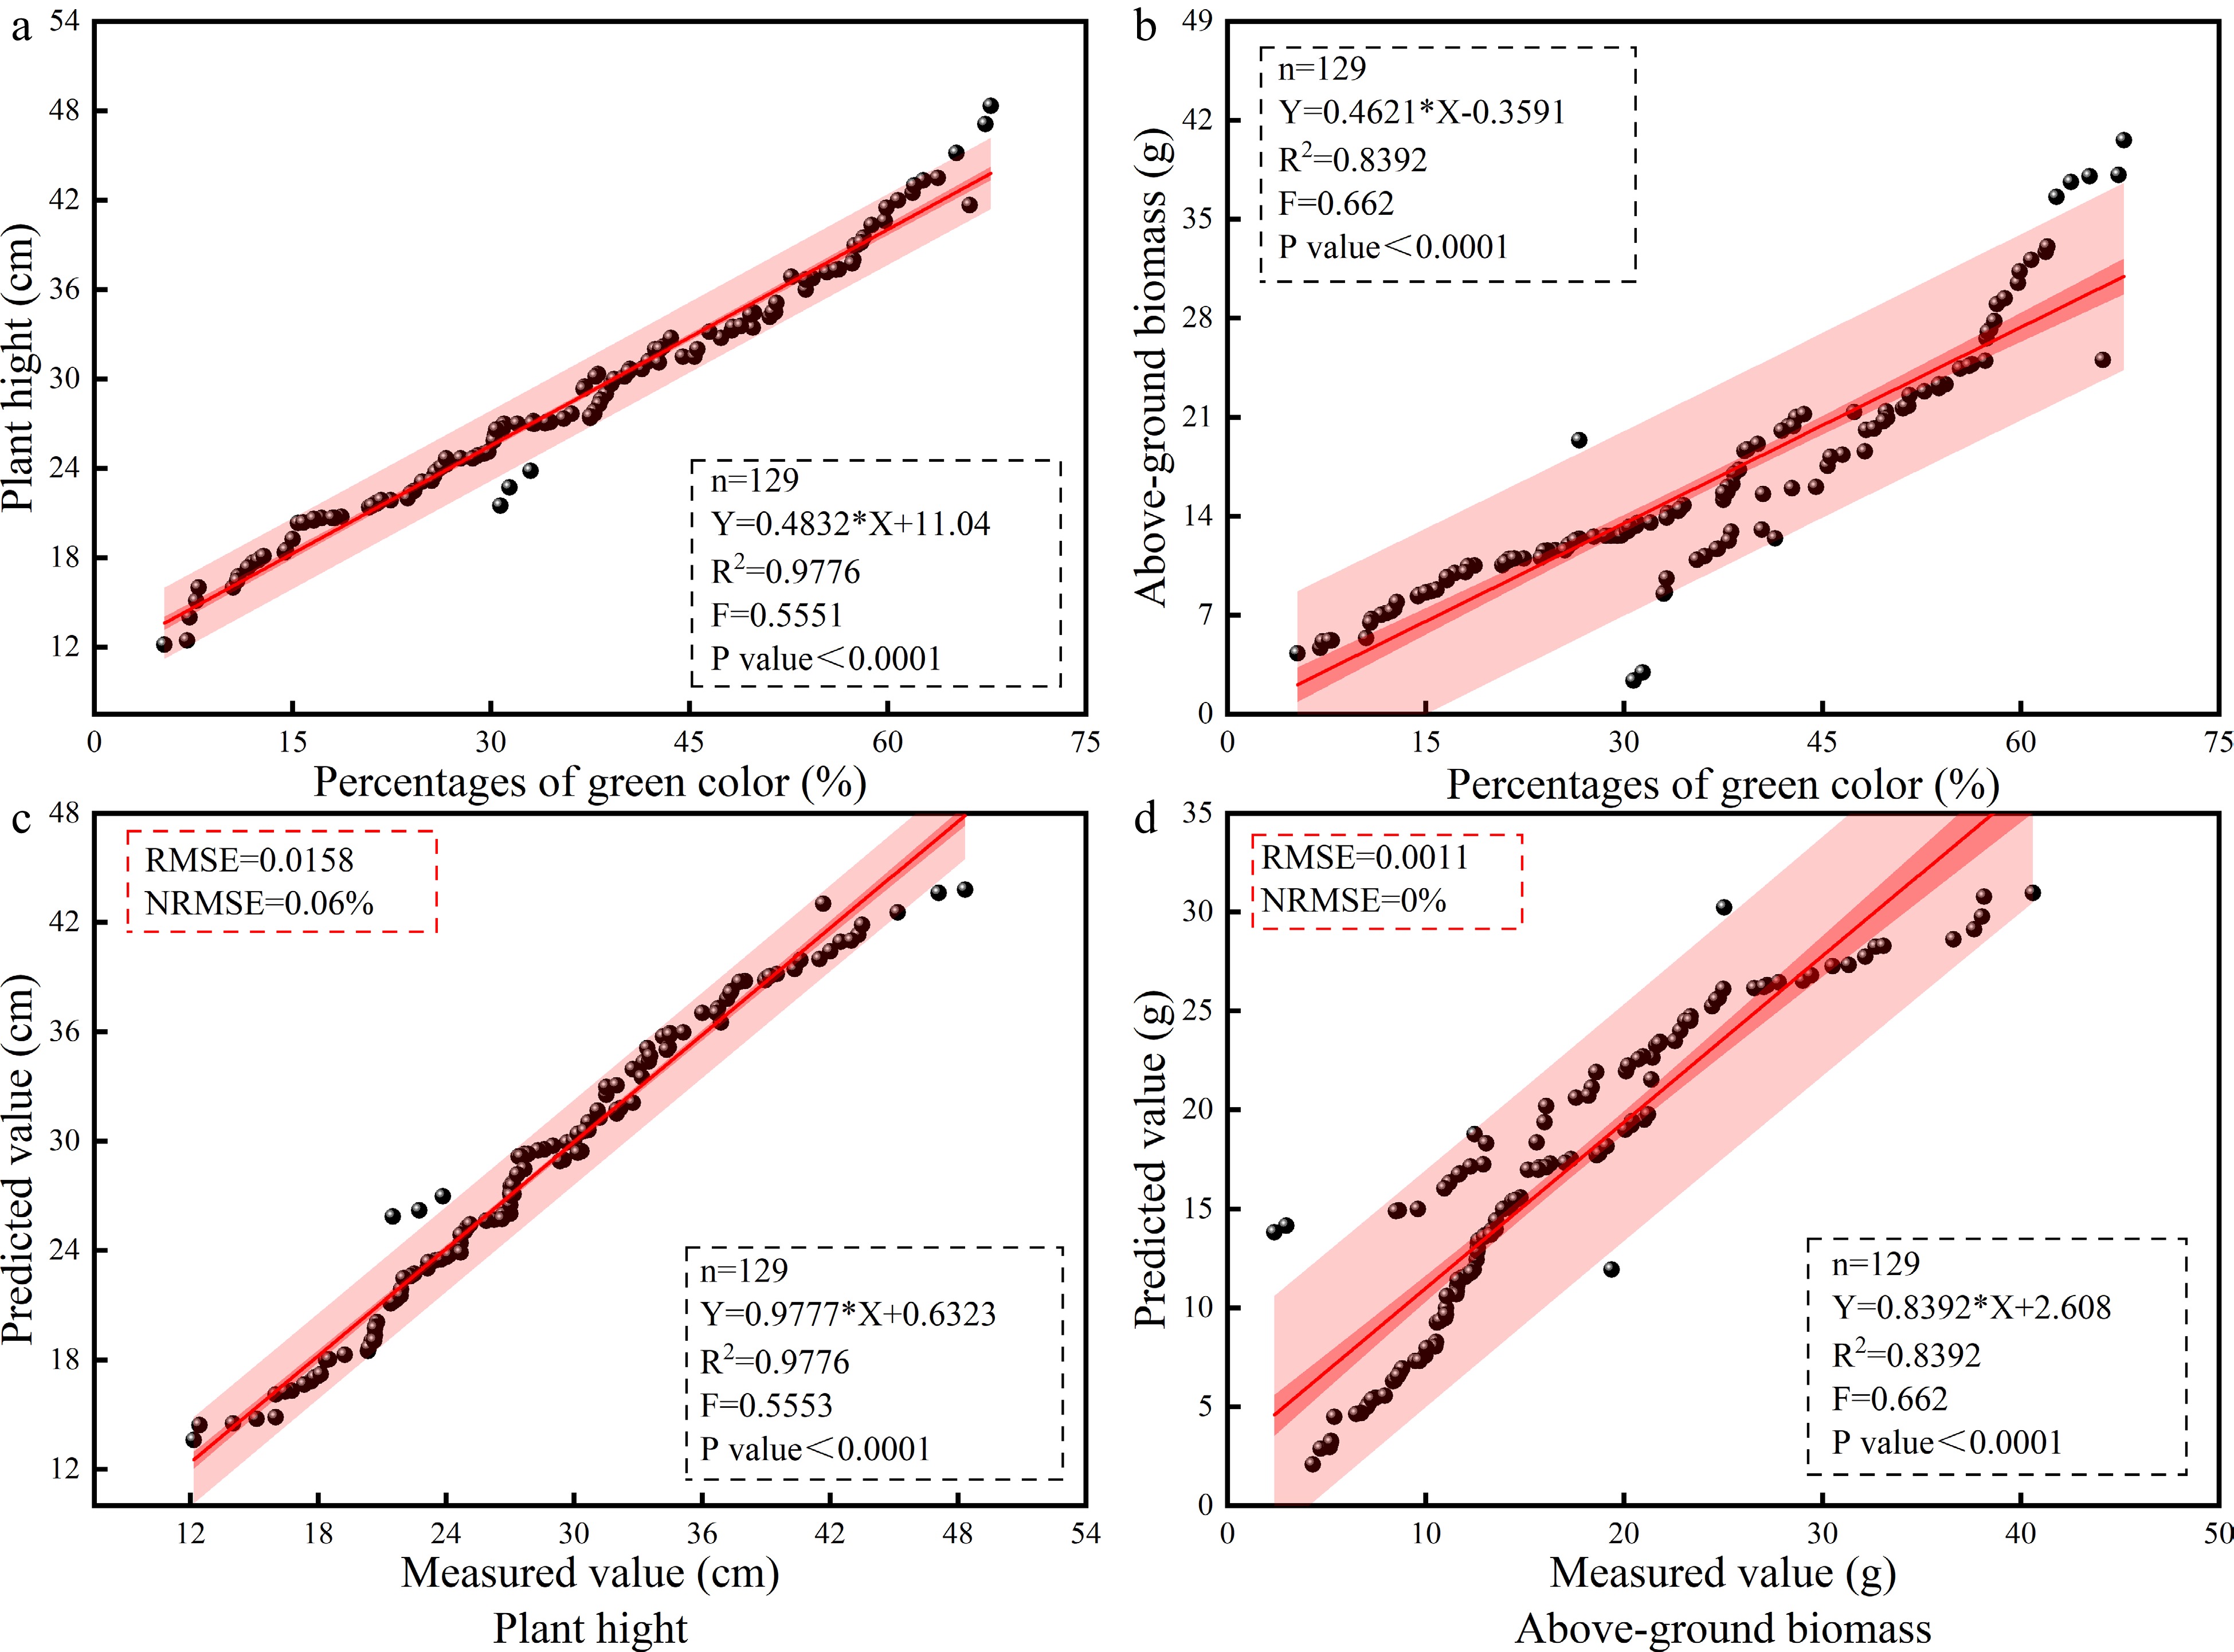
Figure 4.
Verification of the cotton PGC, PH, and AGB prediction models based on the SLR method. (a) PGC and PH model. (b) Fitting effect of the measured and predicted PH values. (c) PGC and AGB model. (d) Fitting effect of the measured and predicted AGB values. N, the number of samples; R2, coefficient of determination (according to formula [1]); RMSE, root mean square error (according to formula [2]); NRMSE, standard root mean square error (according to formula [3]). AGB, above-ground biomass; PGC, percentages of green color; PH, plant height; SLR, simple linear regression.
-
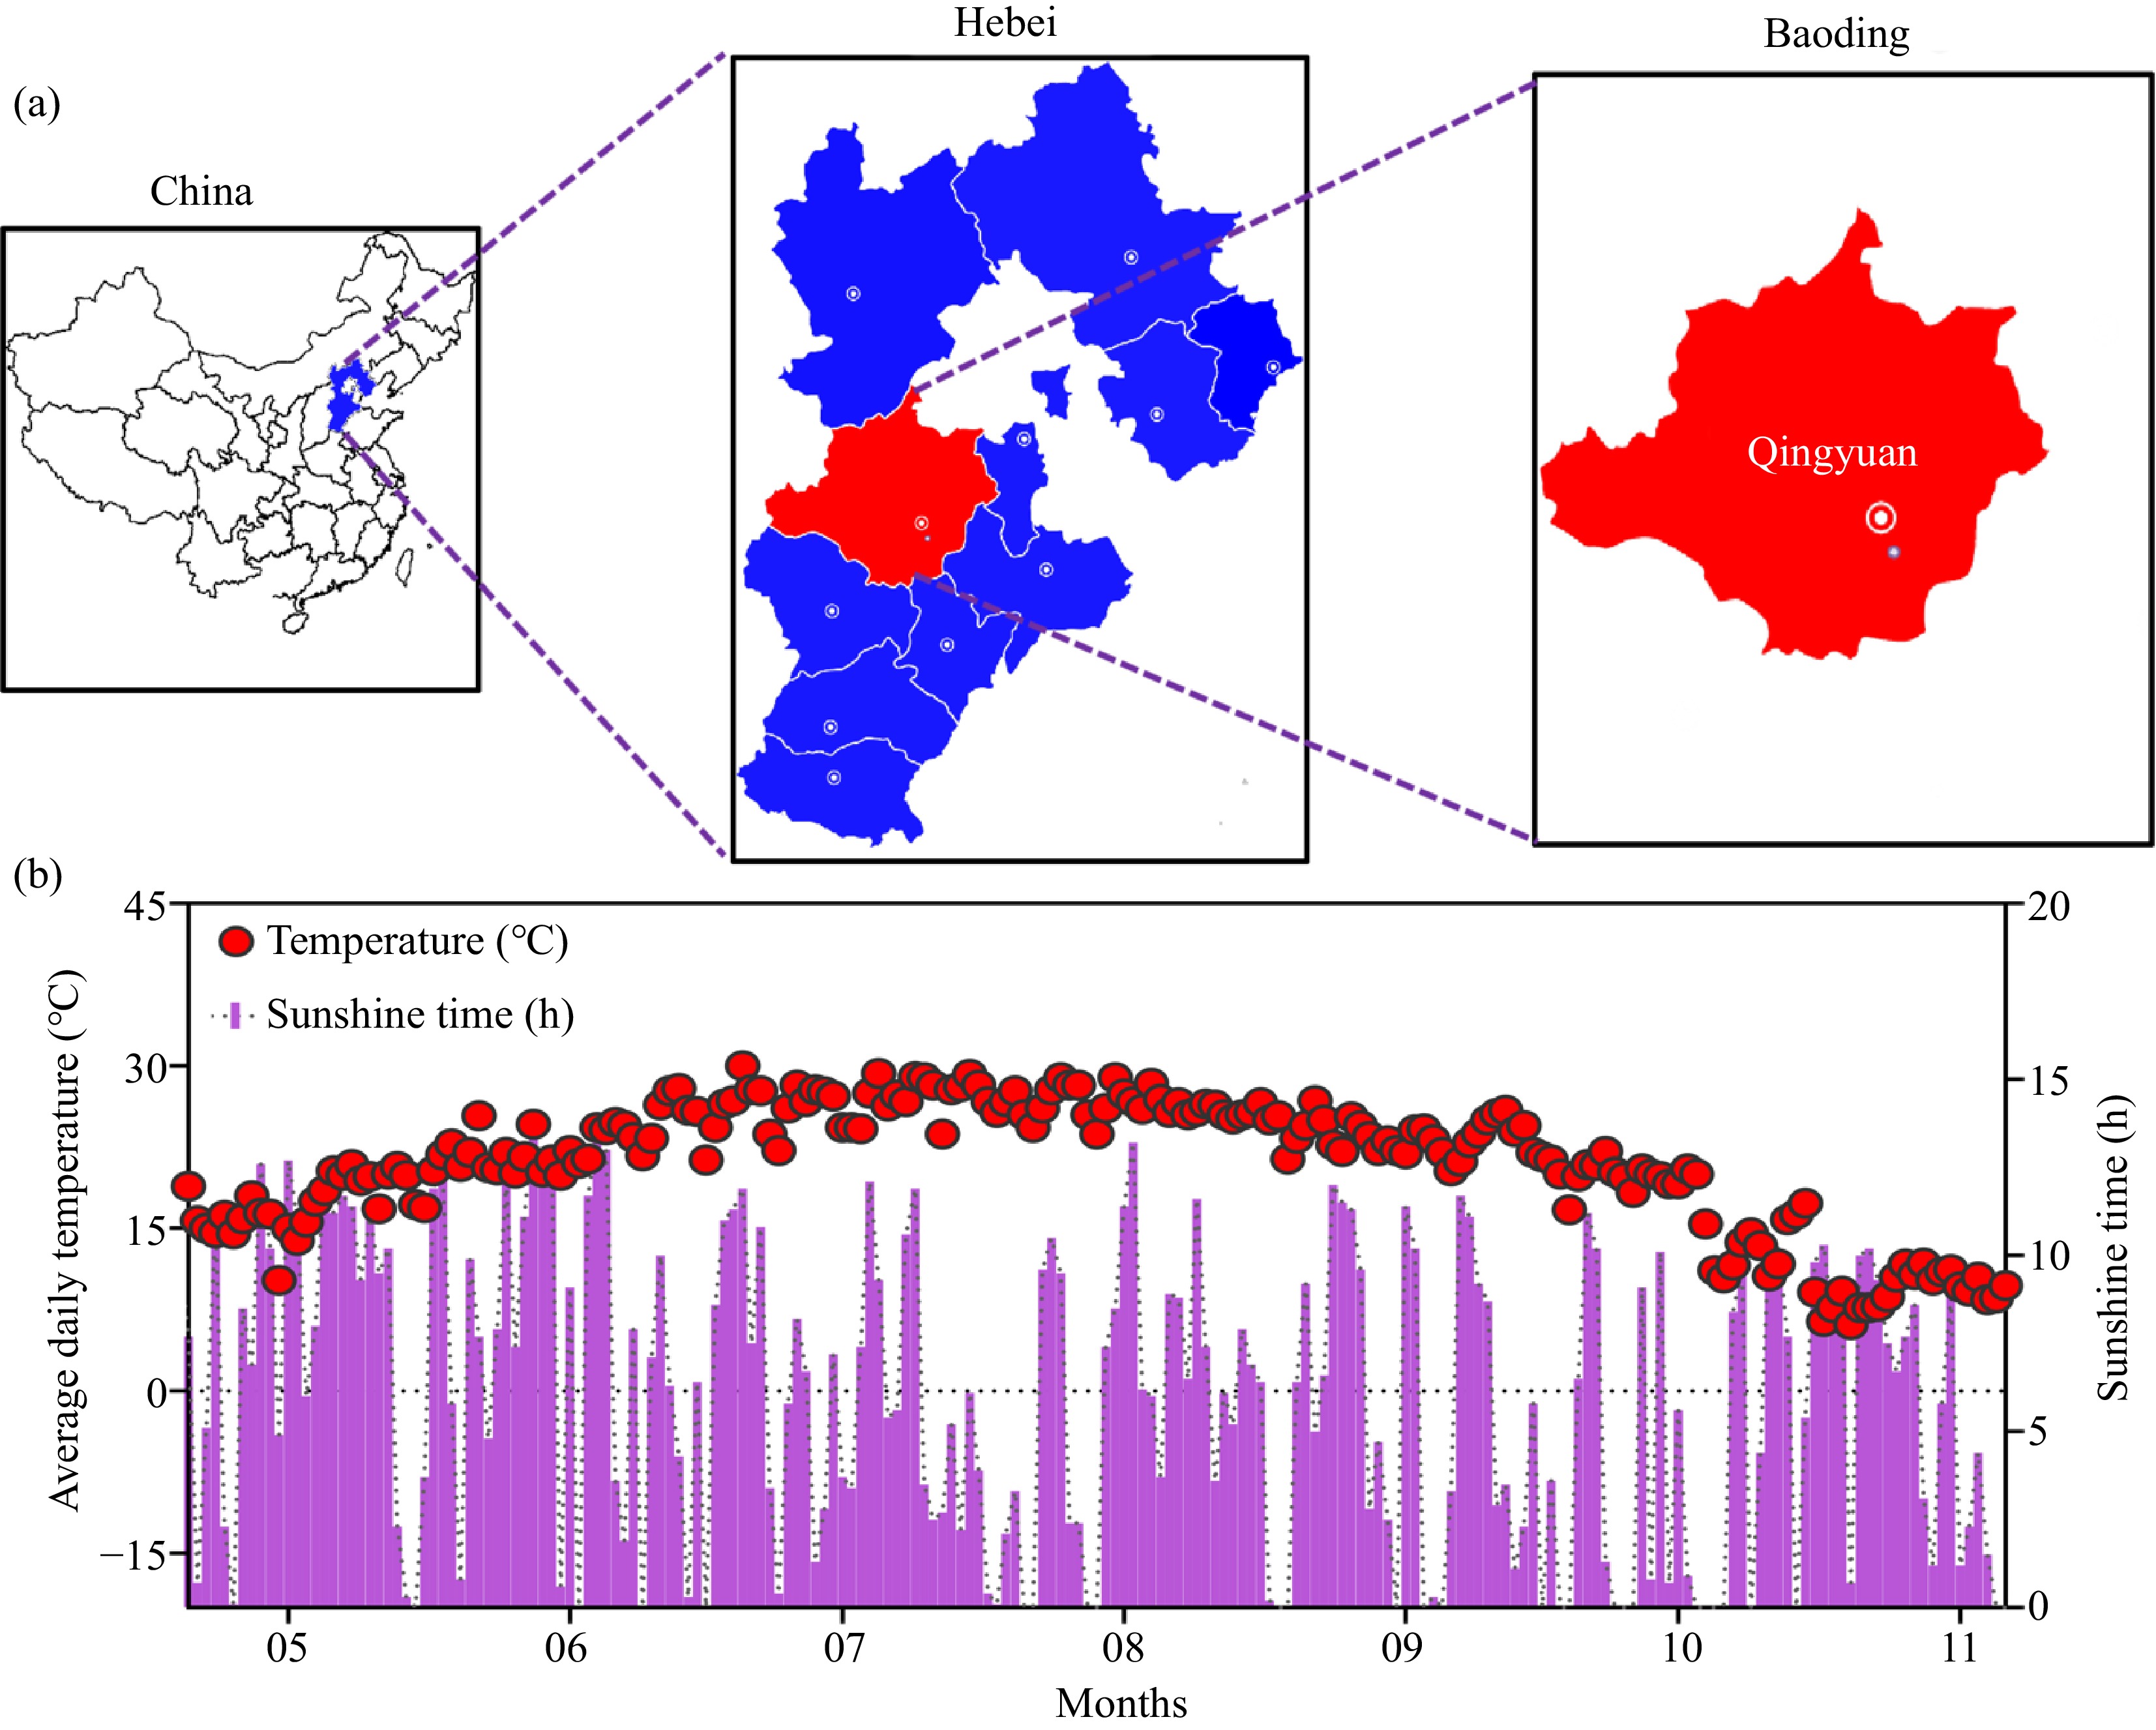
Figure 5.
Daily mean temperature (°C) and hours of sunshine time of the study site during cropping.
-
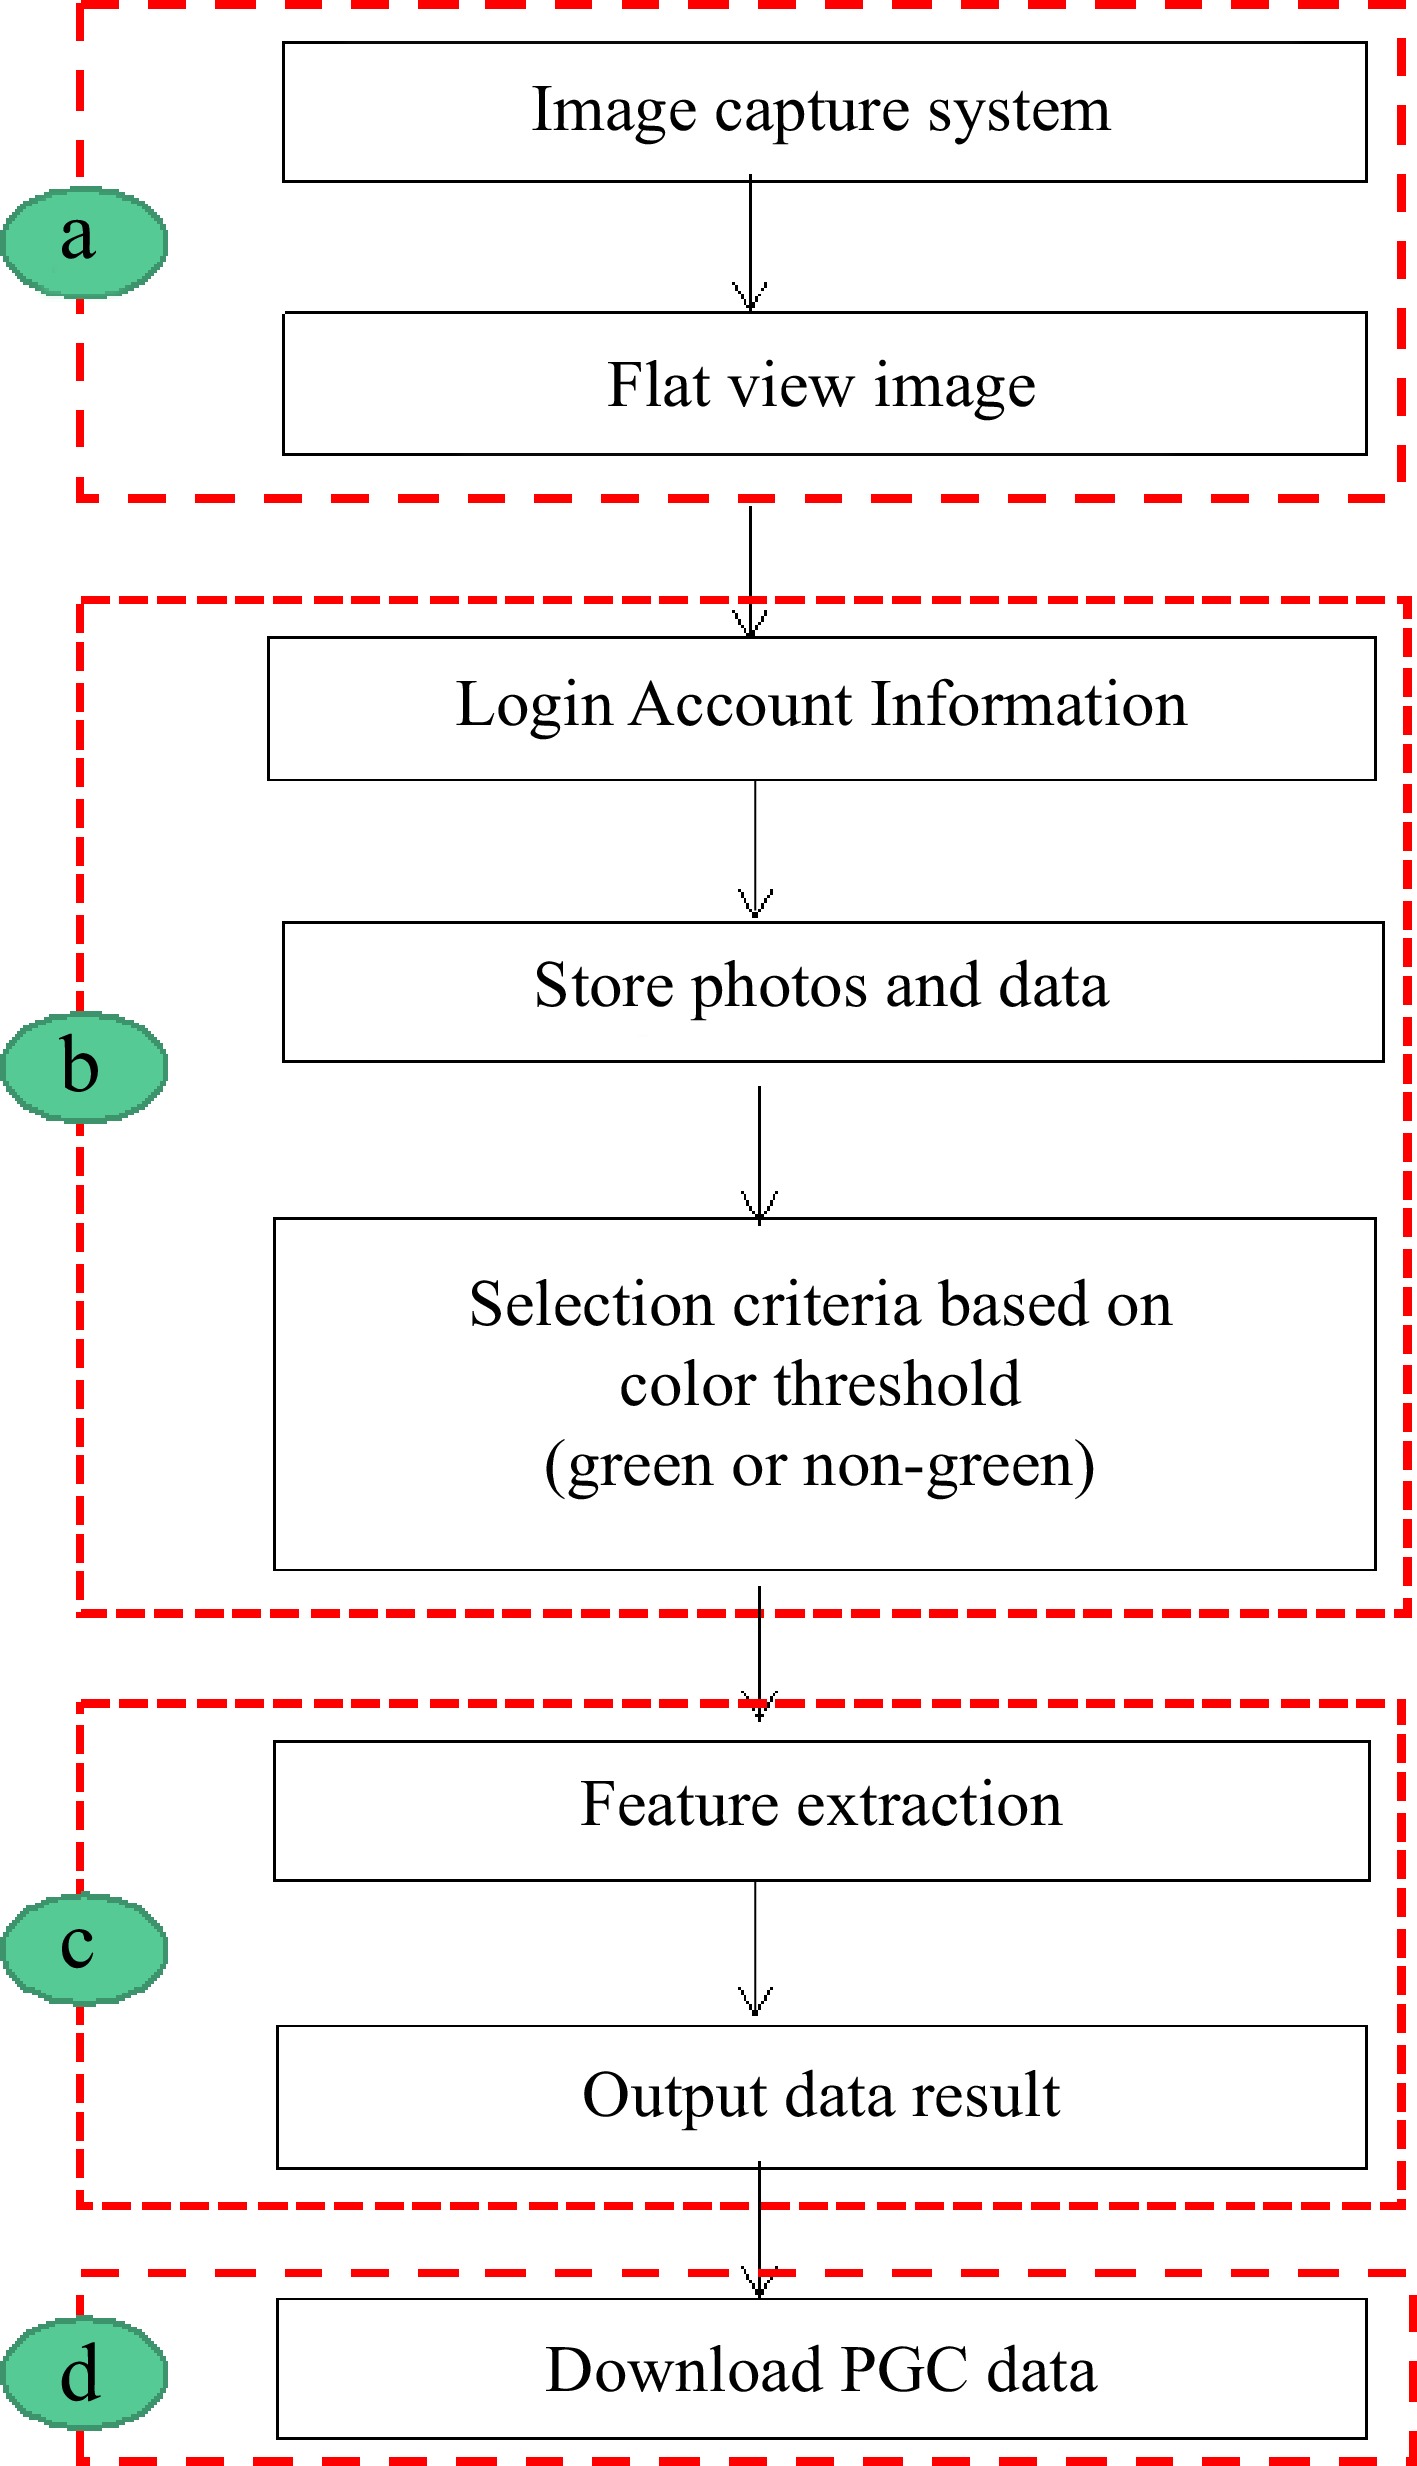
Figure 6.
Image processing steps. (a) The images were obtained with a camera at a certain height and angle. All the images were taken from the same location. (b) The APP website was logged into to obtain the uploaded image. First, the user must log into the Canopeo account, upload and segment the image, extract the contour, and obtain the green and non-green threshold regions. (c) Non-green threshold image feature extraction. (d) The PGC parameters and green or non-green images were downloaded.
-
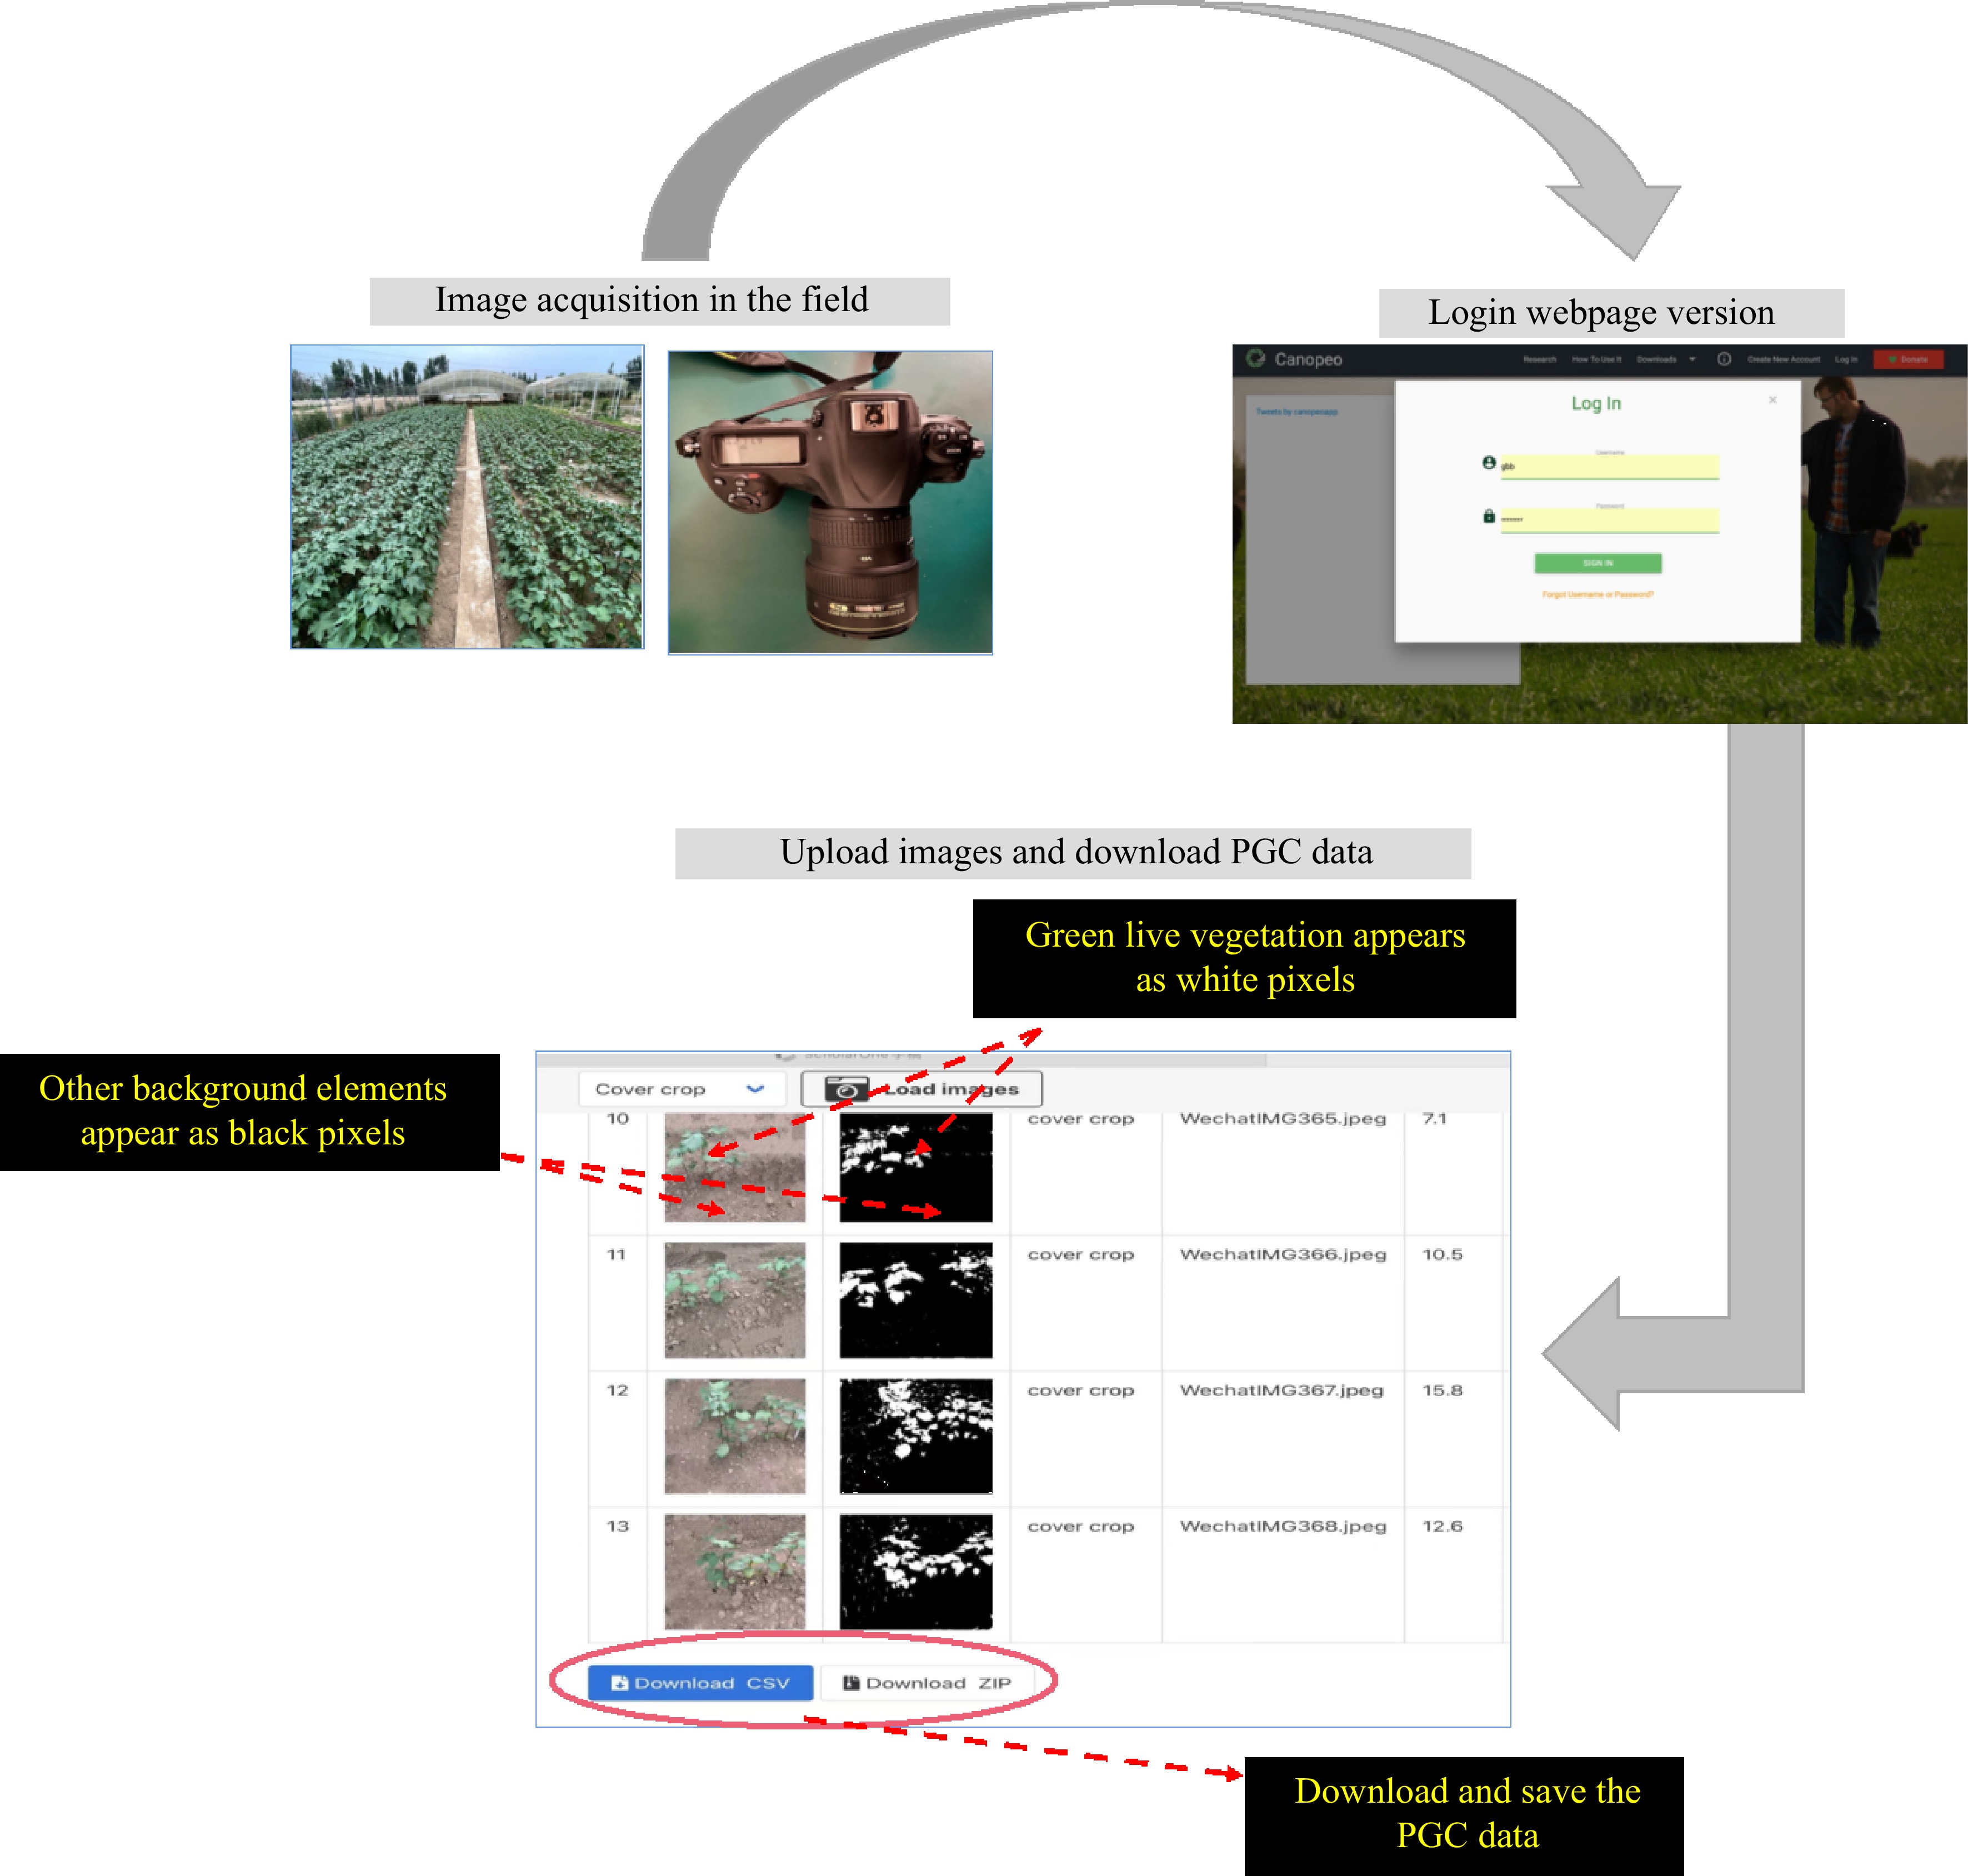
Figure 7.
Workflow hierarchy diagram. The PGC values and images were obtained after uploading to the web page for batch processing. PGC, percentages of green color.
-
PGC PH AGB DS PGC 1 PH 0.99** 1 AGB 0.96** 0.96** 1 CK PGC 1 PH 0.98** 1 AGB 0.98** 0.99** 1 AGB, above-ground biomass; PGC, percentage of green color; PH, plant height. ** P < 0.01 Table 1.
Correlation matrix of the PGC, PH, and AGB
Figures
(7)
Tables
(1)