-
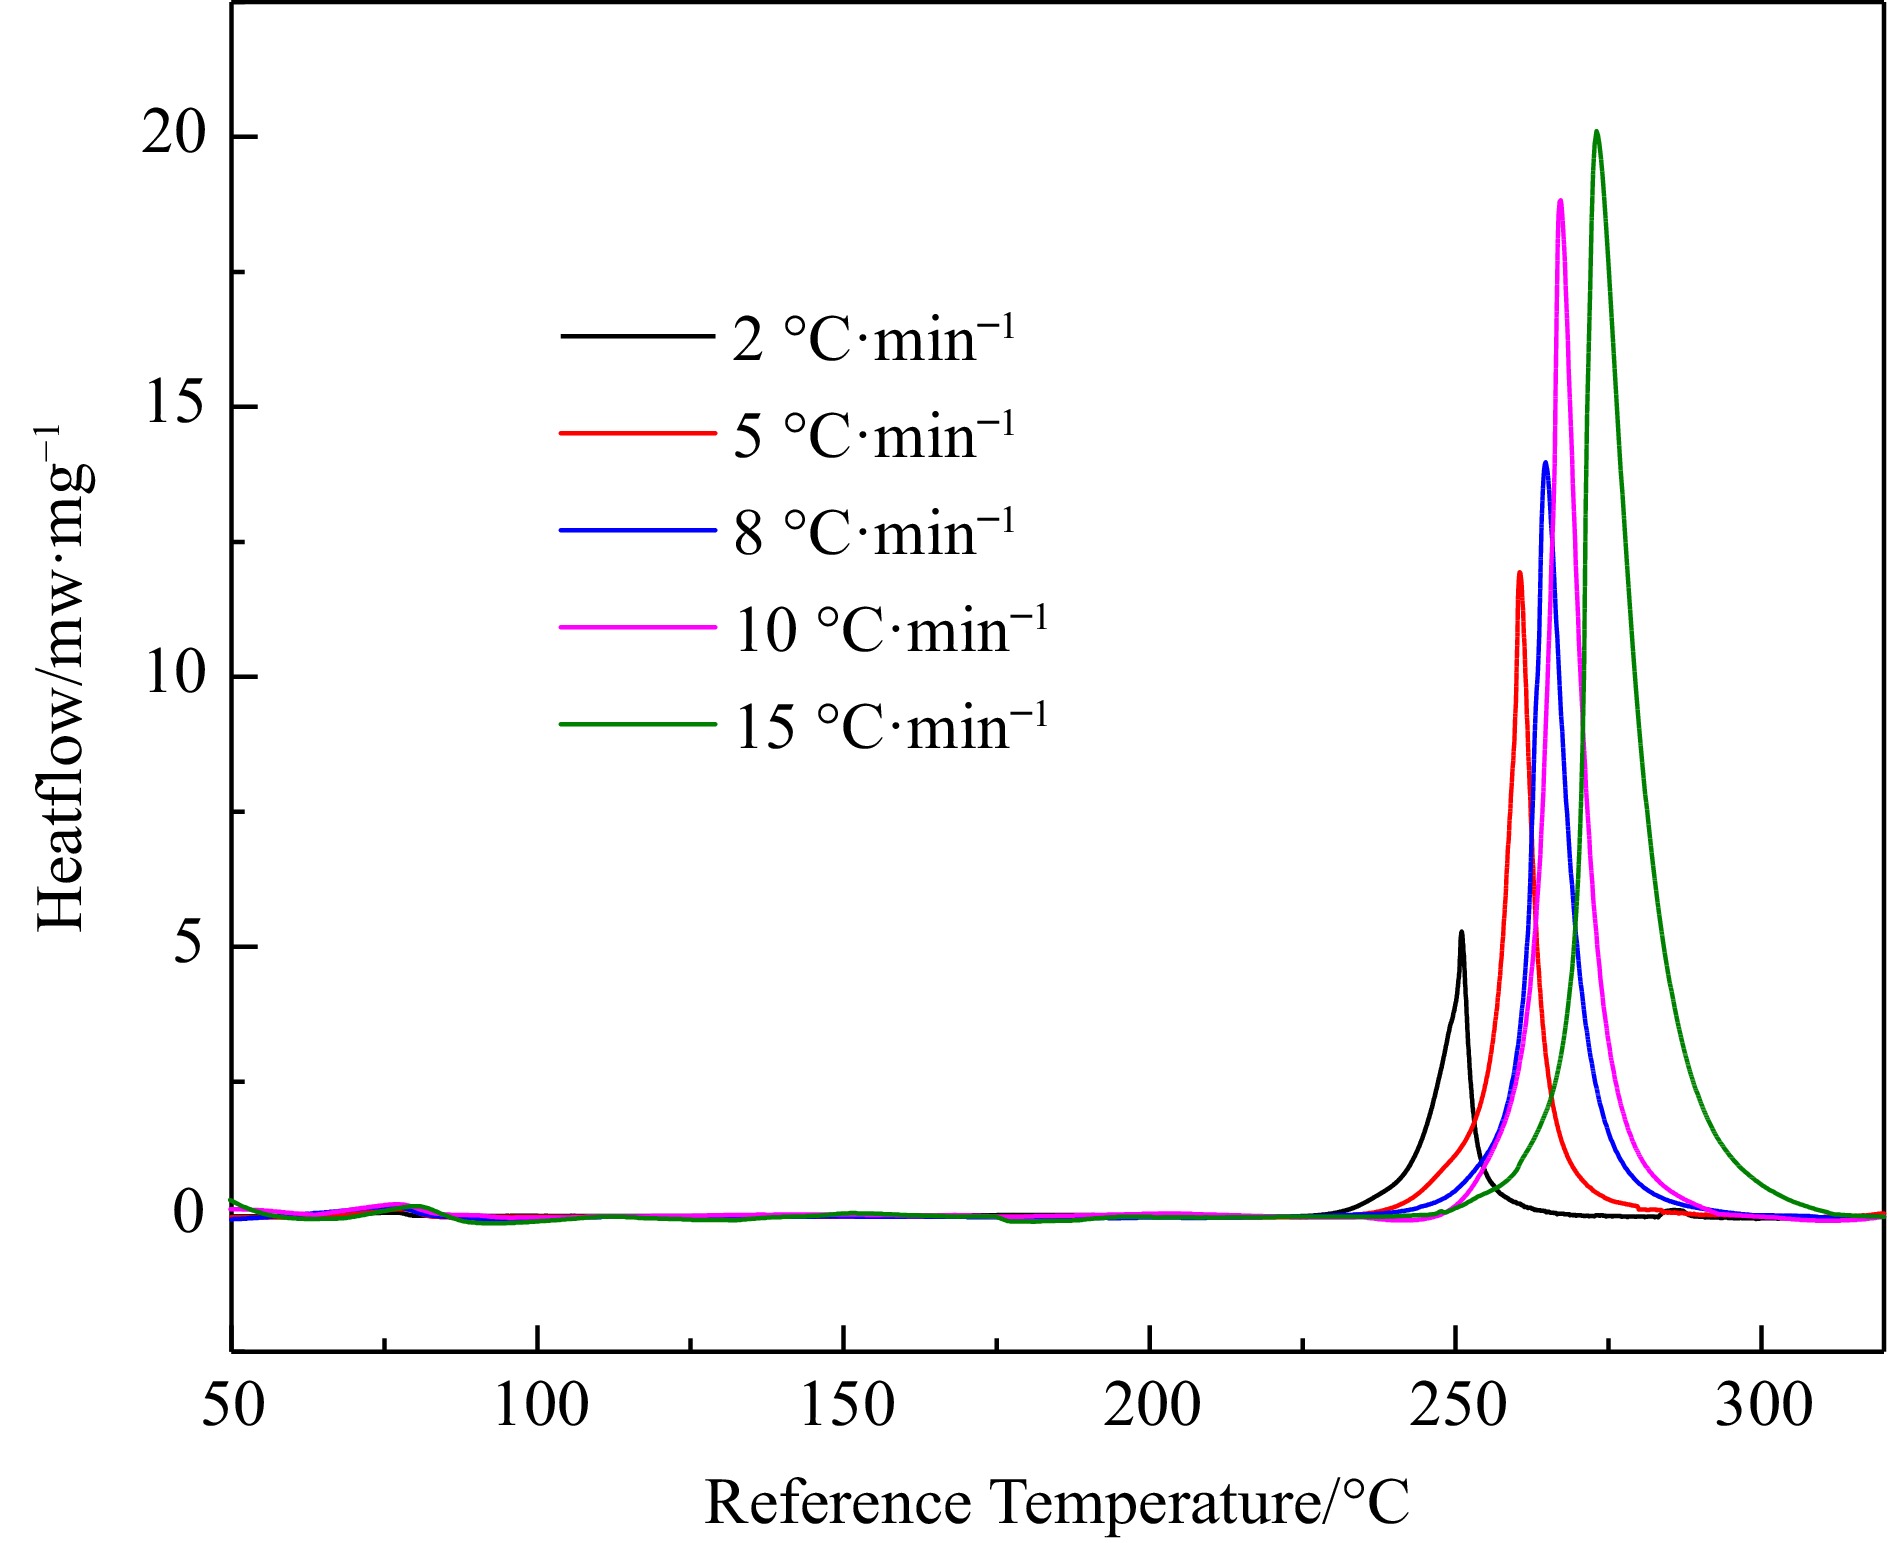
Figure 1.
DSC heat flow curves for H4-PTZ at 2.0, 5.0, 8.0, 10.0, and 15.0 °C·min−1.
-
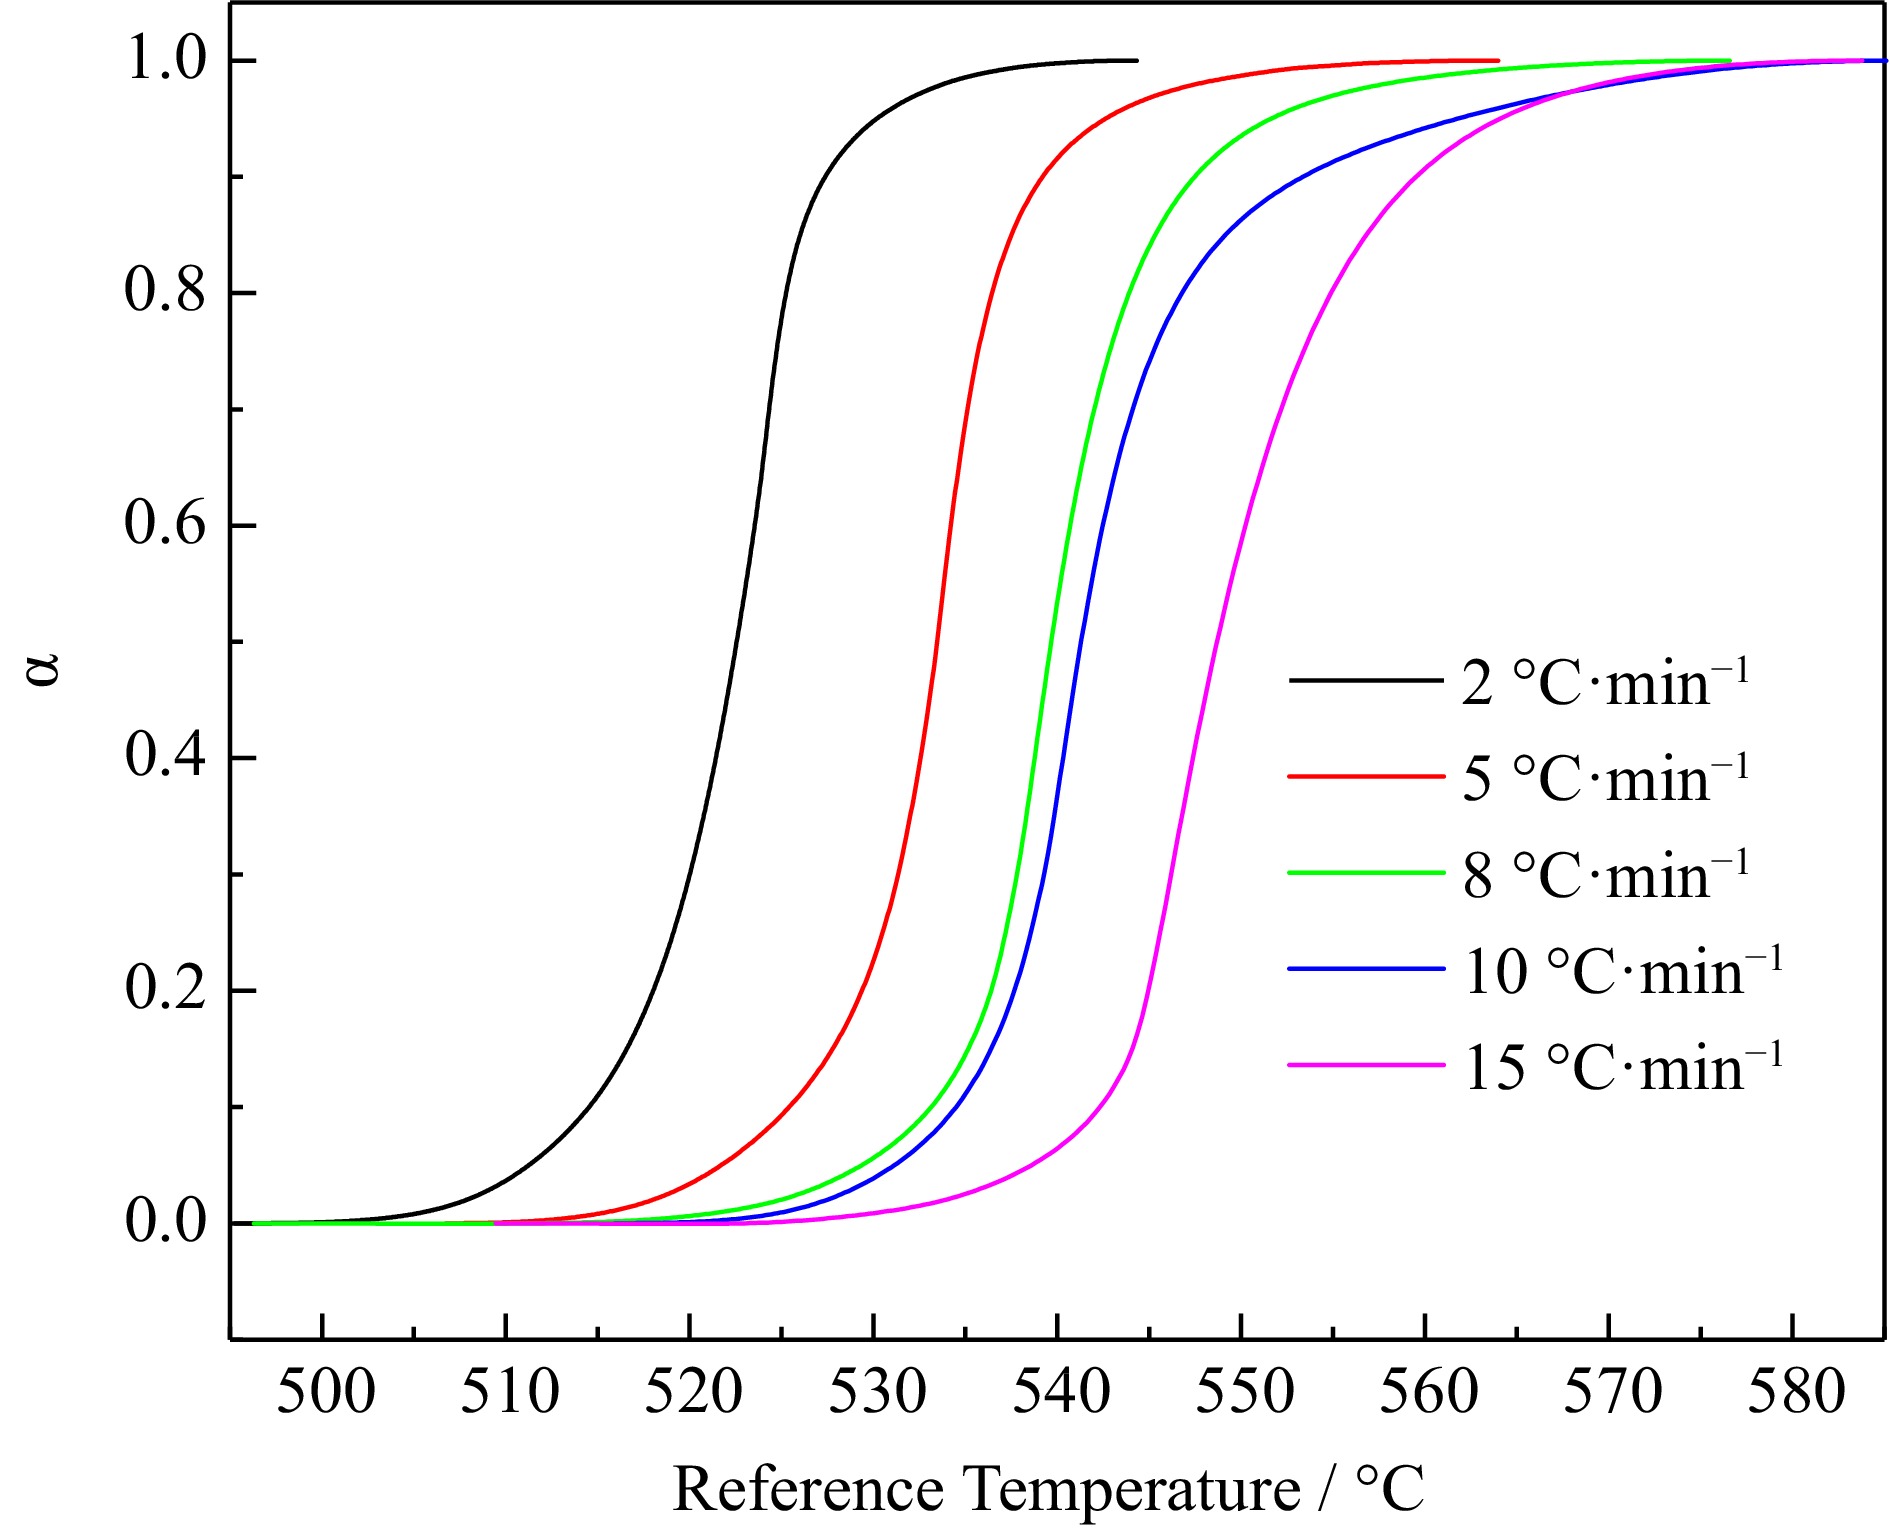
Figure 2.
Conversion rate data for H4-PTZ at 2.0, 5.0, 8.0, 10.0, and 15.0 °C·min−1.
-

Figure 3.
Regression of H4-PTZ using Starink method.
-
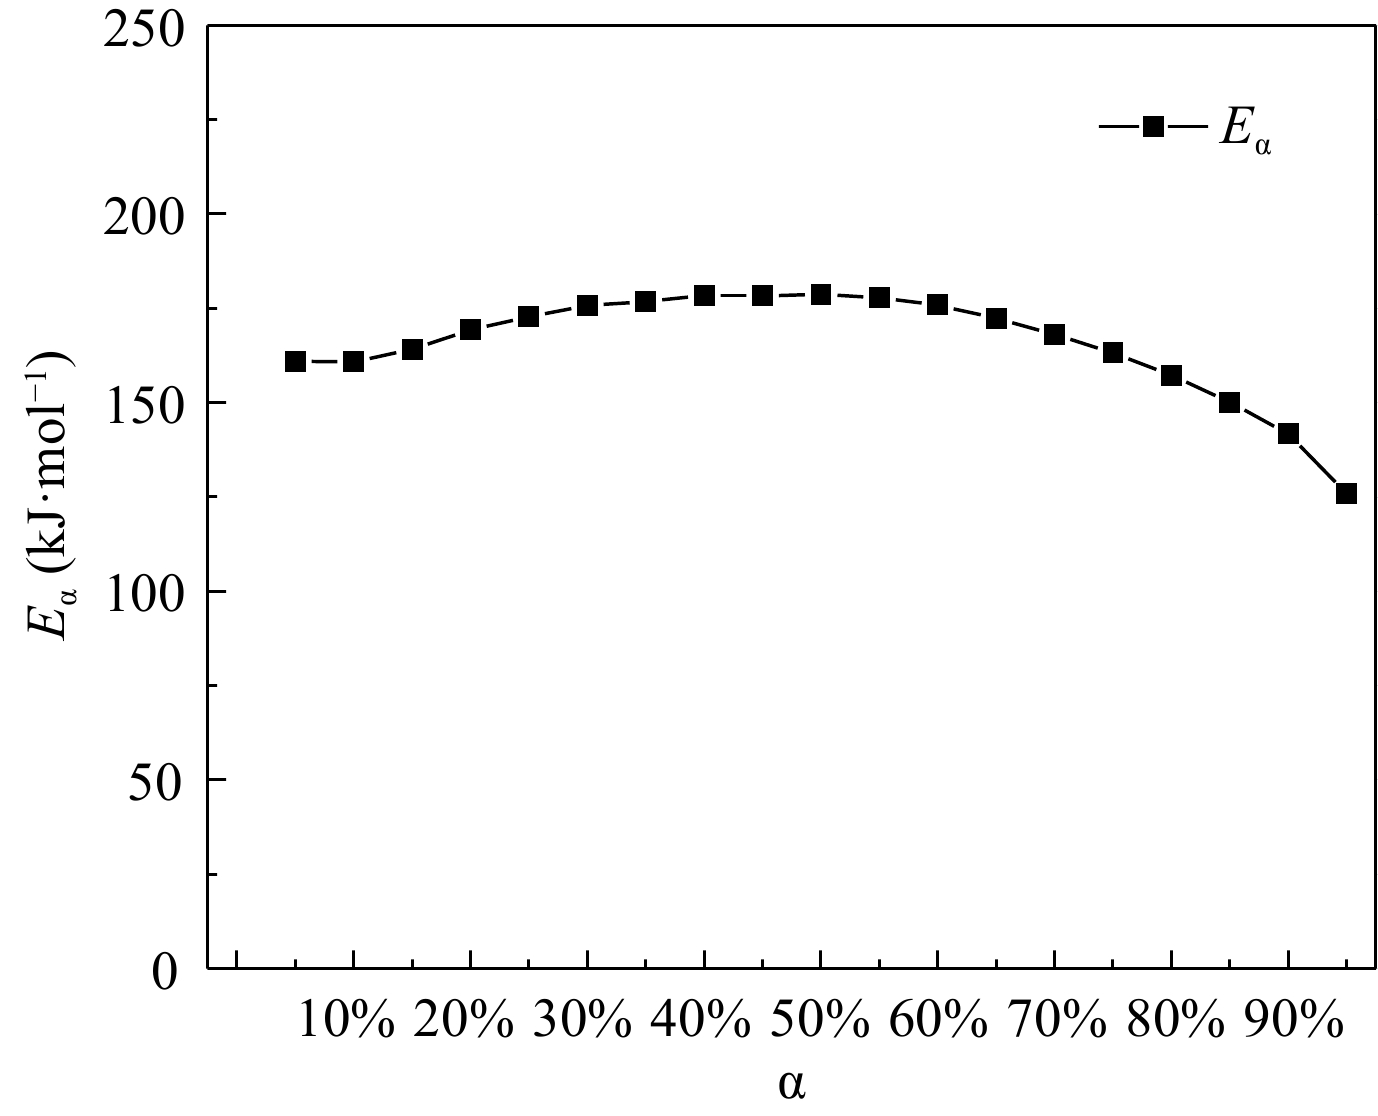
Figure 4.
Dependence between activation energy and conversion rate.
-
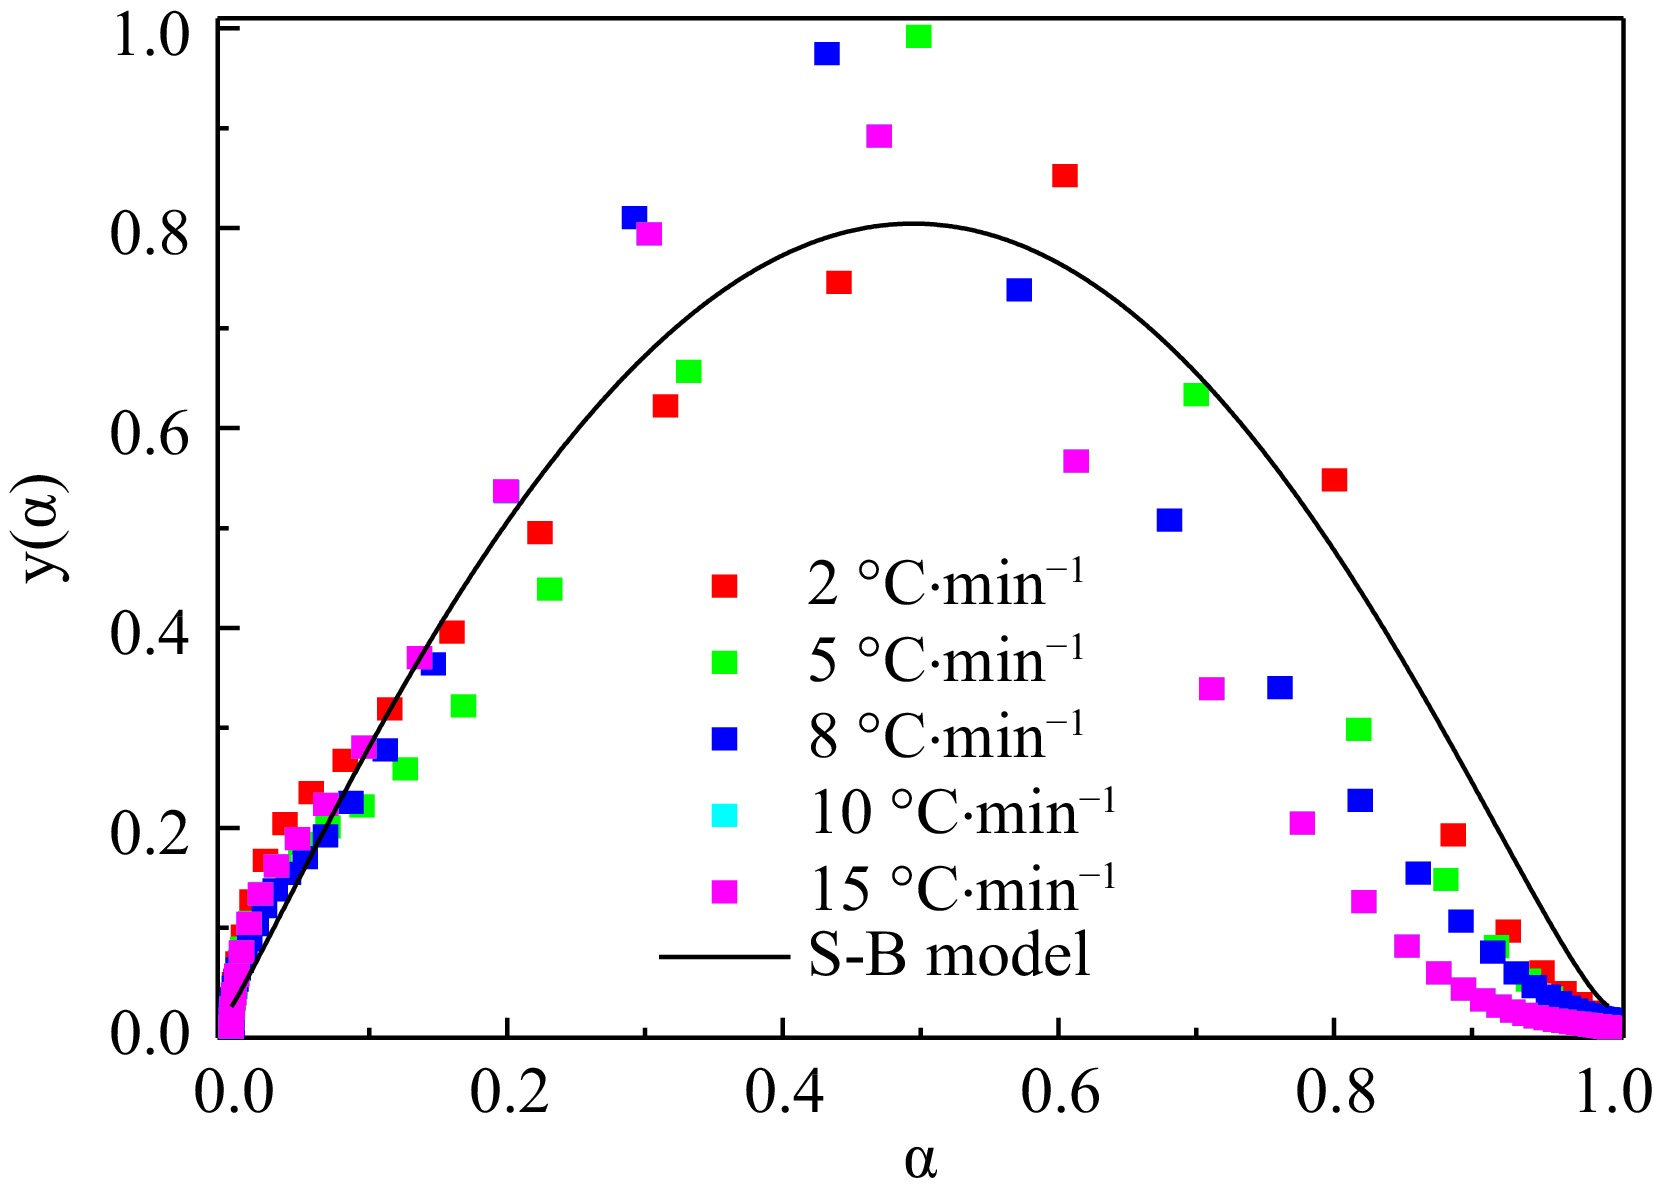
Figure 5.
Scatter diagrams of the experimental y'(α) and corresponding fitting curves.
-
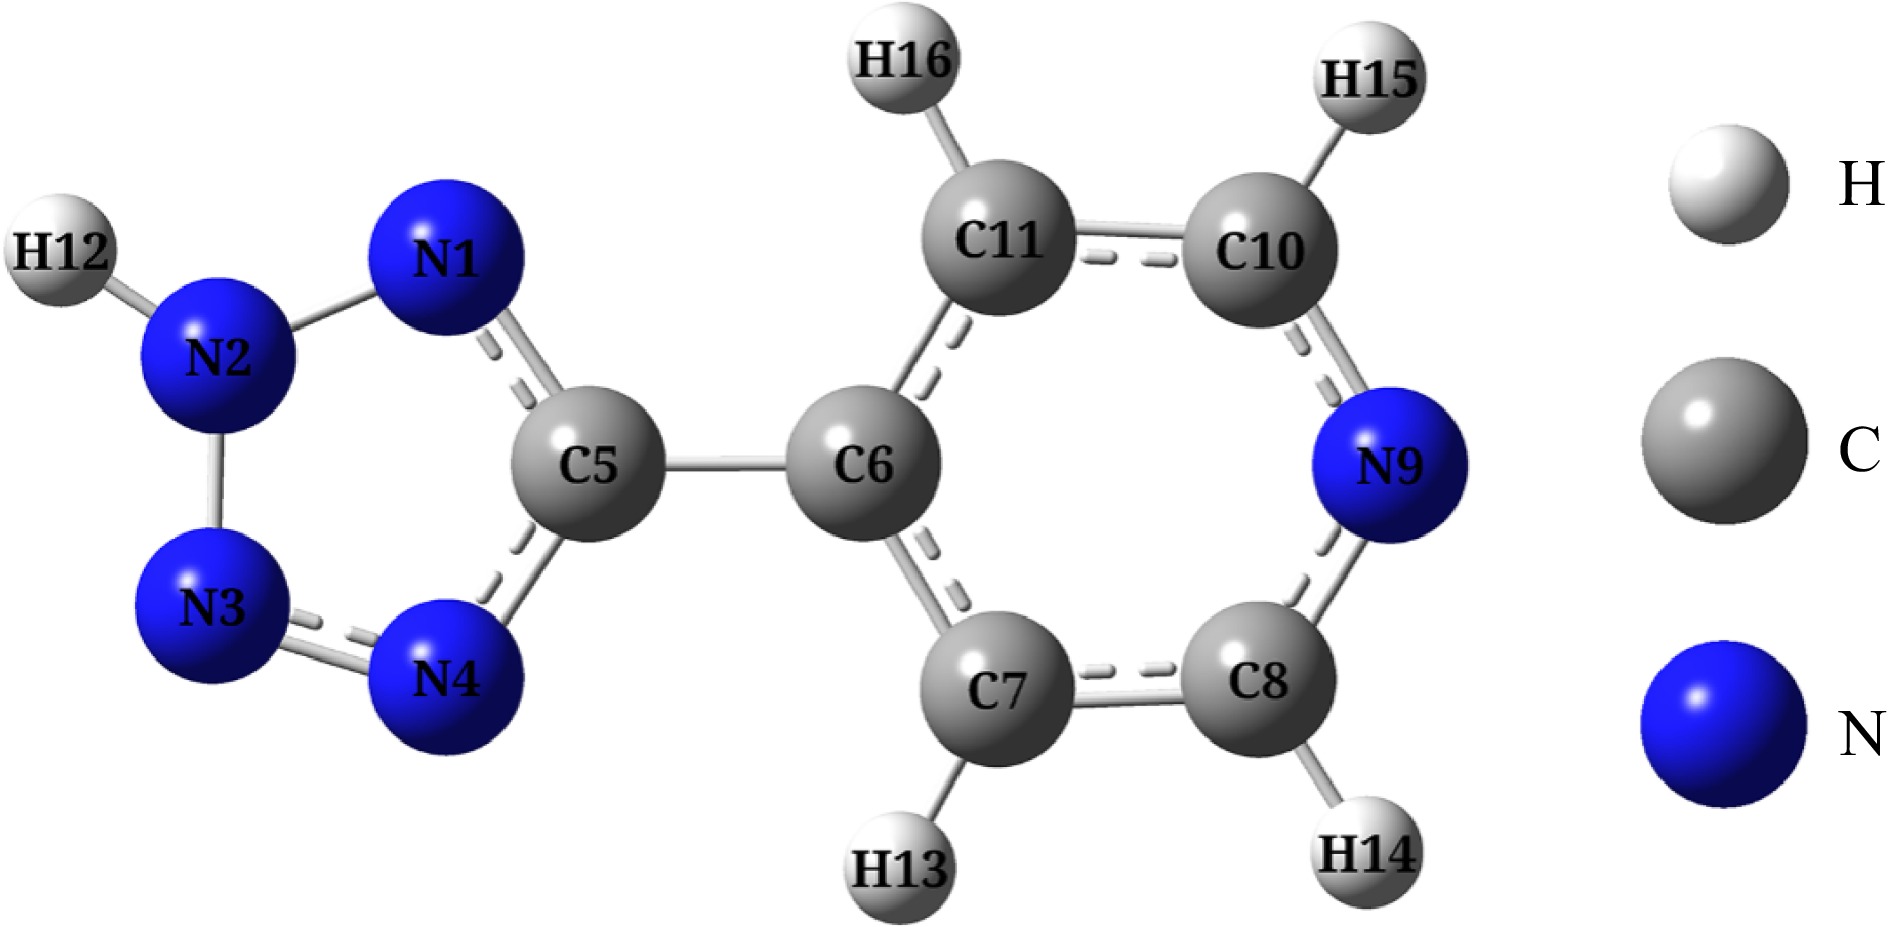
Figure 6.
Optimized configuration of H4-PTZ (Note: The atomic number in the molecule has been labeled, and there are the same number of atoms).
-
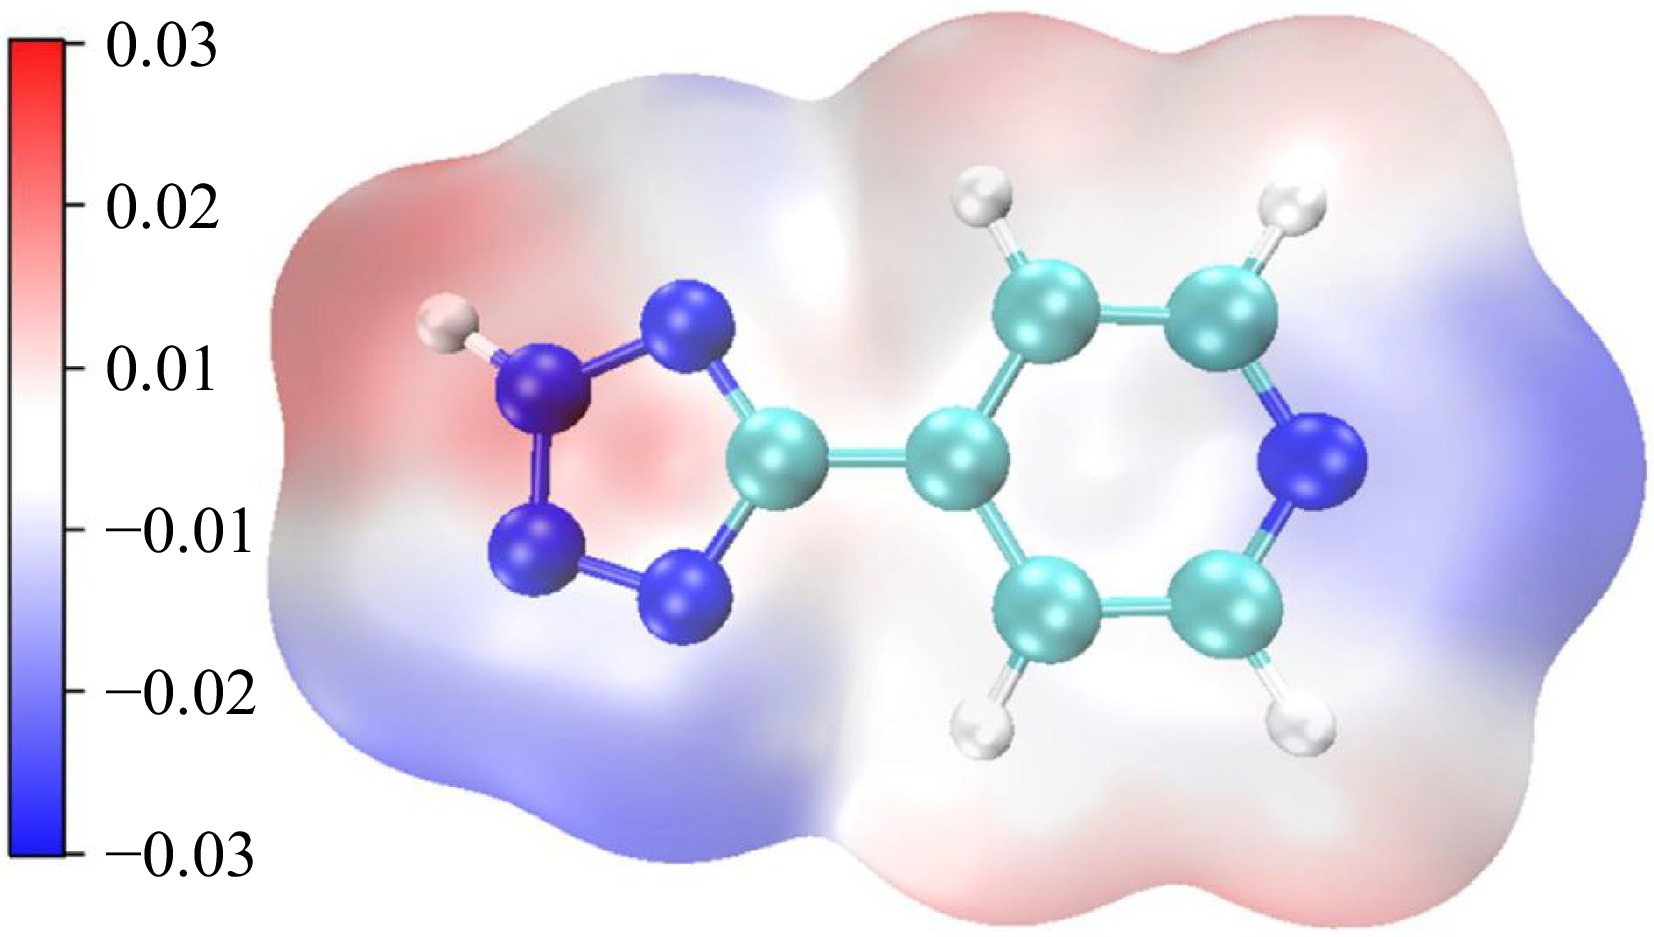
Figure 7.
Potential electrostatic distribution of H4-PTZ (Note: Blue represents a positive electrostatic potential and red represents a negative electrostatic potential).
-
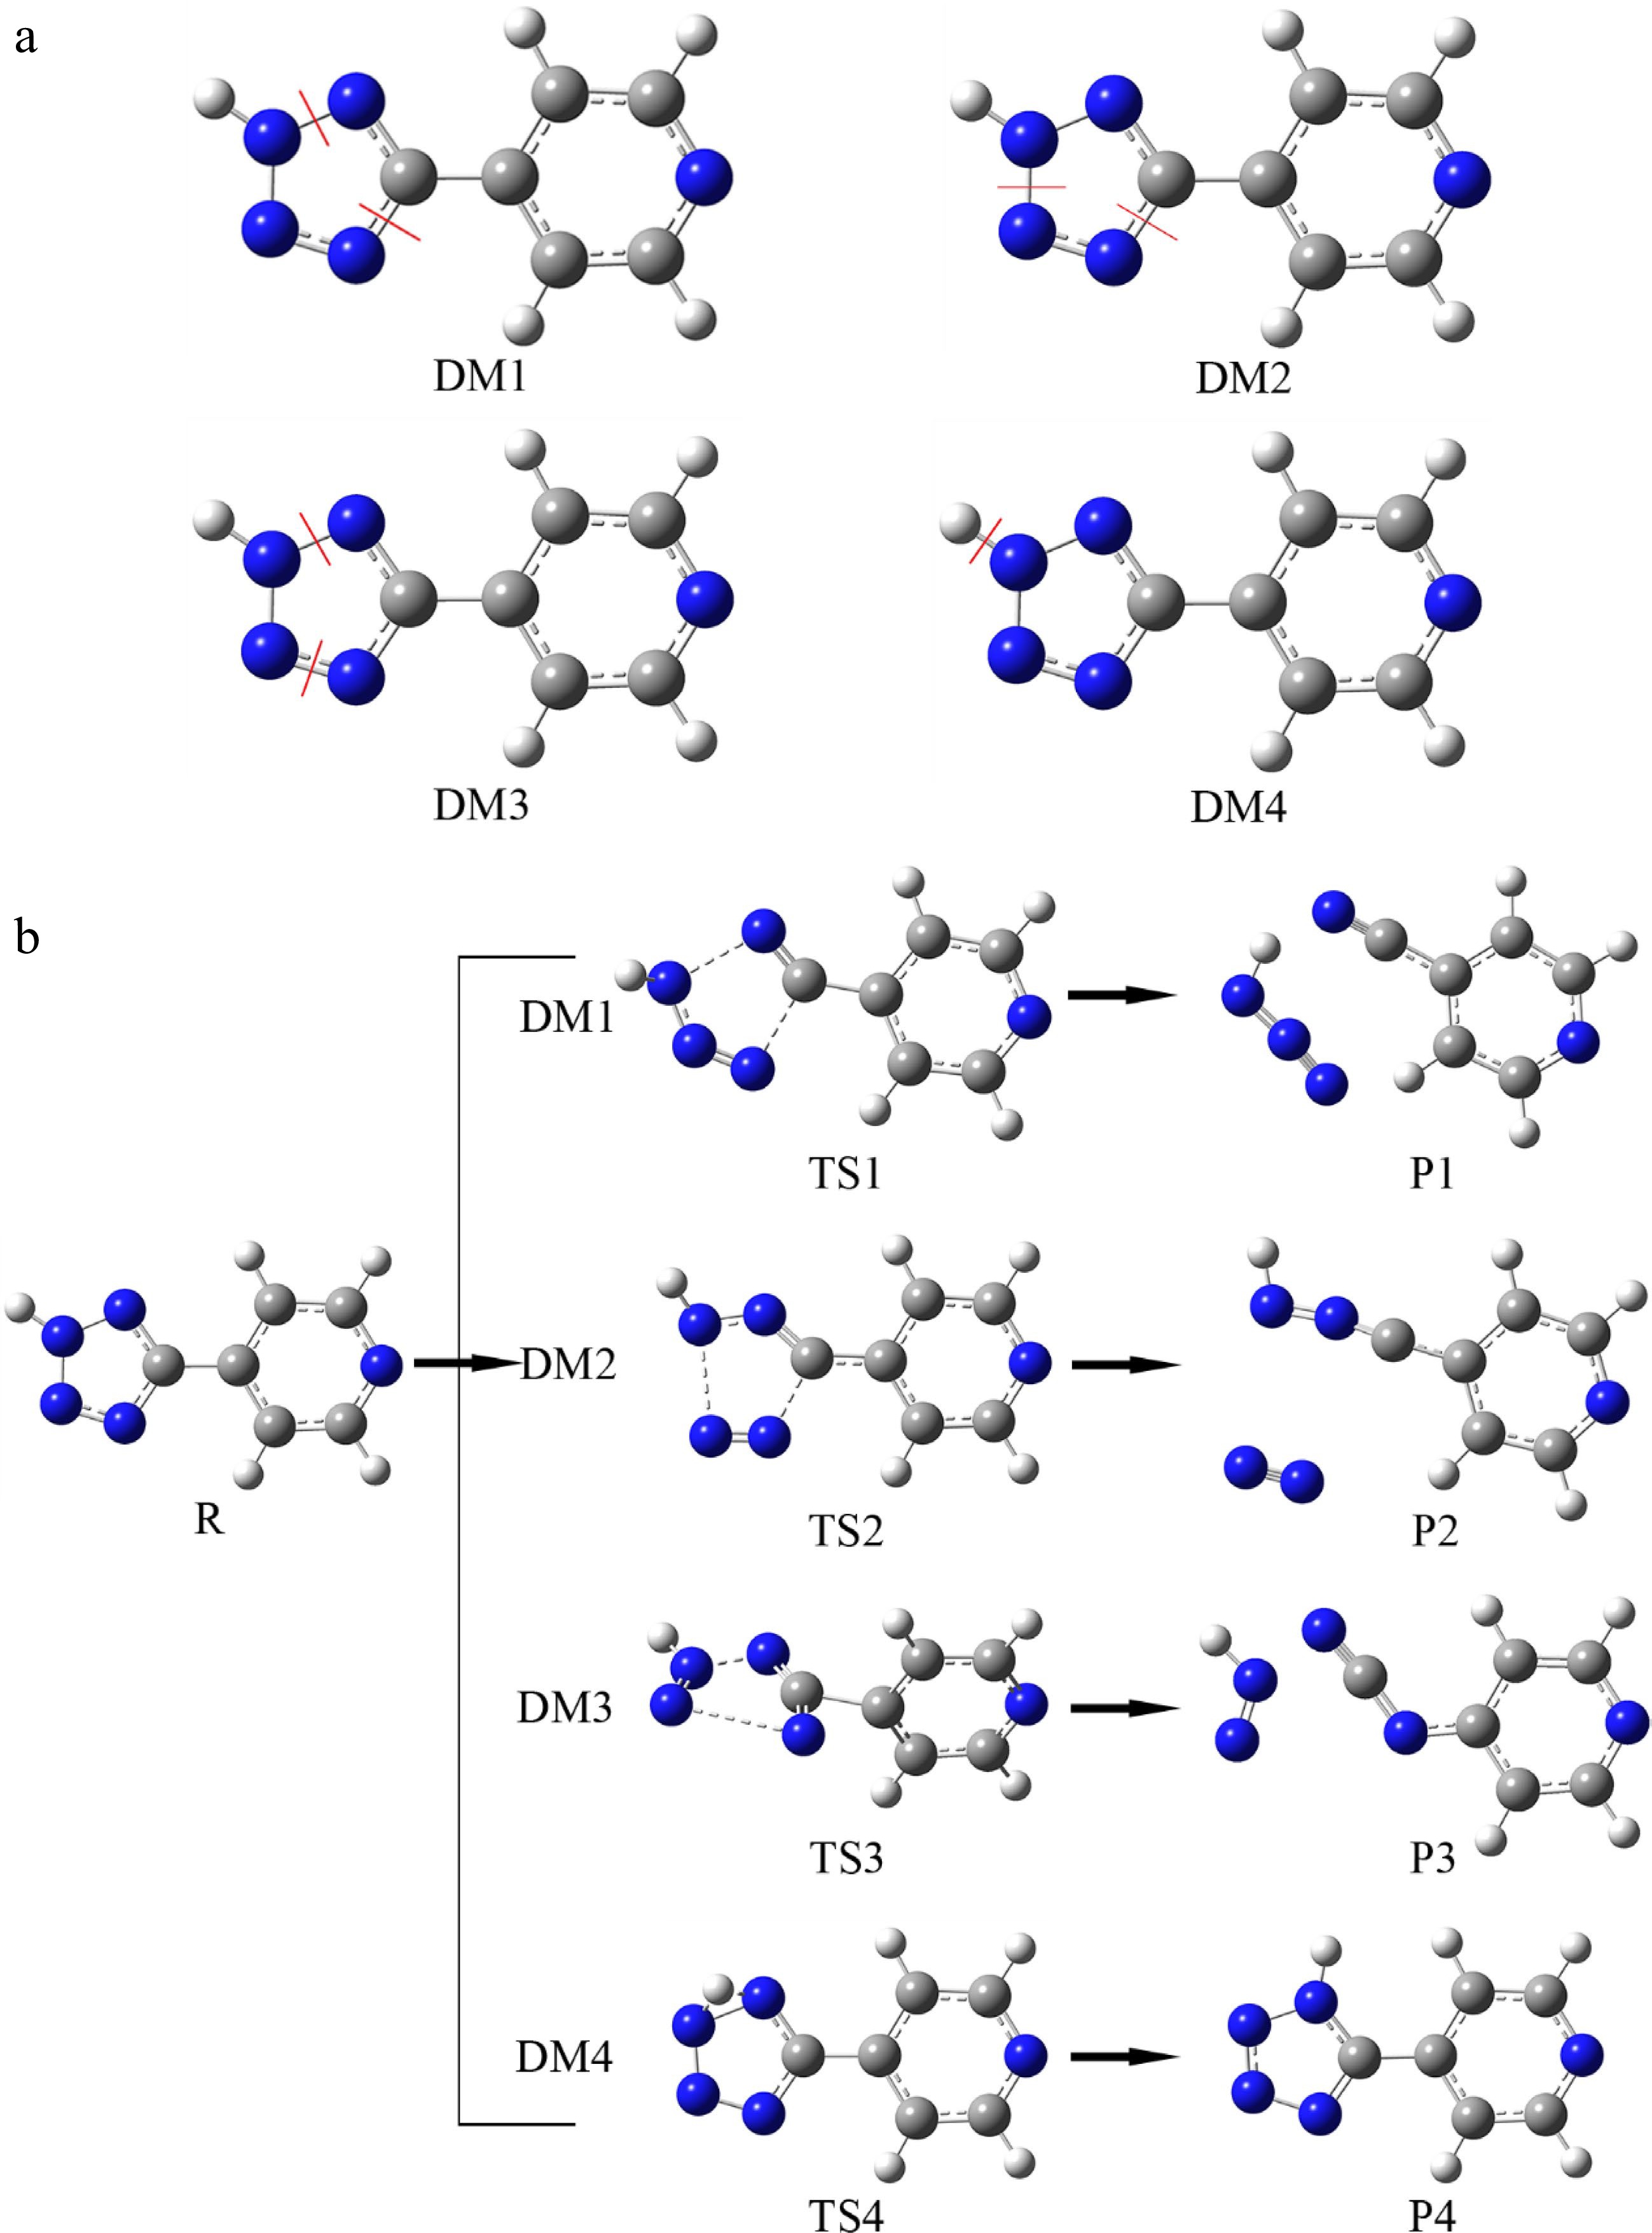
Figure 8.
The reasonable initiation reactions and corresponding decomposition pathways of H4-PTZ. (a) Representing four superficially reasonable initiation reactions; (b) corresponding ecomposition pathways.
-
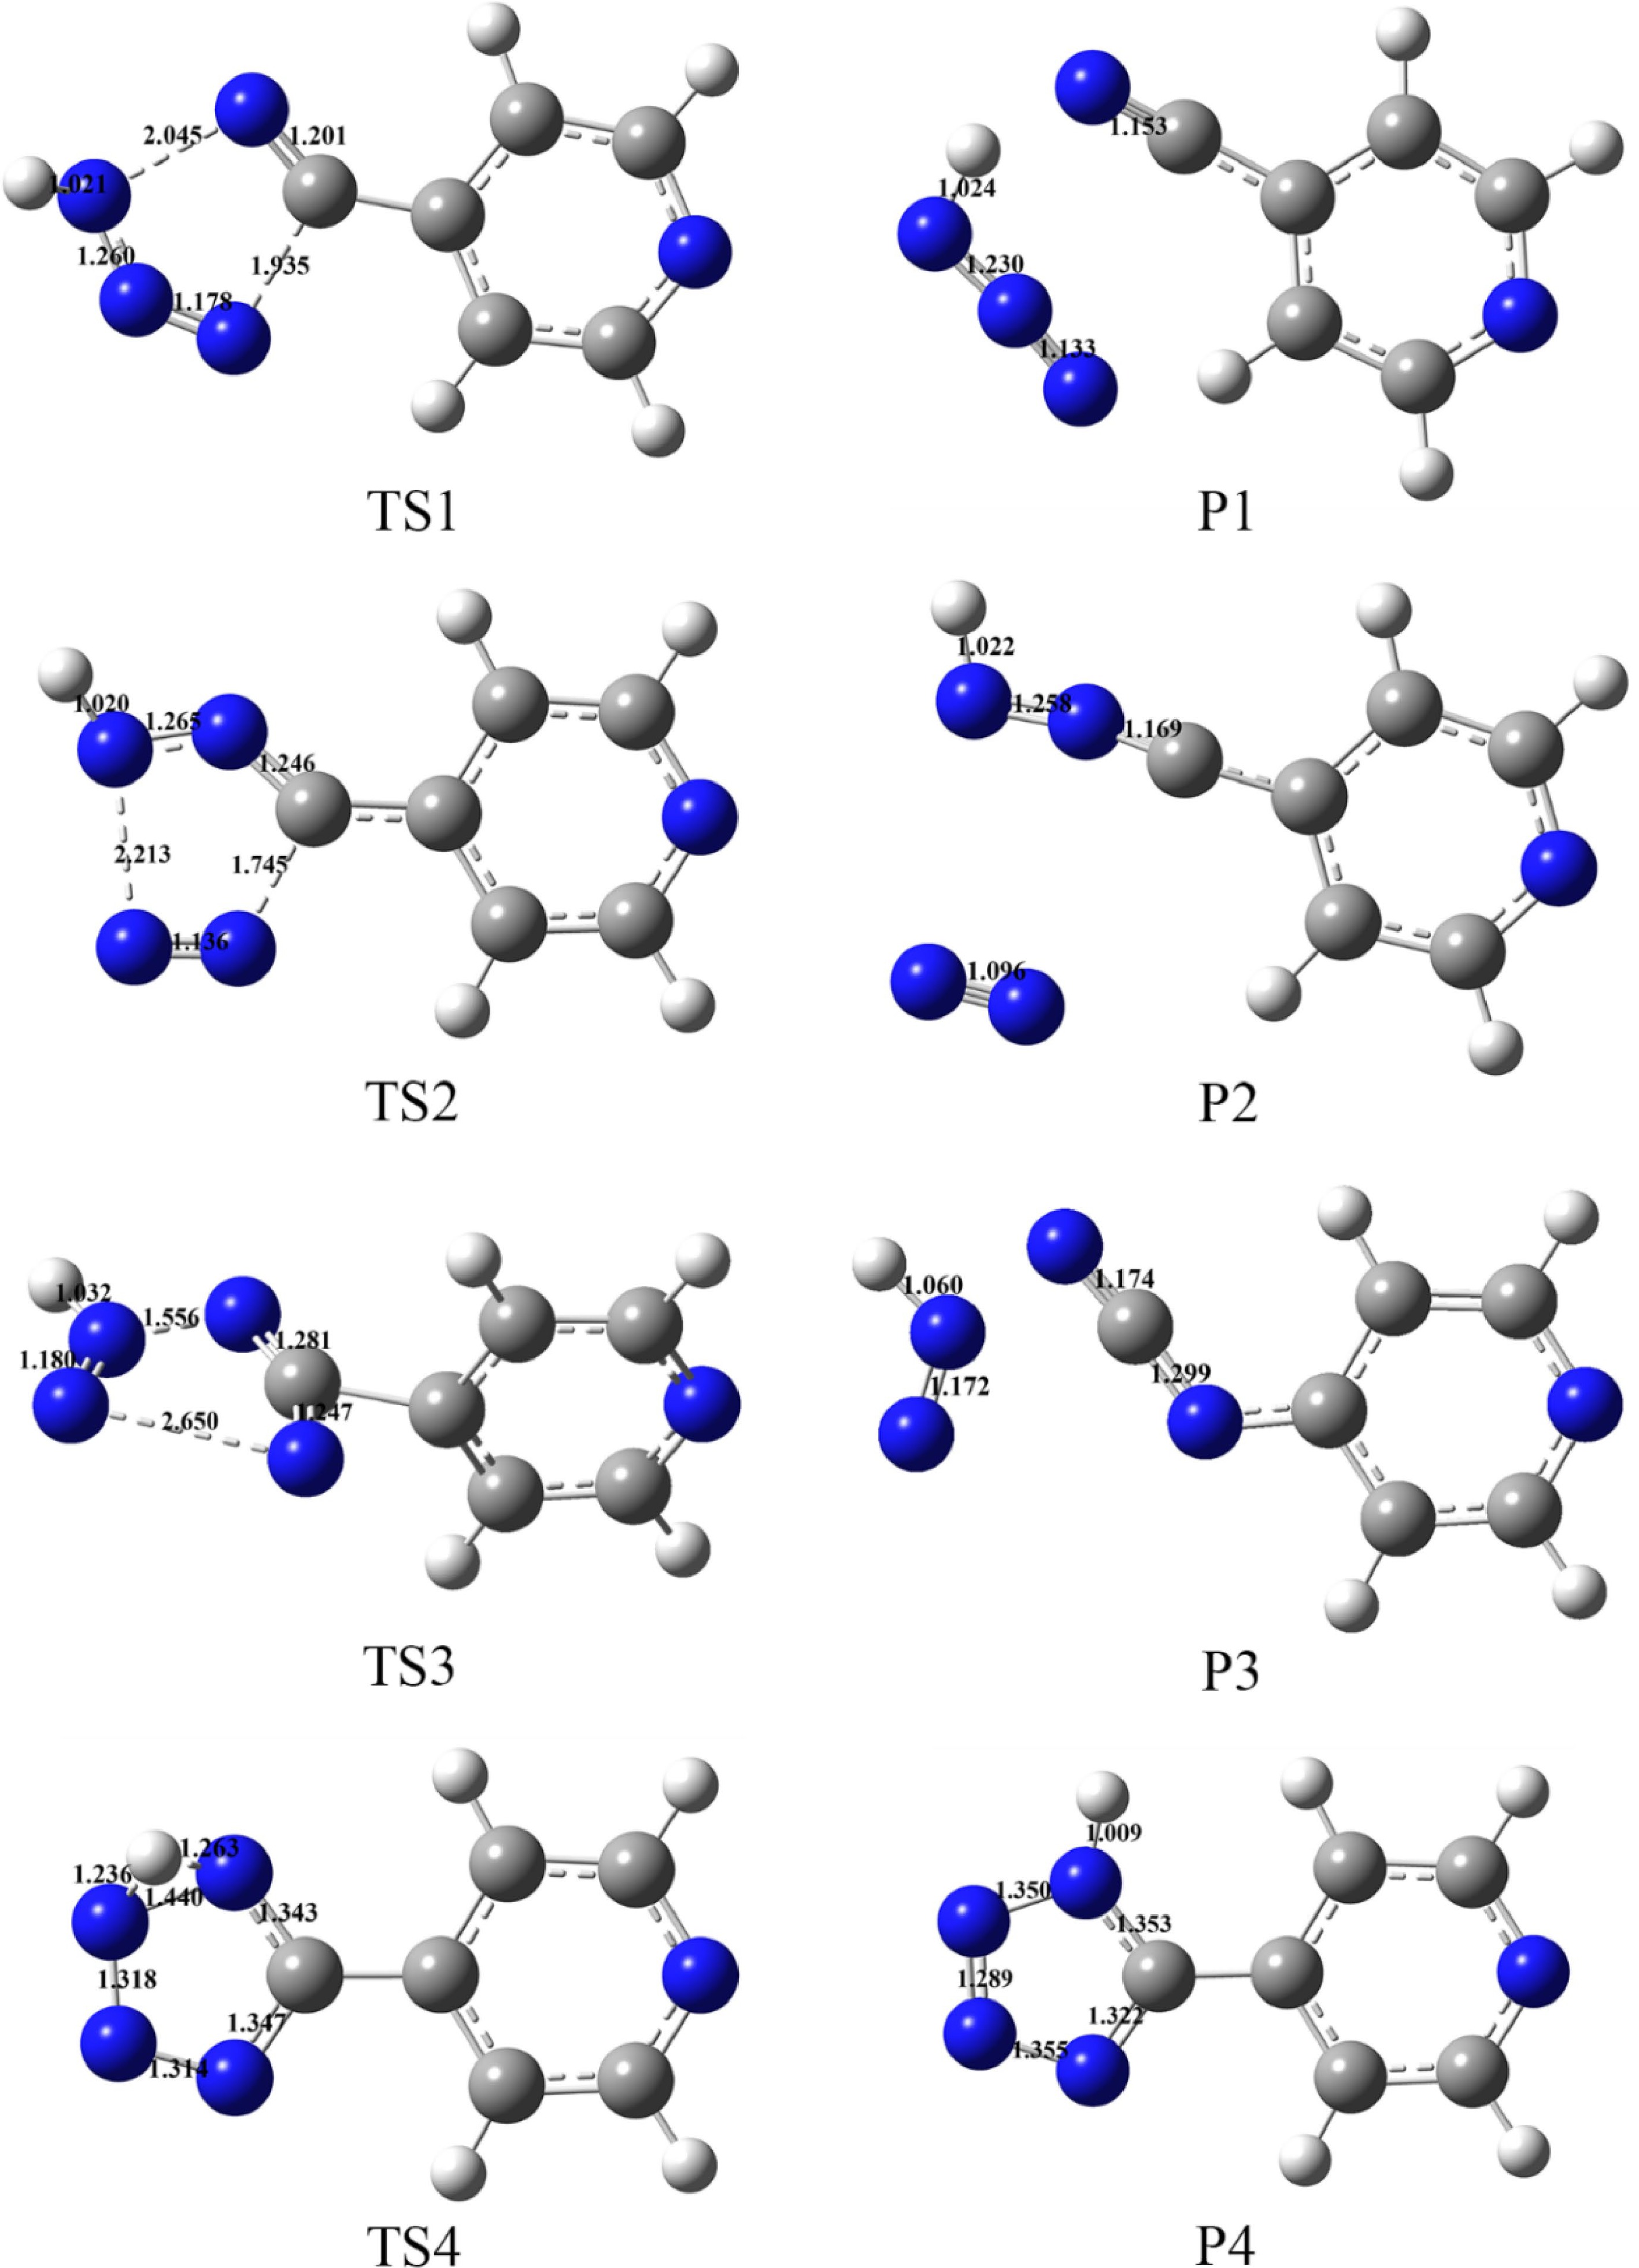
Figure 9.
Optimized configuration and bond lengths (Å) of transition states and products at B3LYP/6-311+G(d, p) level.
-
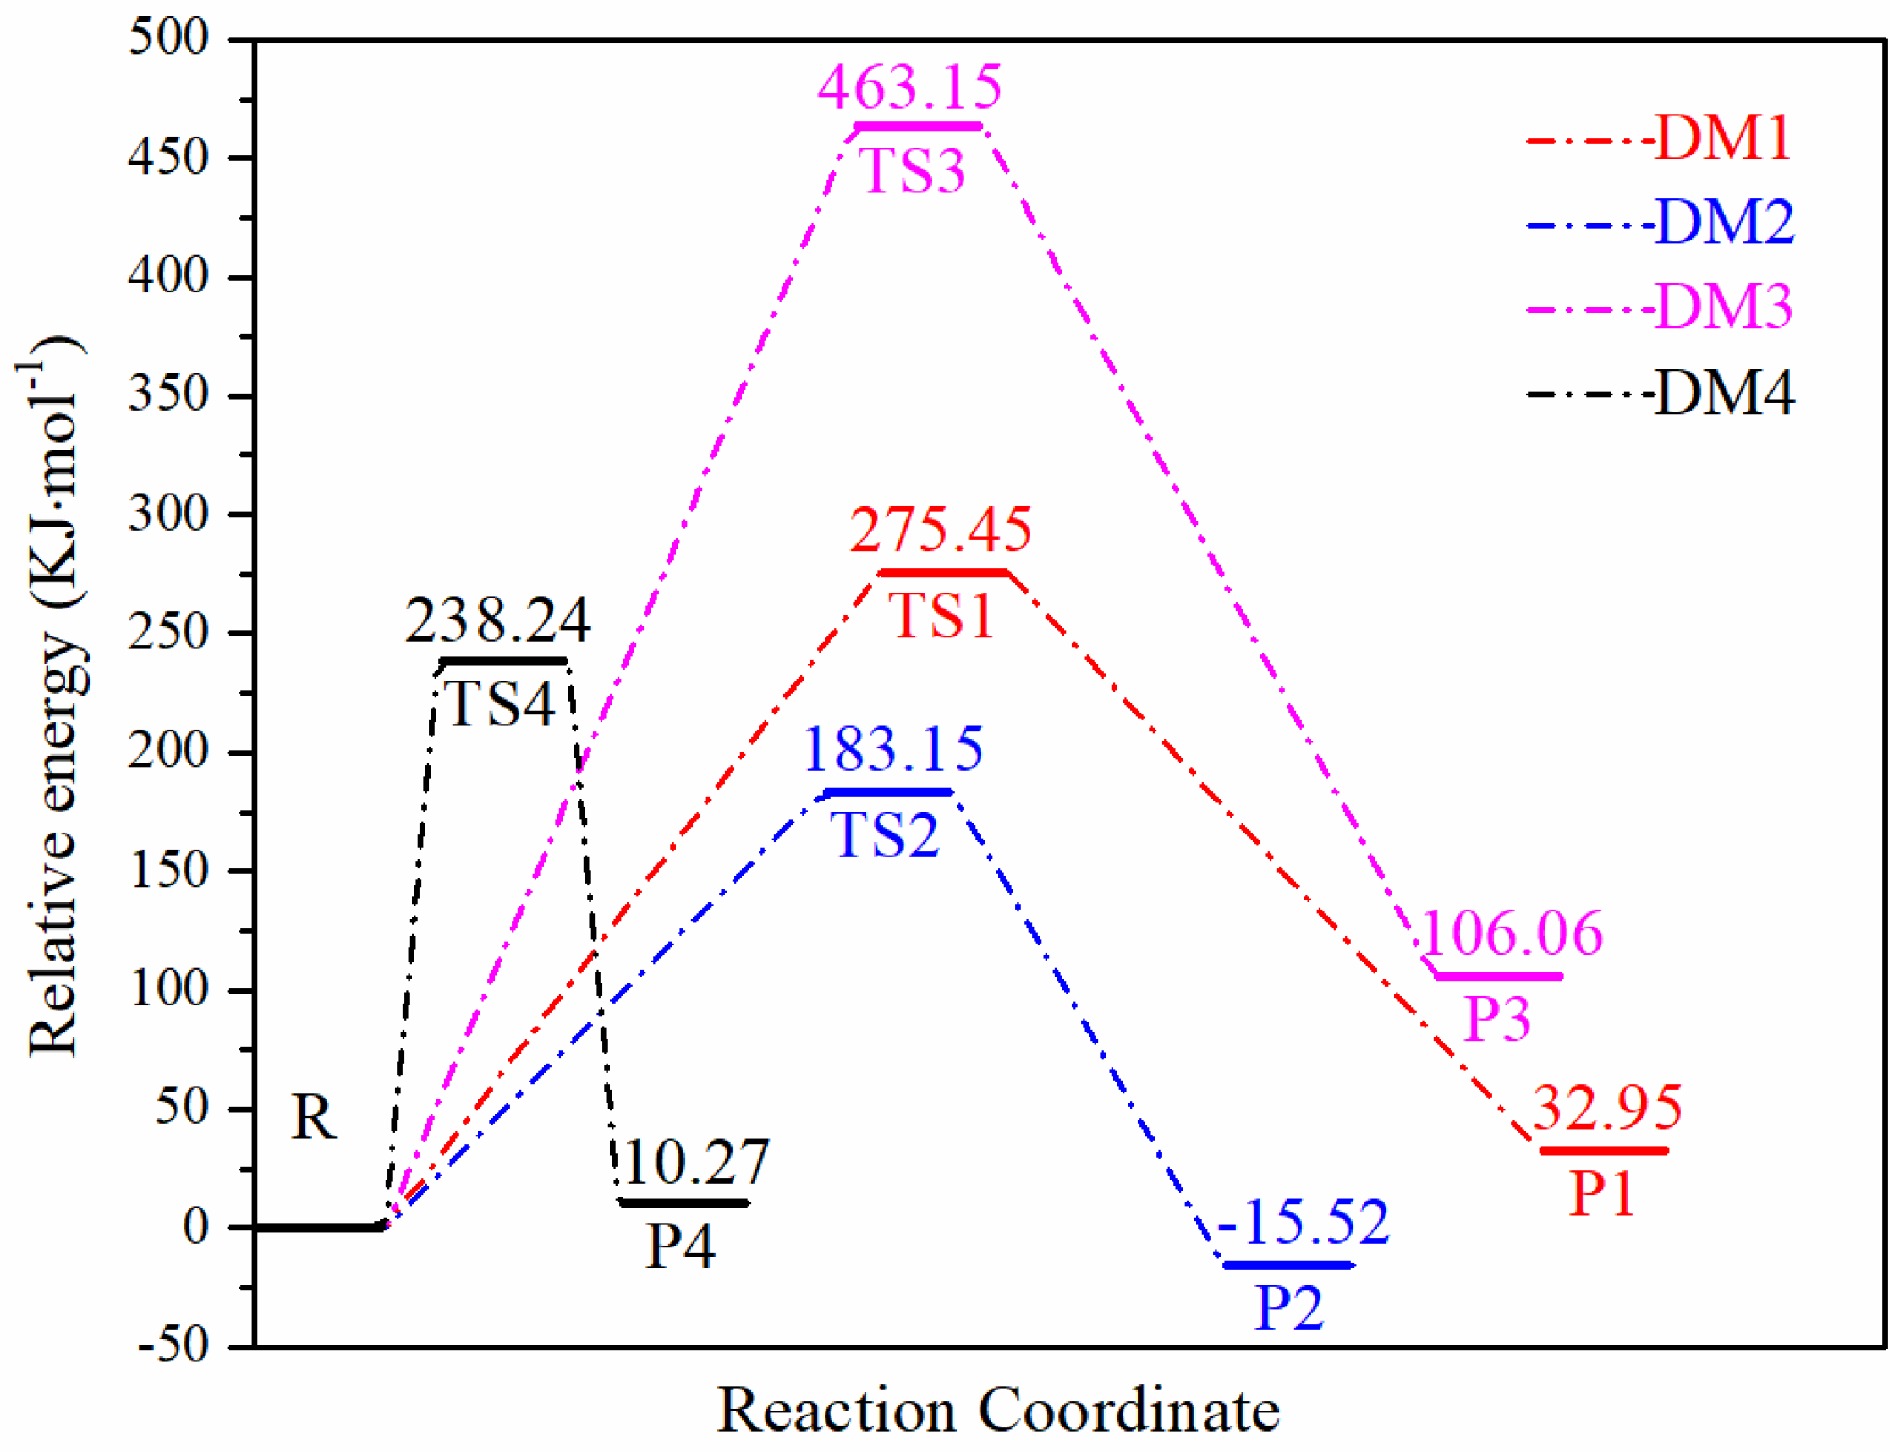
Figure 10.
Energy barriers corresponding to four decomposition reaction pathways.
-
Β (°C·min–1) T0 (°C) Tp (°C) Tend (°C) ΔHd (J/g) 2 249.03 251.3 253.3 1147.33 5 258.19 261.45 264.7 1055.02 8 262.71 267.38 272.88 924.26 10 264.03 268.78 273.58 1084.23 15 270.07 275.37 284.96 929.36 Table 1.
Thermal decomposition parameters at different heating rates for H4-PTZ.
-
Kissinger Ozawa Eα (kJ·mol–1) lnA (s–1) Eα (kJ·mol–1) Tp 194.35 42.82 193.29 T0 – – 220.07 Table 2.
Apparent activation energy using different methods.
-
No. Expression of f(α) No. Expression of f(α) 1 αm 6 (1–α)n[–ln(1–α)]p 2 (1–α)n 7 (1–α)m[1–(1–α)n]p 3 [–ln(1–α)]p 8 (1–α)m[(1–α)n–1]p 4 αm(1–α)n 9 n(1–α)[–ln(1–α)]1–1/n 5 αm[–ln(1–α)]p 10 (1–α)n(1+kα) Table 3.
Several common forms of f(α).
-
Eoe
(kJ·mol−1)Eop
(kJ·mol−1)Te0
(°C)Tp0
(°C)TSADT
(°C)TTIT
(°C)Tb
(°C)5-(4-Pyridyl)tetrazolate 220.07 193.29 244.15 245.32 244.15 254.68 257.43 Table 4.
Thermal safety evaluation parameters.
-
ΔS≠ (J·mol−1·K−1) ΔH≠ (kJ·mol−1) ΔG≠ (kJ·mol−1) 5-(4-Pyridyl)tetrazolate 106.52 194.35 139.13 Table 5.
Thermodynamic parameters.
-
Atom Charge Atom Charge N1 −0.219 N9 −0.285 N2 −0.111 C10 +0.071 N3 −0.010 C11 −0.123 N4 −0.266 H12 +0.260 C5 +0.352 H13 +0.117 C6 −0.070 H14 +0.115 C7 −0.122 H15 +0.113 C8 +0.071 H16 +0.108 Table 6.
Mulliken atomic charges of H4-PTZ at B3LYP/6-311G(d, p) level(e).
-
TS TS1 TS2 TS3 TS4 Frequencies 517.64i 438.40i 450.68i 1744.57i Table 7.
Negative imaginary frequencies of transition states at B3LYP/6-311+G(d, p) level (cm−1).
-
E/B2PLYP ZPE/B3LYP Etot R −504.529662 0.082568 −504.447094 TS1 −504.417169 0.074990 −504.342179 TS2 −504.452378 0.075044 −504.377334 TS3 −504.344675 0.073984 −504.270691 TS4 −504.432017 0.075664 −504.356353 P1 −504.489591 0.055047 −504.434544 P2 −504.507572 0.054567 −504.453005 P3 −504.455678 0.048981 −504.406697 P4 −504.524742 0.081559 −504.443183 Table 8.
Energy values of H4-PTZ and each stagnation points (Hartree).
Figures
(10)
Tables
(8)