-
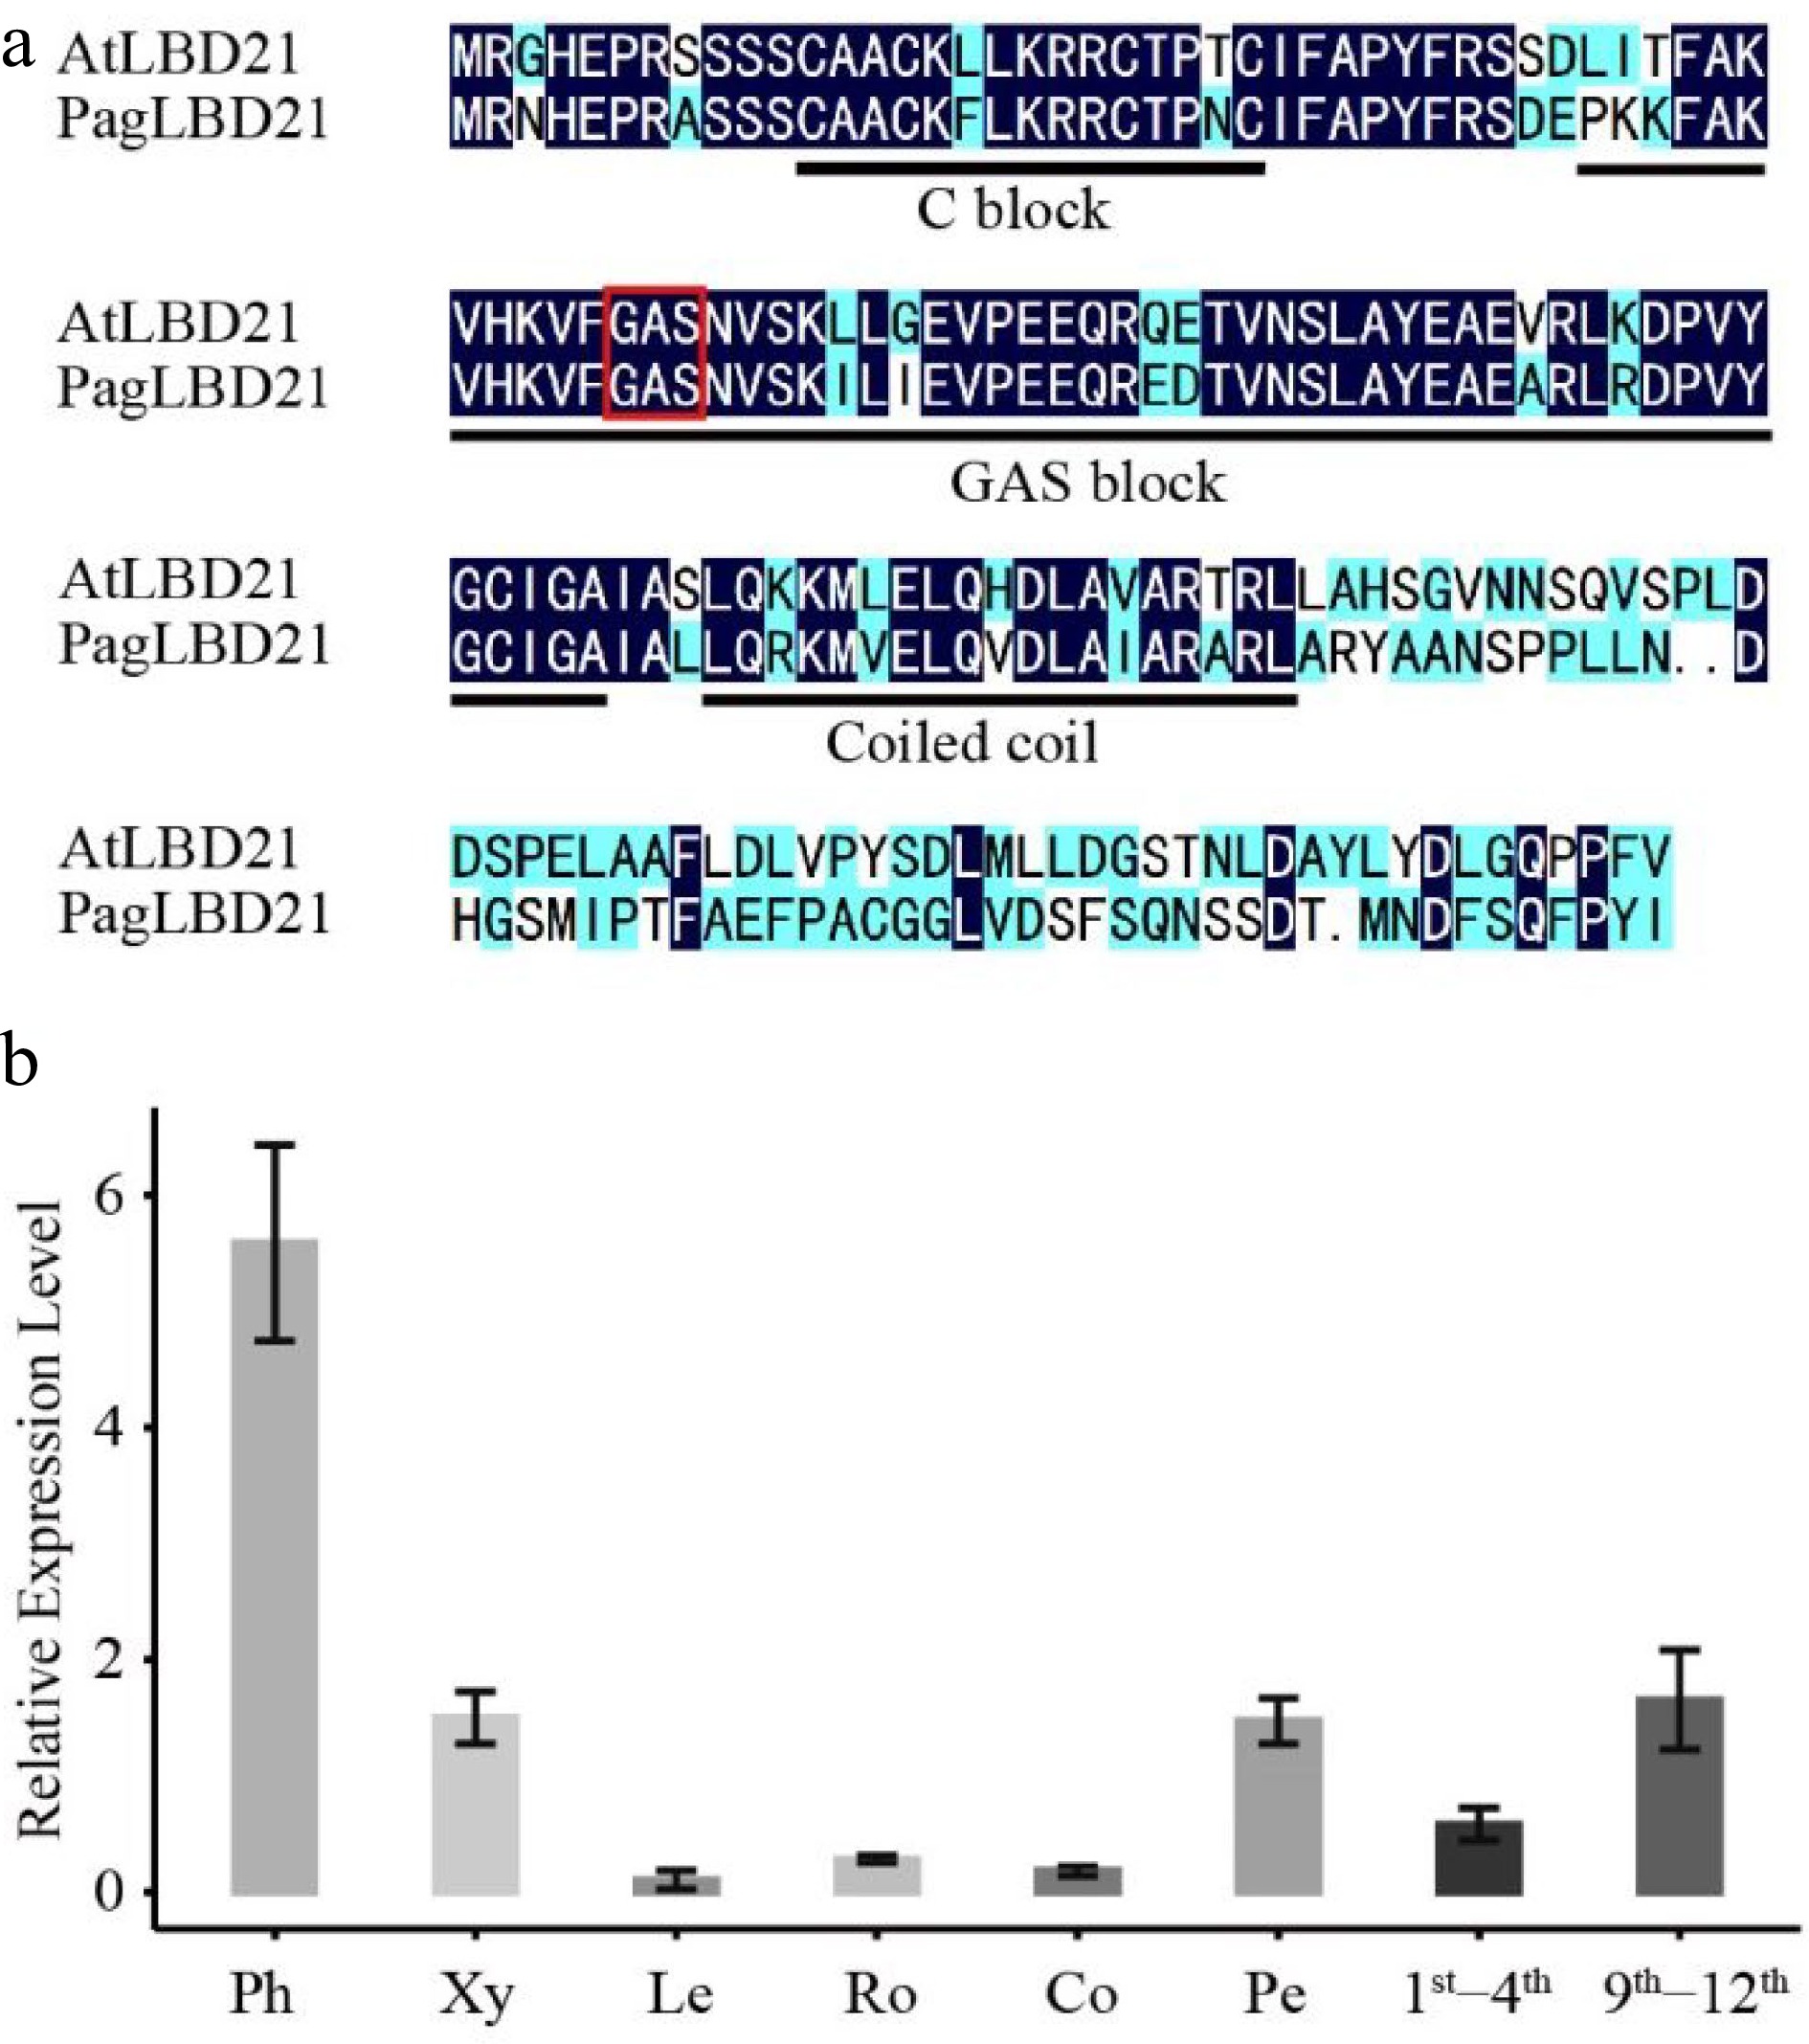
Figure 1.
Characterization of PagLBD21 in Populus. (a) Amino acid sequence alignment of Populus PagLBD21 and Arabidopsis AtLBD21. Black and blue colors indicate identical and similar amino acids, respectively. The red box represents the core amino acid of GAS block. (b) RT-qPCR of PagLBD21 in different tissues using wild type. Each value is the mean ± standard error (SEM) of three replicates (n = 3 technical repetitions). Ph, phloem; Xy, xylem; Le, leaves; Ro, root; Co, cortex; Pe, petiole; 1st−4th, the stem of 1st to 4th internodes; 9th−12th, the stem of 9th to 12th internodes.
-
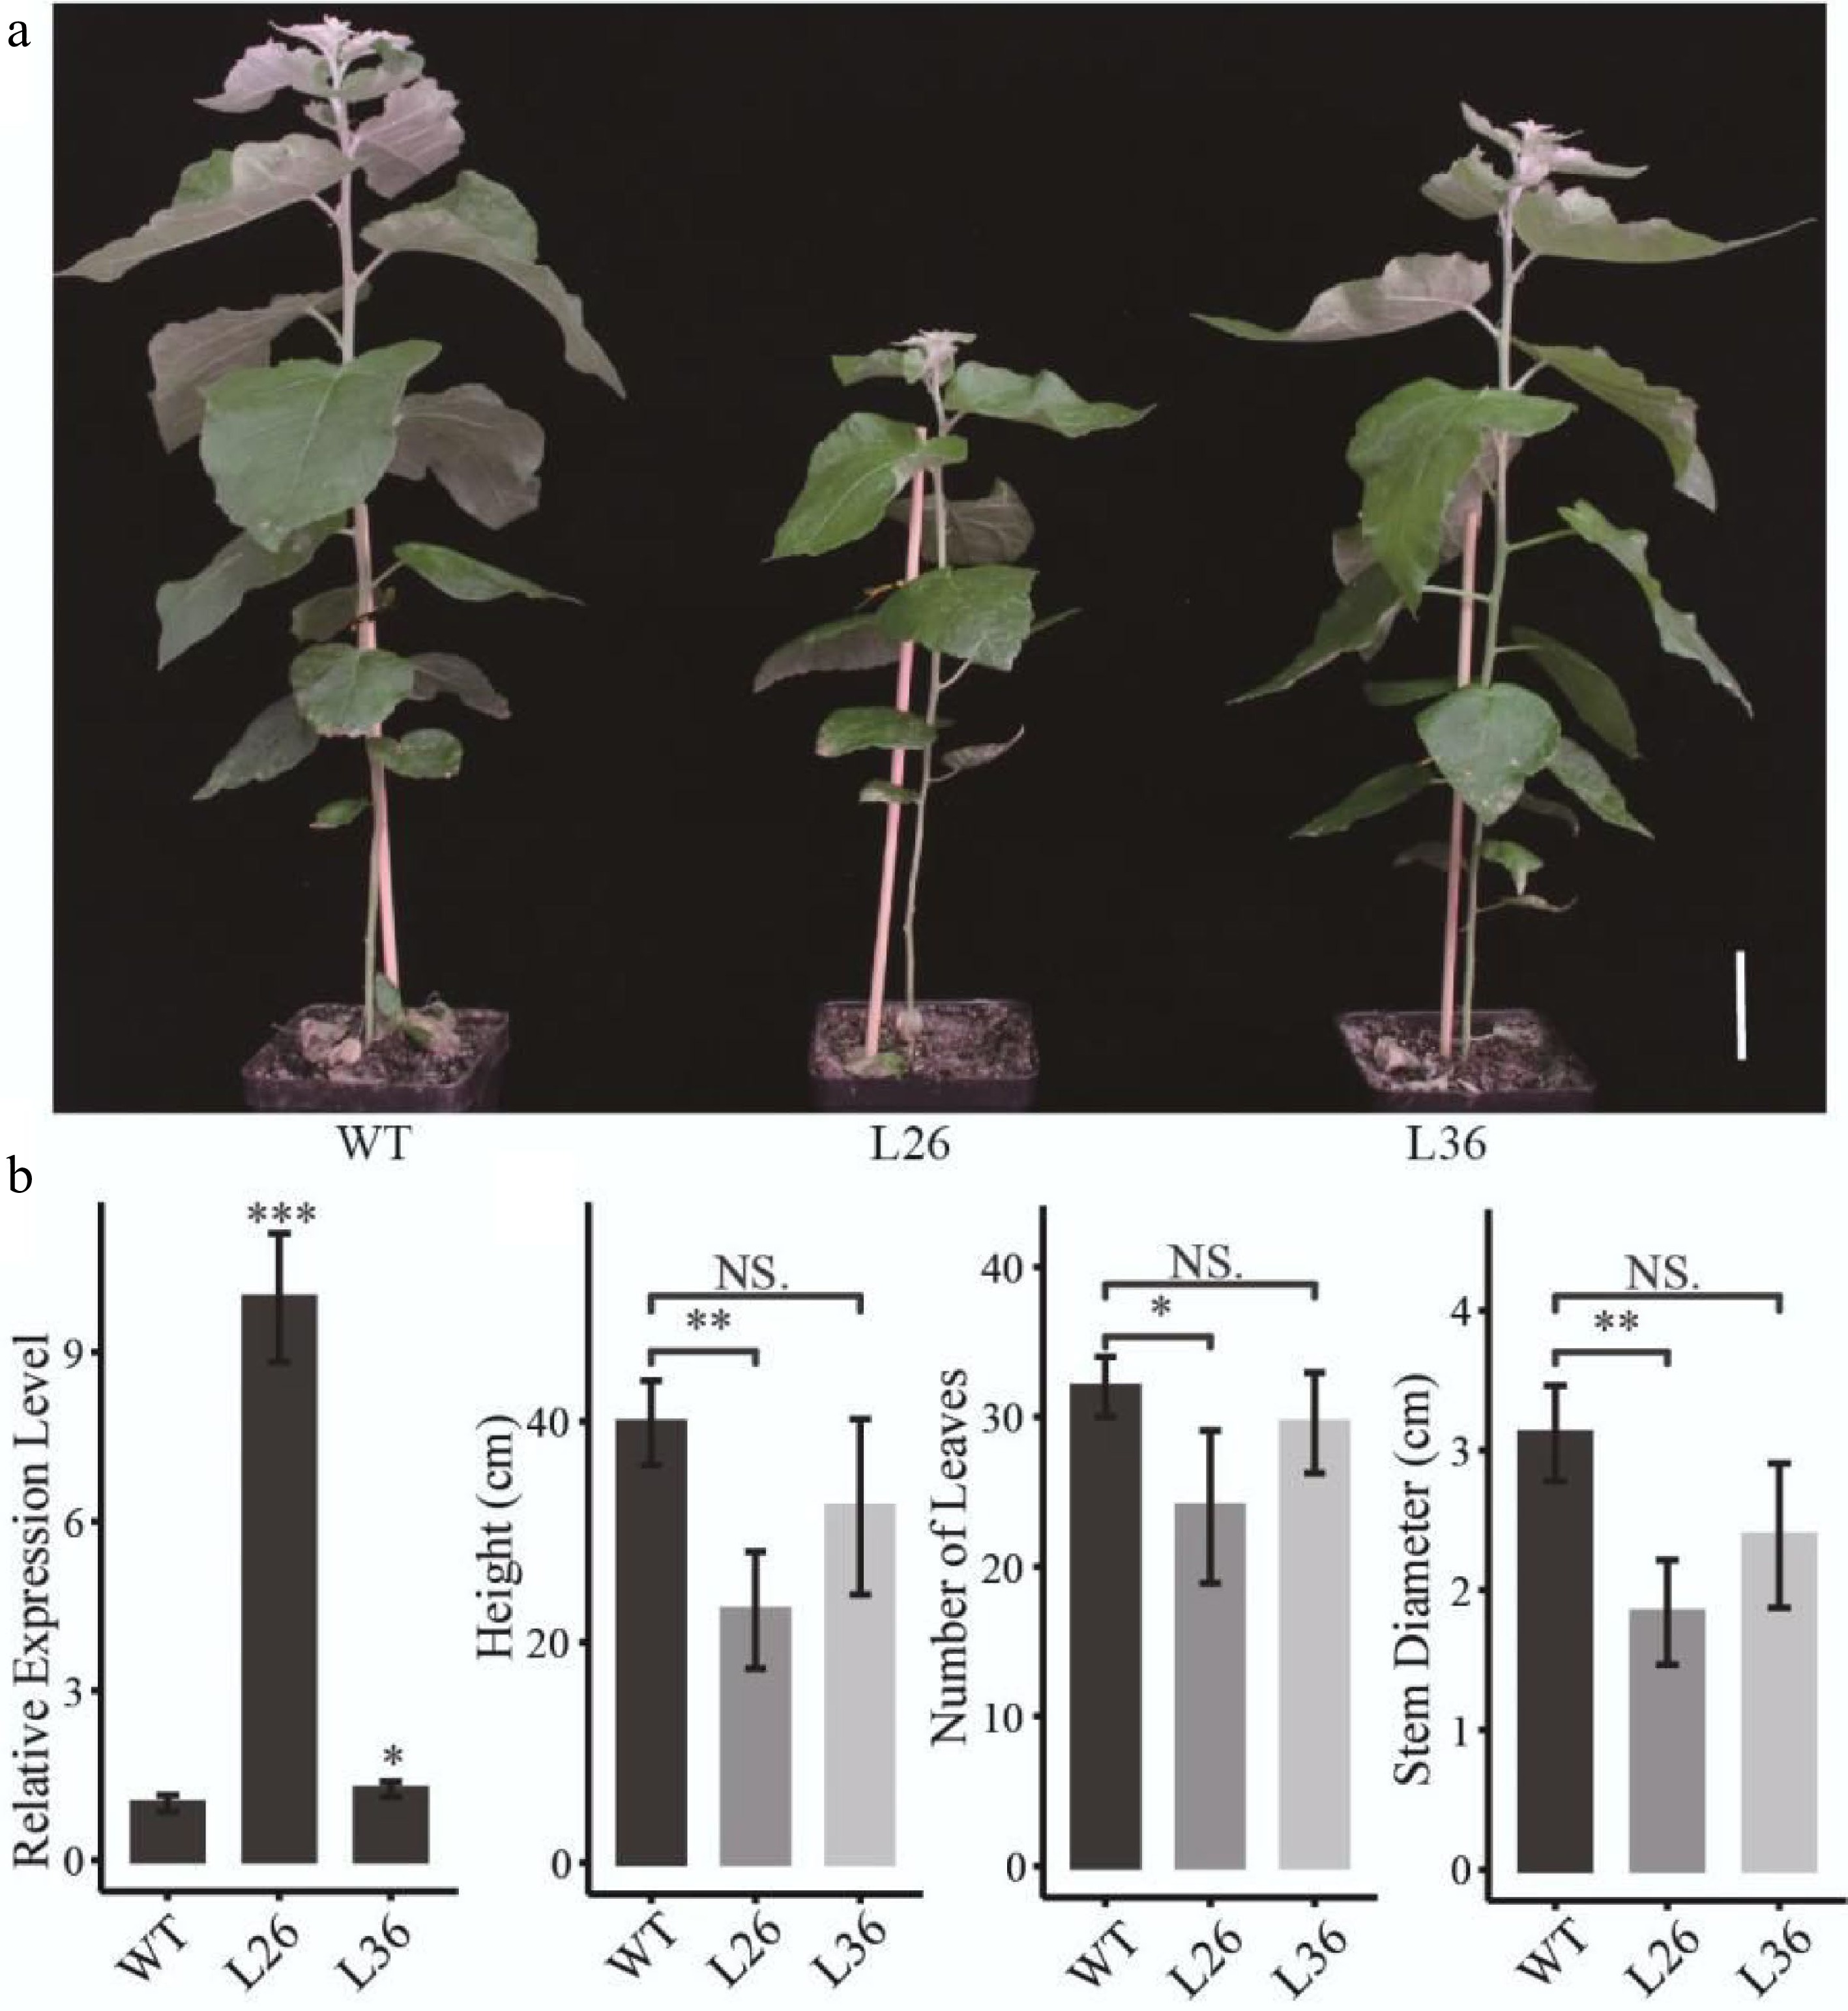
Figure 2.
Effects of PagLBD21 overexpression (PagLBD21OE) in Populus. (a) Morphological phenotypes of 2-month-old PagLBD21OE transgenic lines compared to wild type (WT). Scale bar = 5 cm. The WT, L26 and L36 represent wild-type, the overexpression line of number 26, the overexpression line of number 36, respectively. (b) RT-qPCR of PagLBD21 in PagLBD21OE transgenic lines and WT. (c) The comparison of WT and PagLBD21OE transgenic lines in plants' height, stem diameter, and number of leaves. Each value is the mean ± SD of three replicates (n = 3 biological replicates). Student's t-test was used: *, P < 0.05; **, P < 0.01; NS, nonsignificant.
-
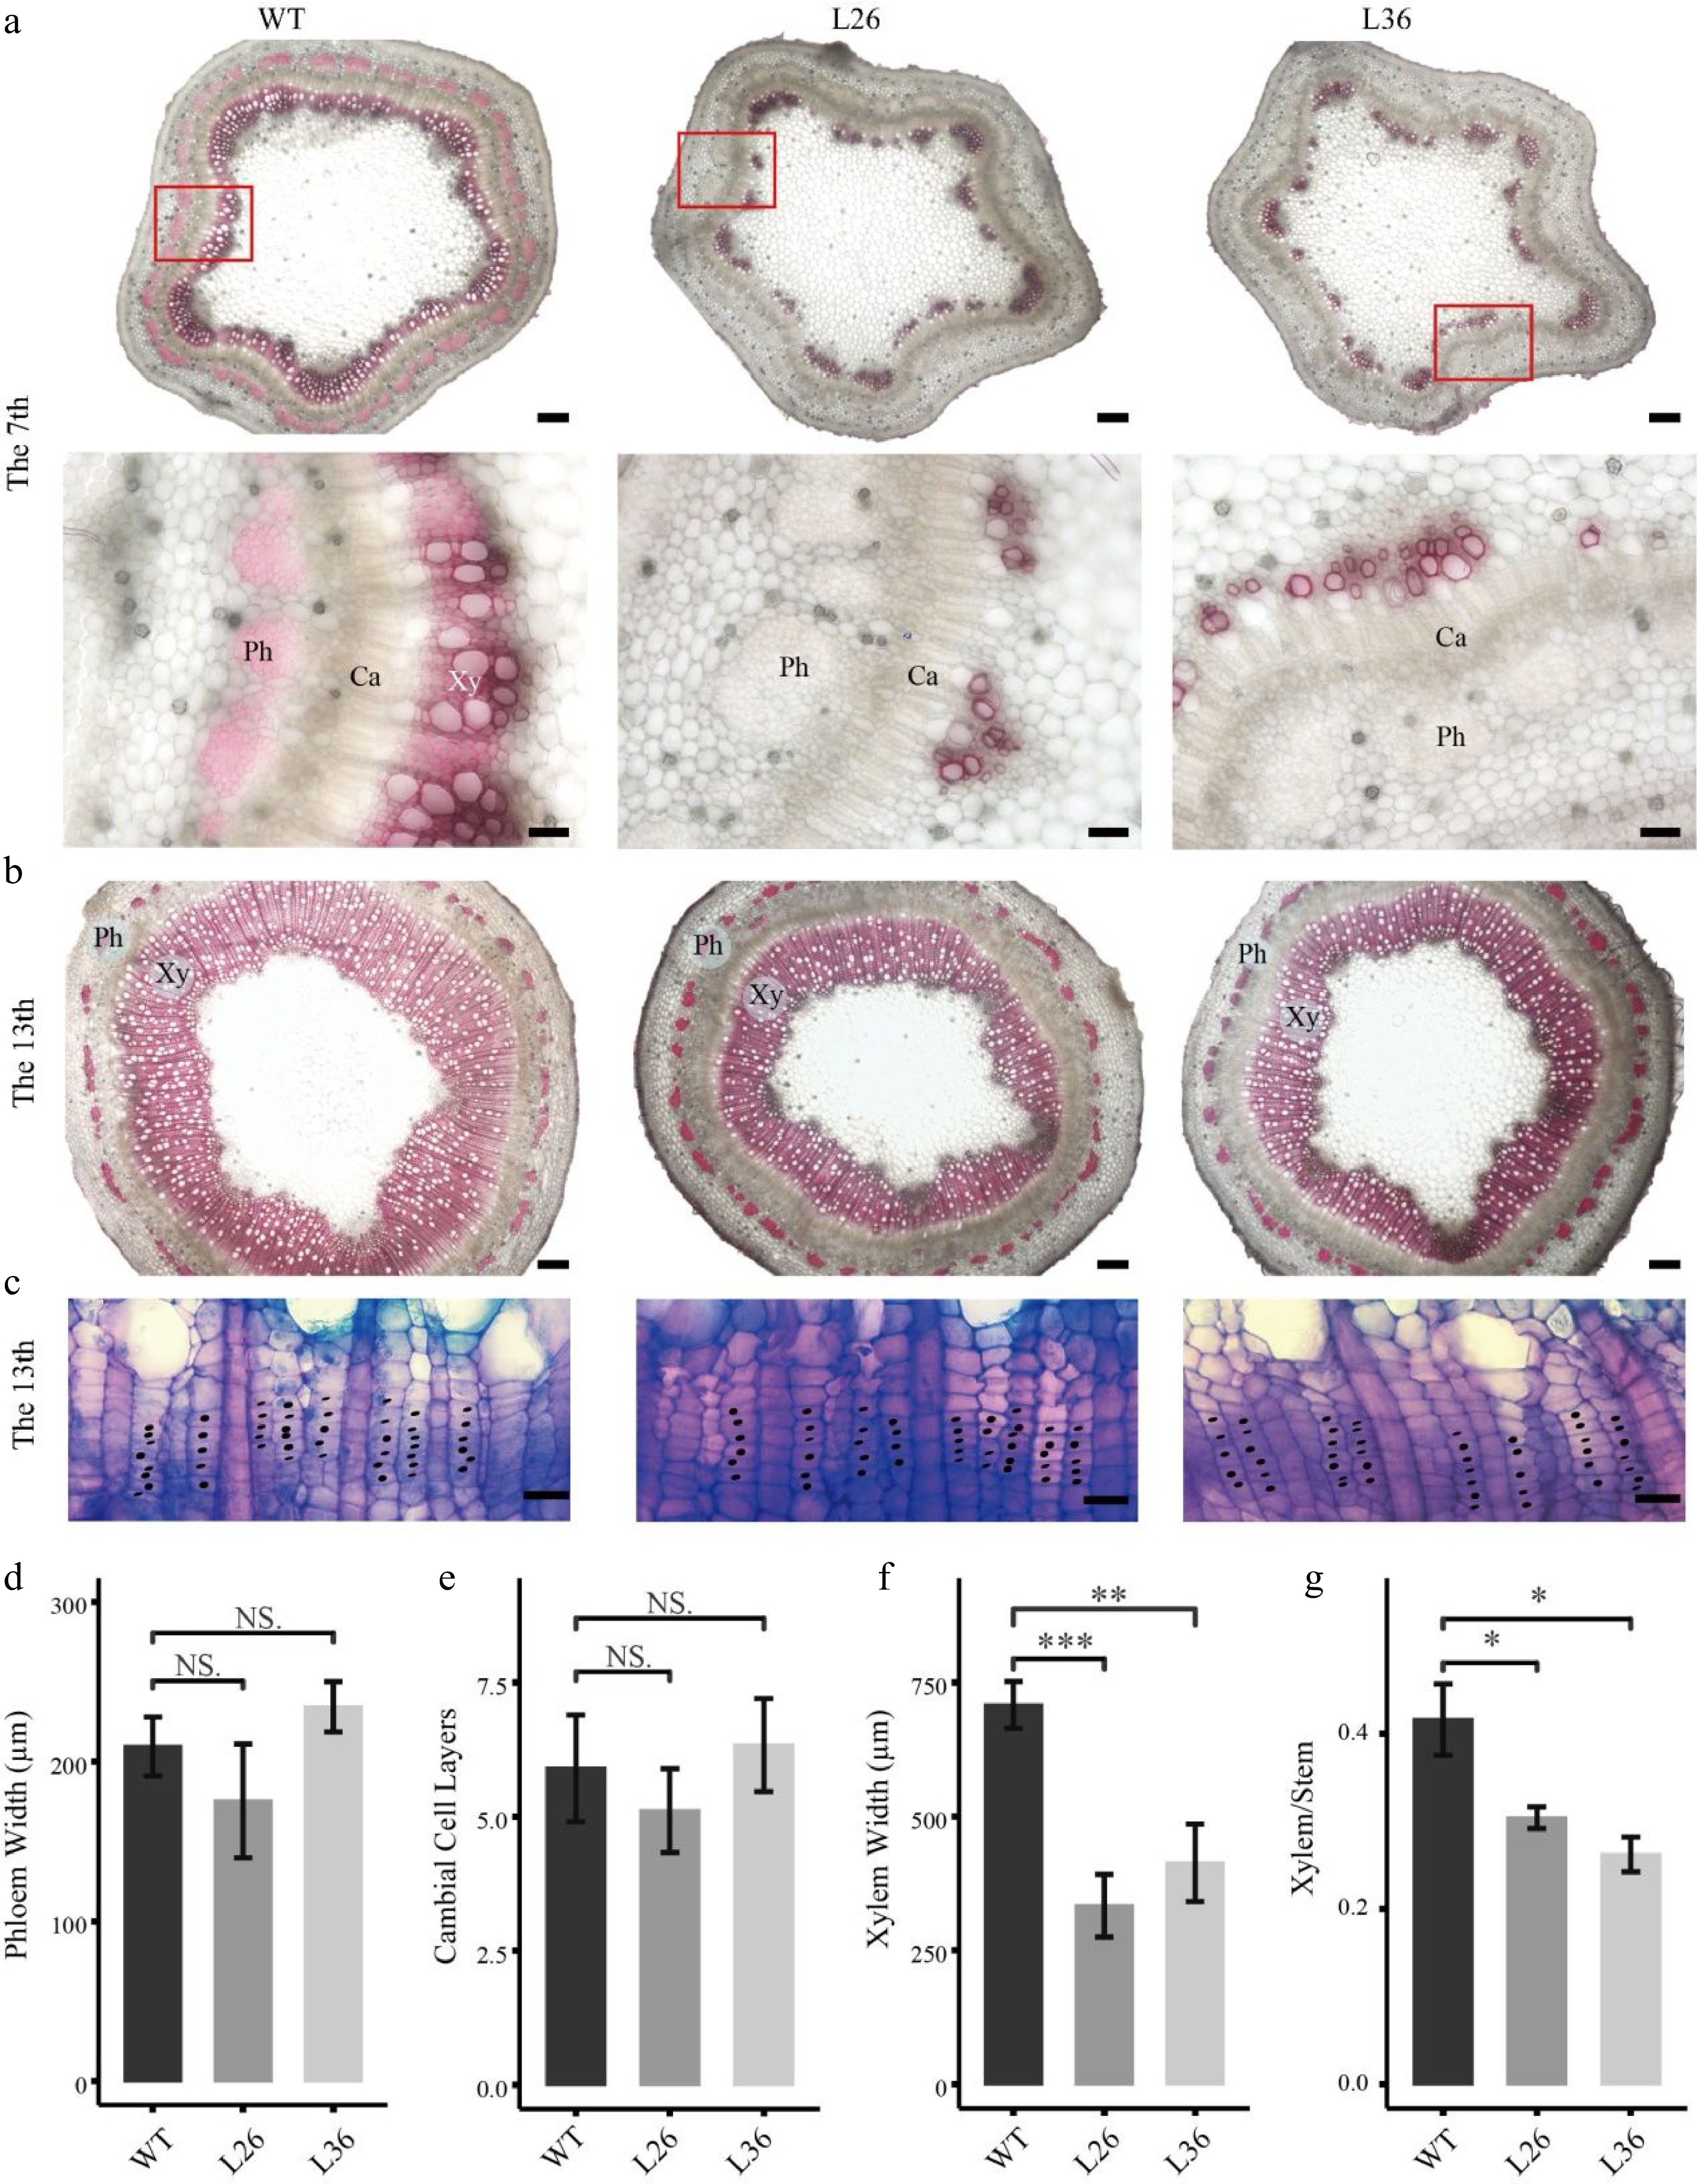
Figure 3.
Effects of PagLBD21 overexpression (PagLBD21OE) on secondary growth in Populus. Stem cross sections of (a) 7th and (b), (c) 13th internodes of WT and PagLBD21OE plants. Scale bar: 200 μm for (b) and the upper panel of (a), 50 μm for the lower panel of (a), 20 μm for (c). The red-boxed area in the upper panels is depicted in detail in the lower panels. Xy, xylem. Ph, phloem. Ca, cambium. Detailed observation of the cambial zone (c) was stained by toluidine blue O, cambial cells were marked with black dots. The cambial cell layers (e) were analyzed according to (c). The phloem widths (d), xylem widths (f), and xylem widths divided by the radius (Xylem/Stem) (g) in 13th internodes were measured by ImageJ. Each value is the mean ± SD of three replicates (n = 3). Student’s t-test was used: *, P < 0.05; **, P < 0.01; ***, P < 0.001; NS, nonsignificant.
-
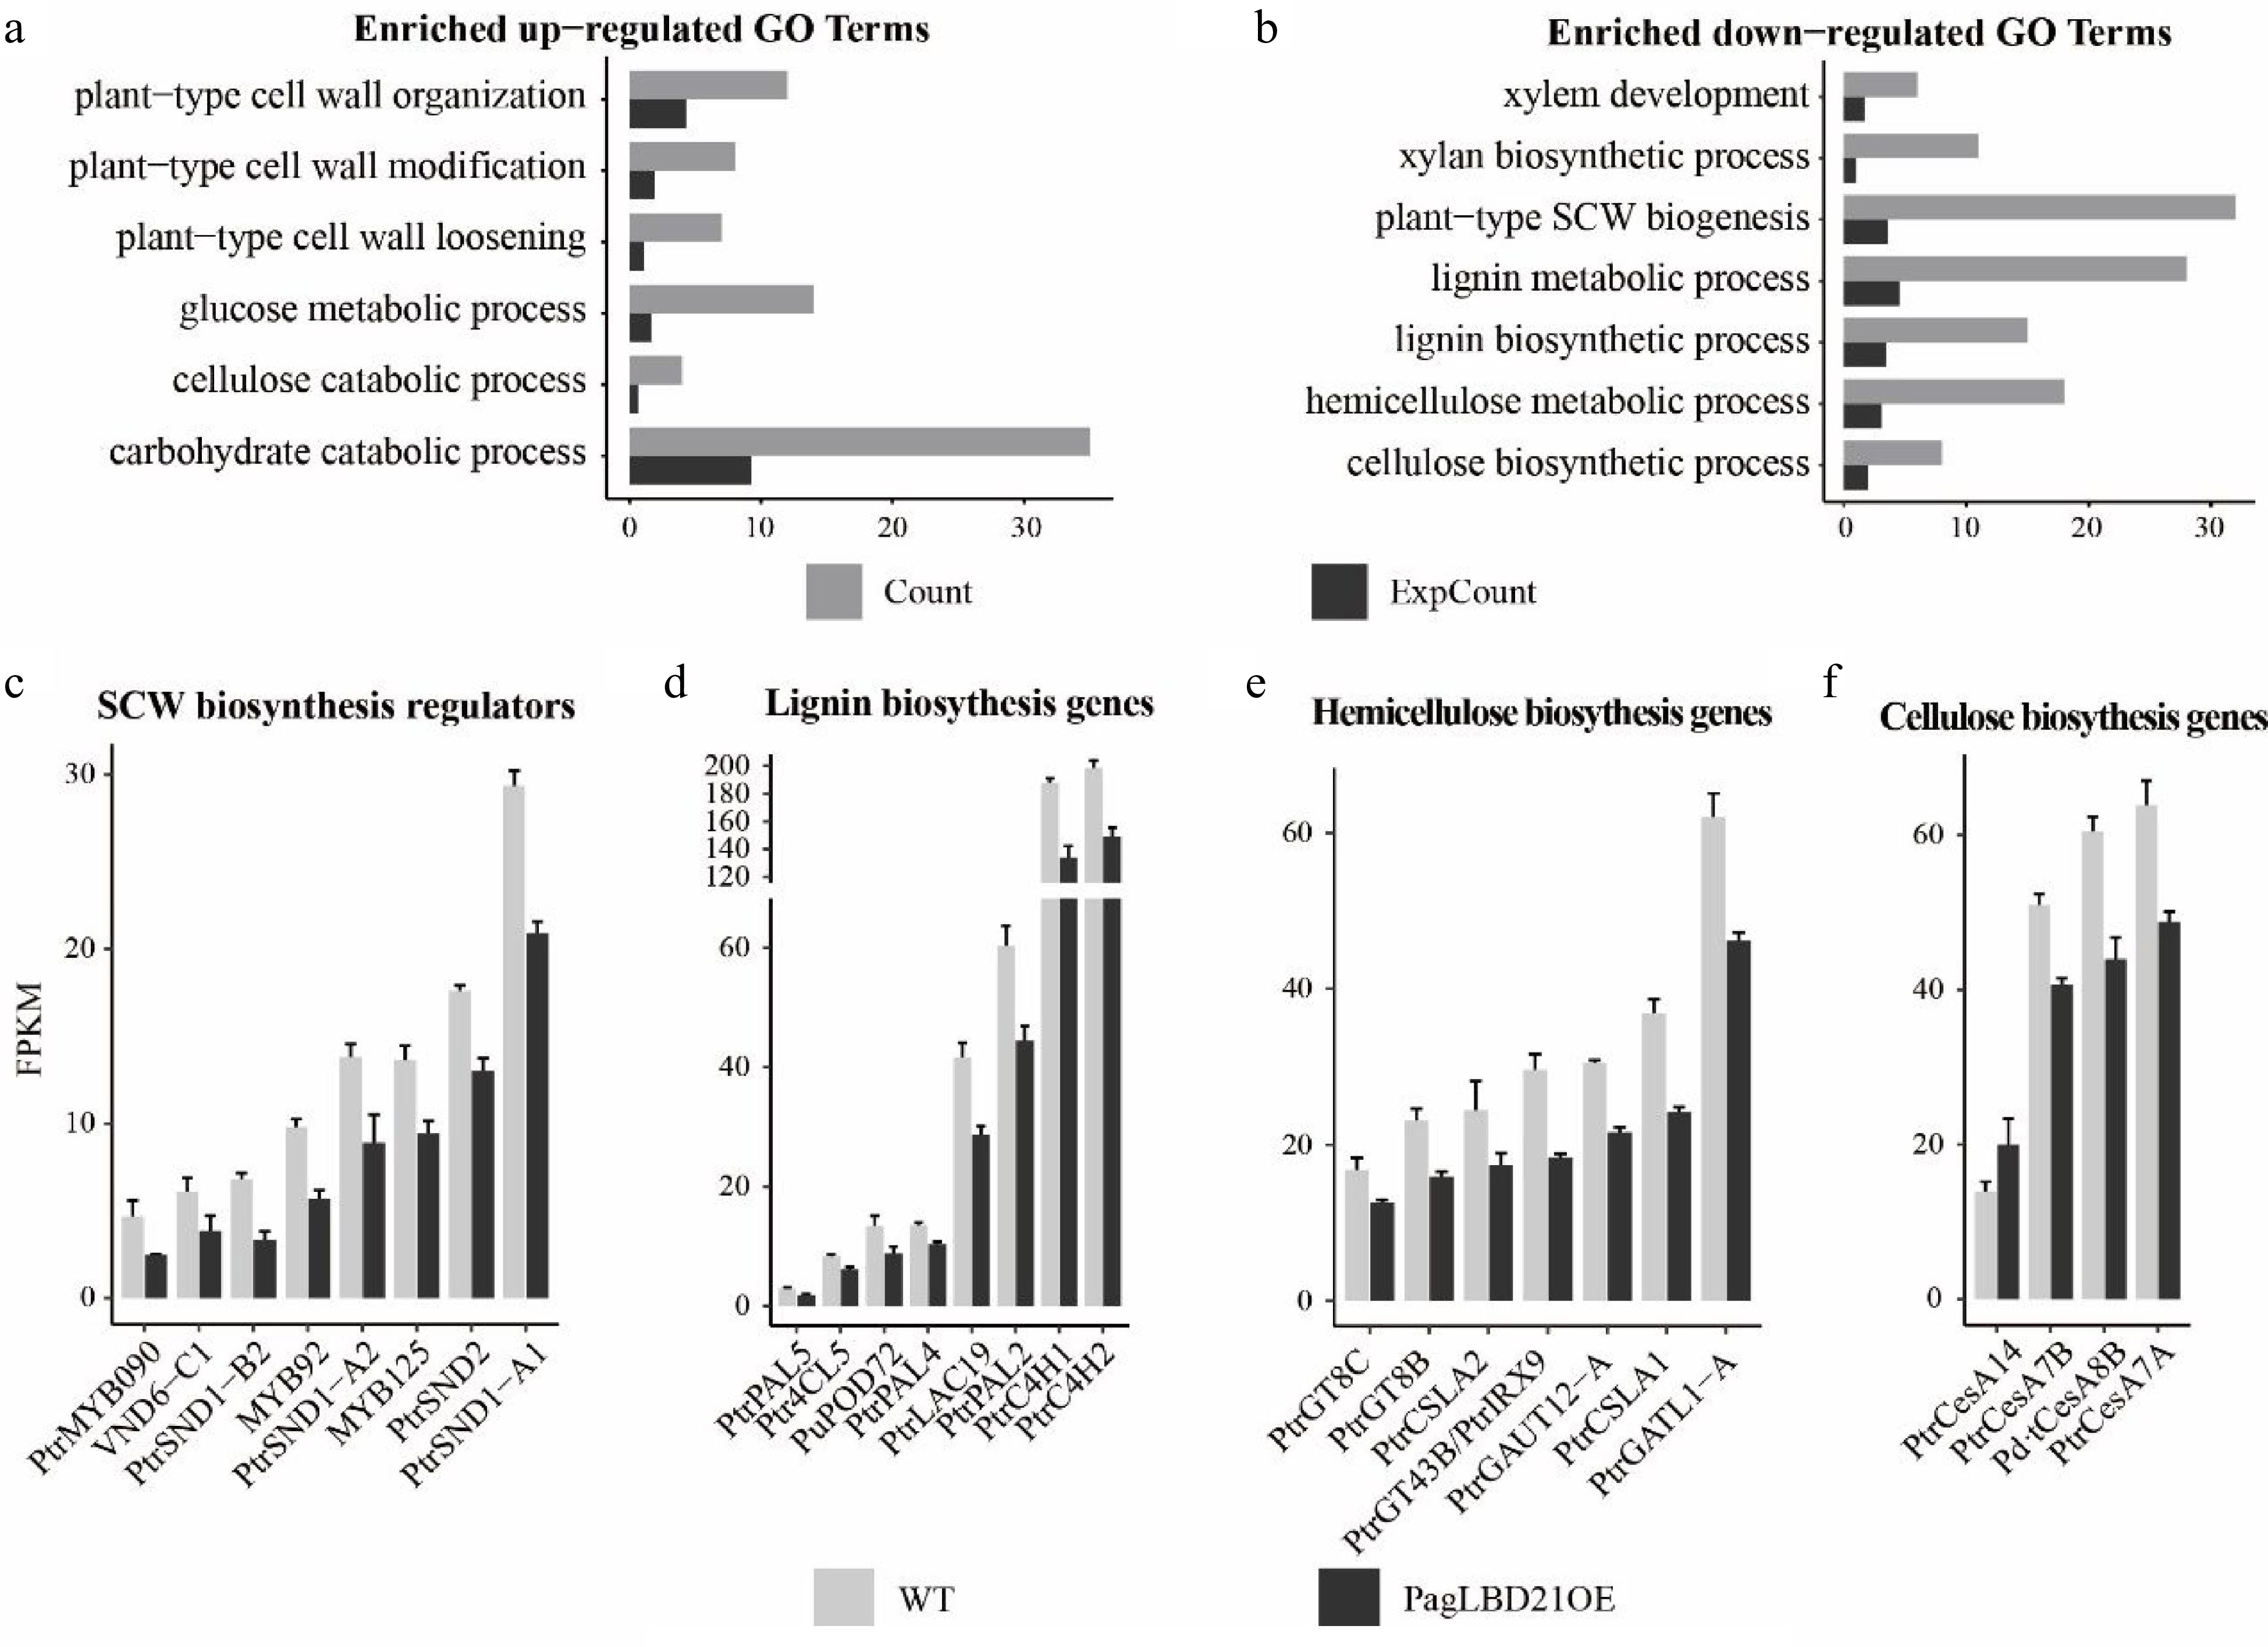
Figure 4.
Transcriptome analysis of PagLBD21OE plant. (a), (b) Enriched Gene Ontology (GO) categories of (a) up-regulated and (b) down-regulated differentially expressed genes (DEGs) in PagLBD21OE line 36. Count, the number of genes in a GO term, ExpCount, the expected gene number. Expression of representative genes that function in (c) SCW biosynthesis regulatory pathway, (d) lignin biosynthesis, (e) hemicellulose biosynthesis, and (f) cellulose biosynthesis. The fragments per kilobase of exon per million mapped fragments (FPKM) for each gene from RNA-seq experiments were shown. Each value is the mean + standard error (SD) of three replicates (n = 3 technical repetitions). (n = 3 biological replicates).
-
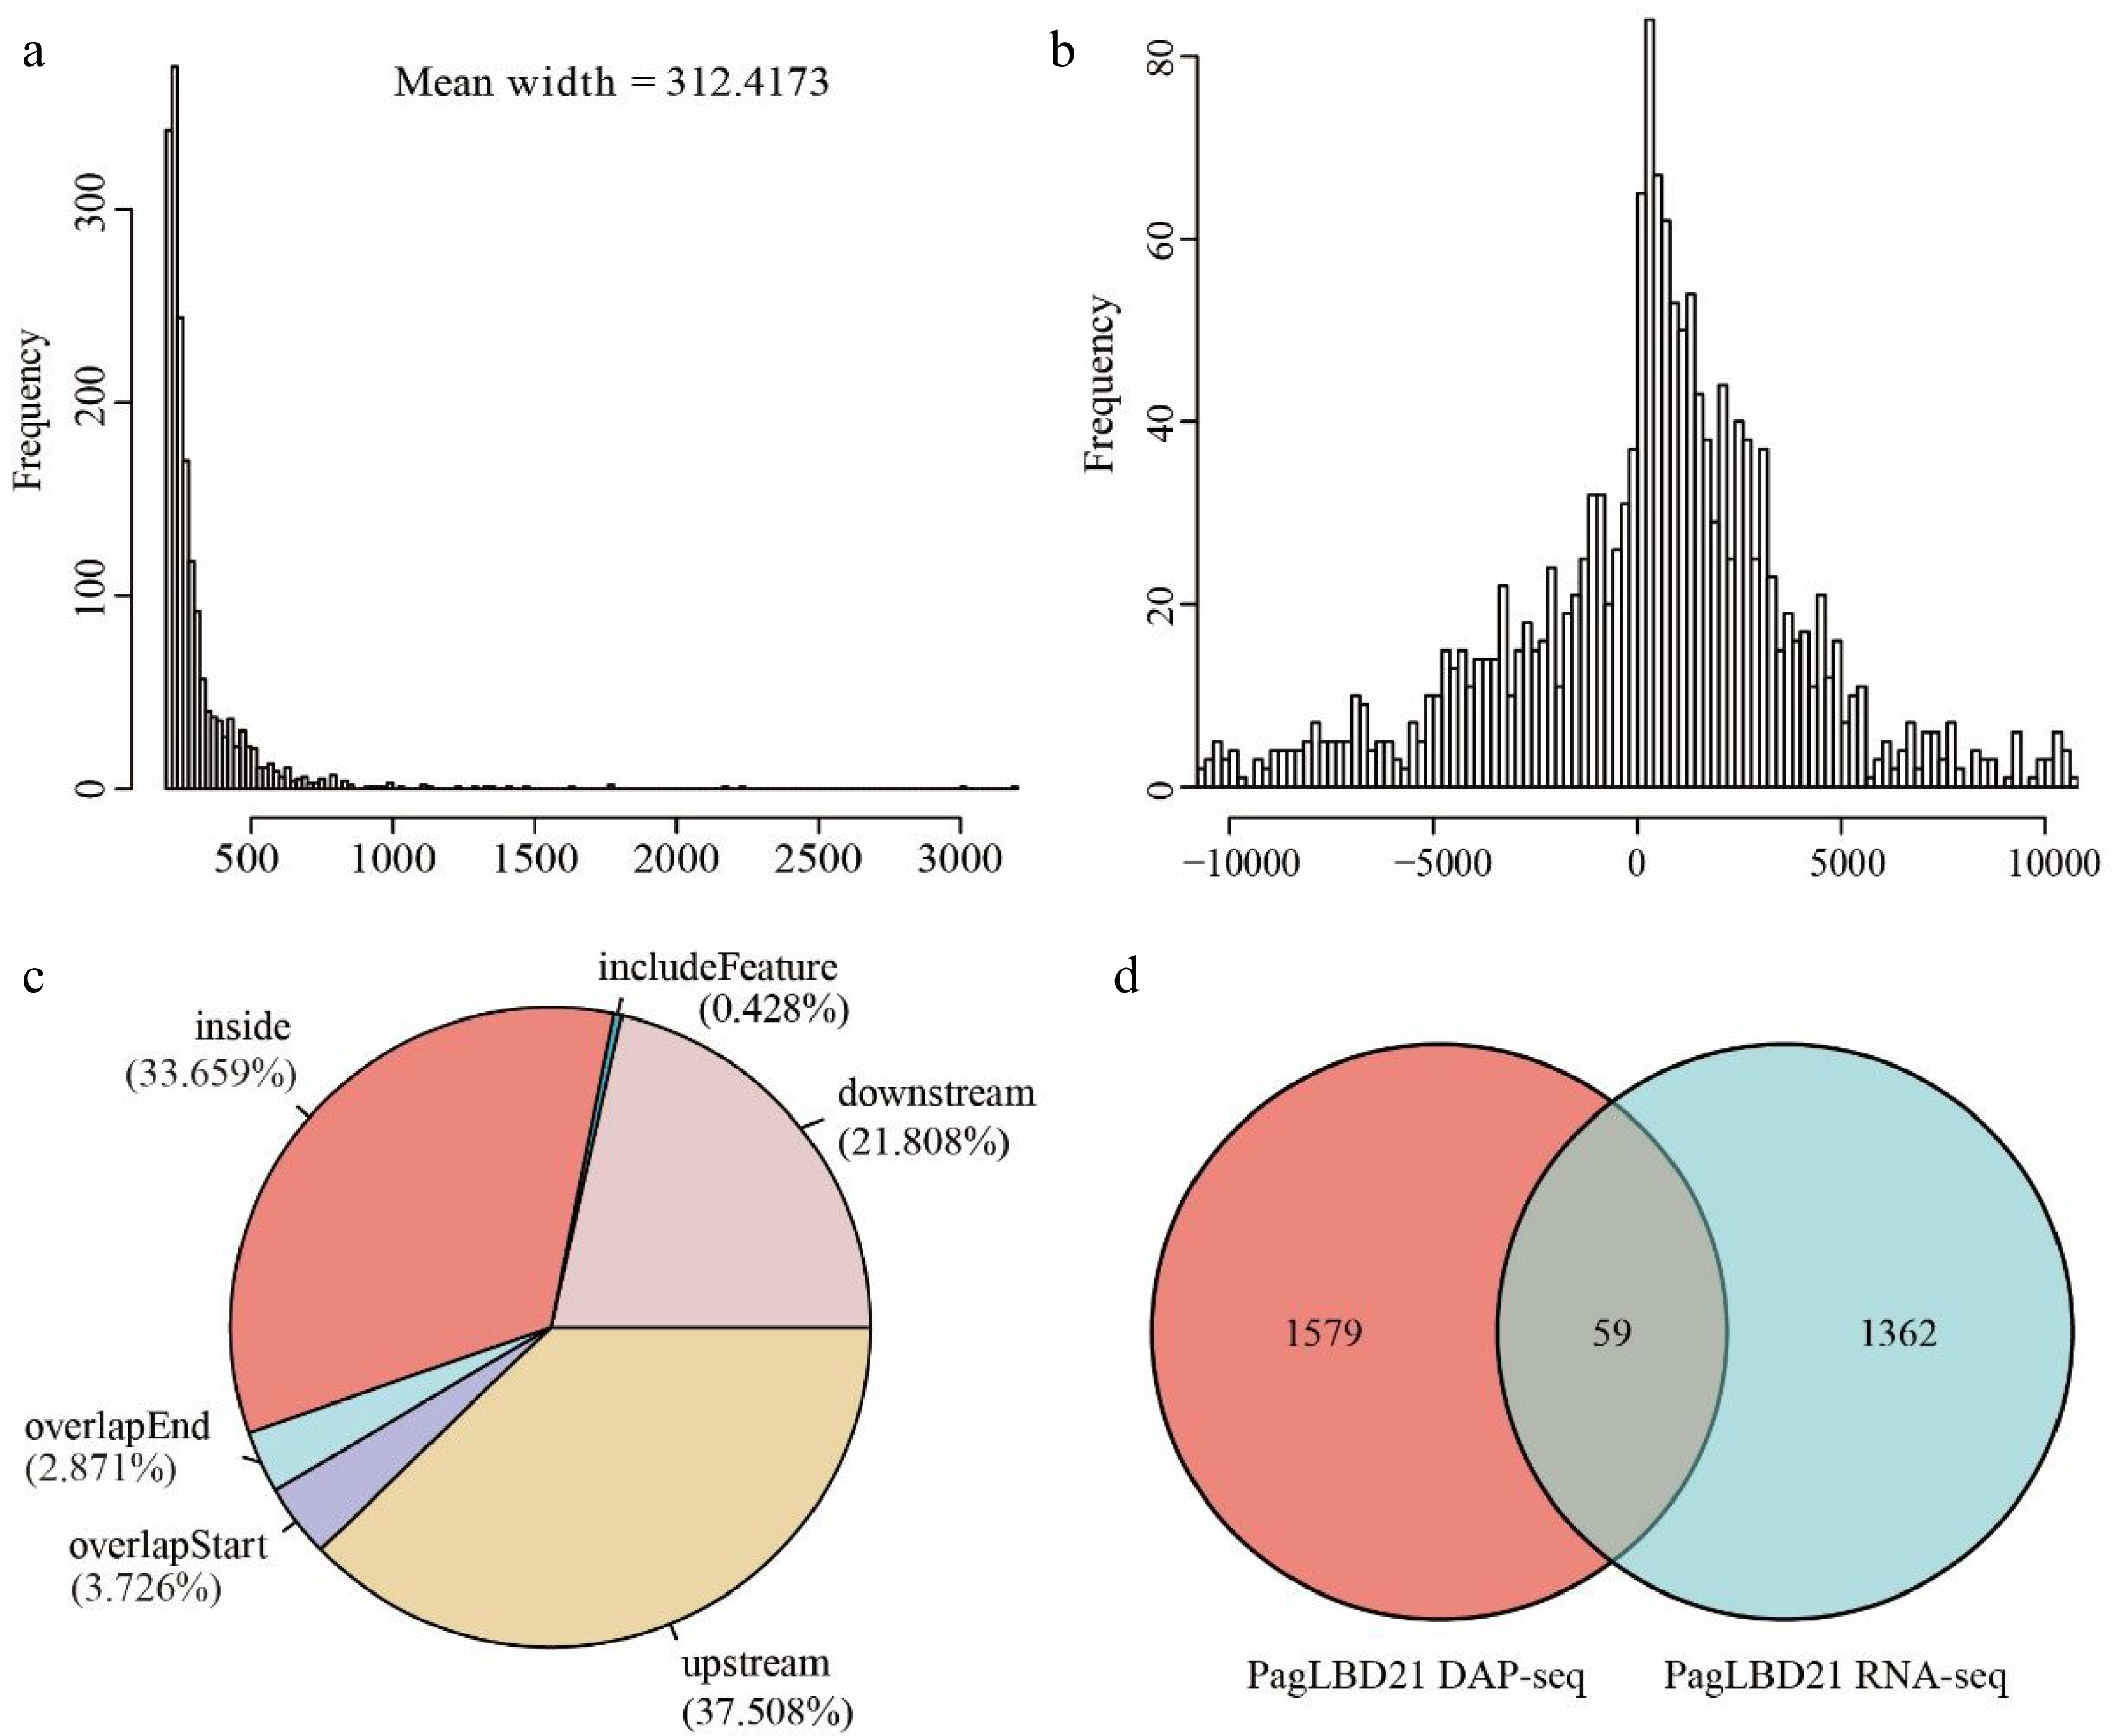
Figure 5.
Analysis of genome-wide targets of PagLBD21 through DAP-seq. (a) The mean width of PagLBD21 binding sites identified in DAP-seq. (b) Genome-wide distribution of PagLBD21 binding sites is centered on gene transcriptional start sites (TSS). (c) The distribution of PagLBD21 binding sites relative to gene features. (d) Venn diagrams of target genes of DAP-seq data (left) and DEGs of RNA-seq data (right) of PagLBD21.
-
LBD21
DAP-seqLBD21
RNA-seqLBD3
DAP-seqLBD3
RNA-seqLBD21 DAP-seq 1,638 − − − LBD21 RNA-seq 59 1,421 − − LBD3 DAP-seq 739 373 7,955 − LBD3 RNA-seq 260 655 1,782 6,468 Table 1.
Overlapping study of DAP-seq and RNA-seq related genes between PagLBD21 and PagLBD3.
Figures
(5)
Tables
(1)