-
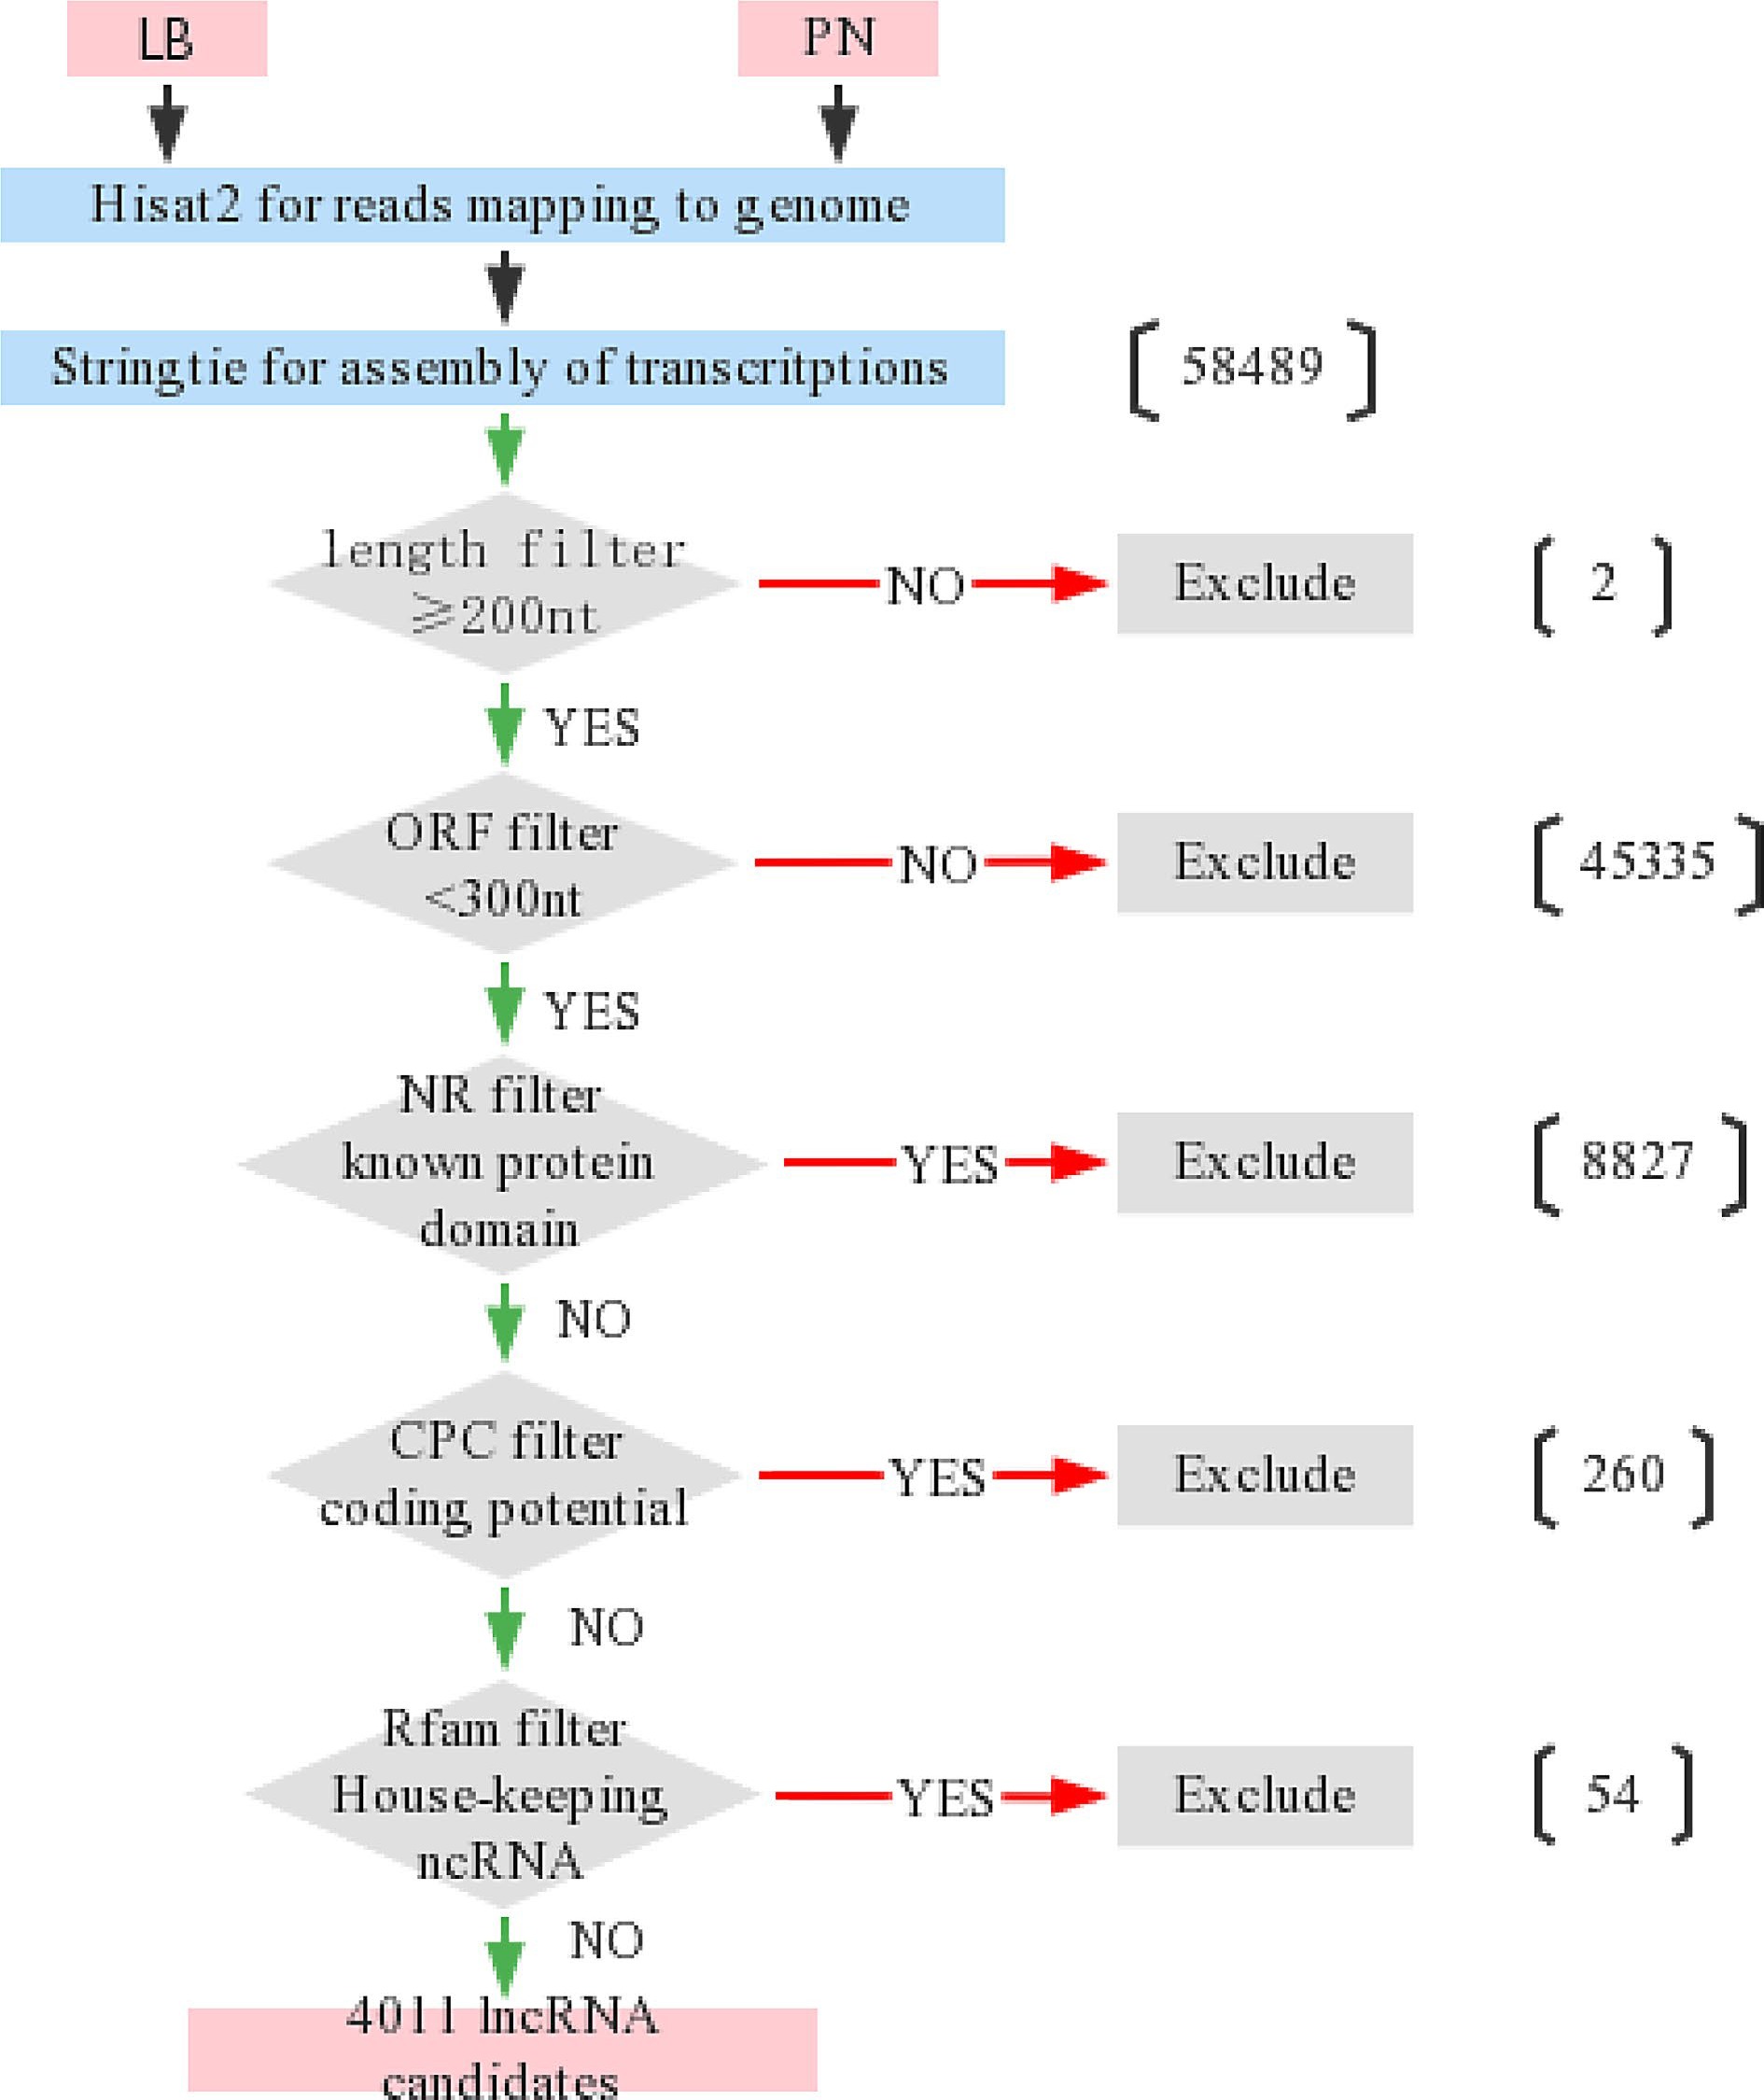
Figure 1.
Process chart of screening lncRNAs candidates from transcriptome sequencing. The transcription reads of the RNA-seq results were compared to the genome by Hisat2, and new transcripts were assembled by Stringtie. Transcripts were filtered with the five criteria for identification of lncRNAs. (1) The sequence length was ≥ 200 nt; (2) ORF < 300; (3) Non encoded conserved protein domains; (4) Little protein coding potential; (5) Not housekeeping RNA.
-
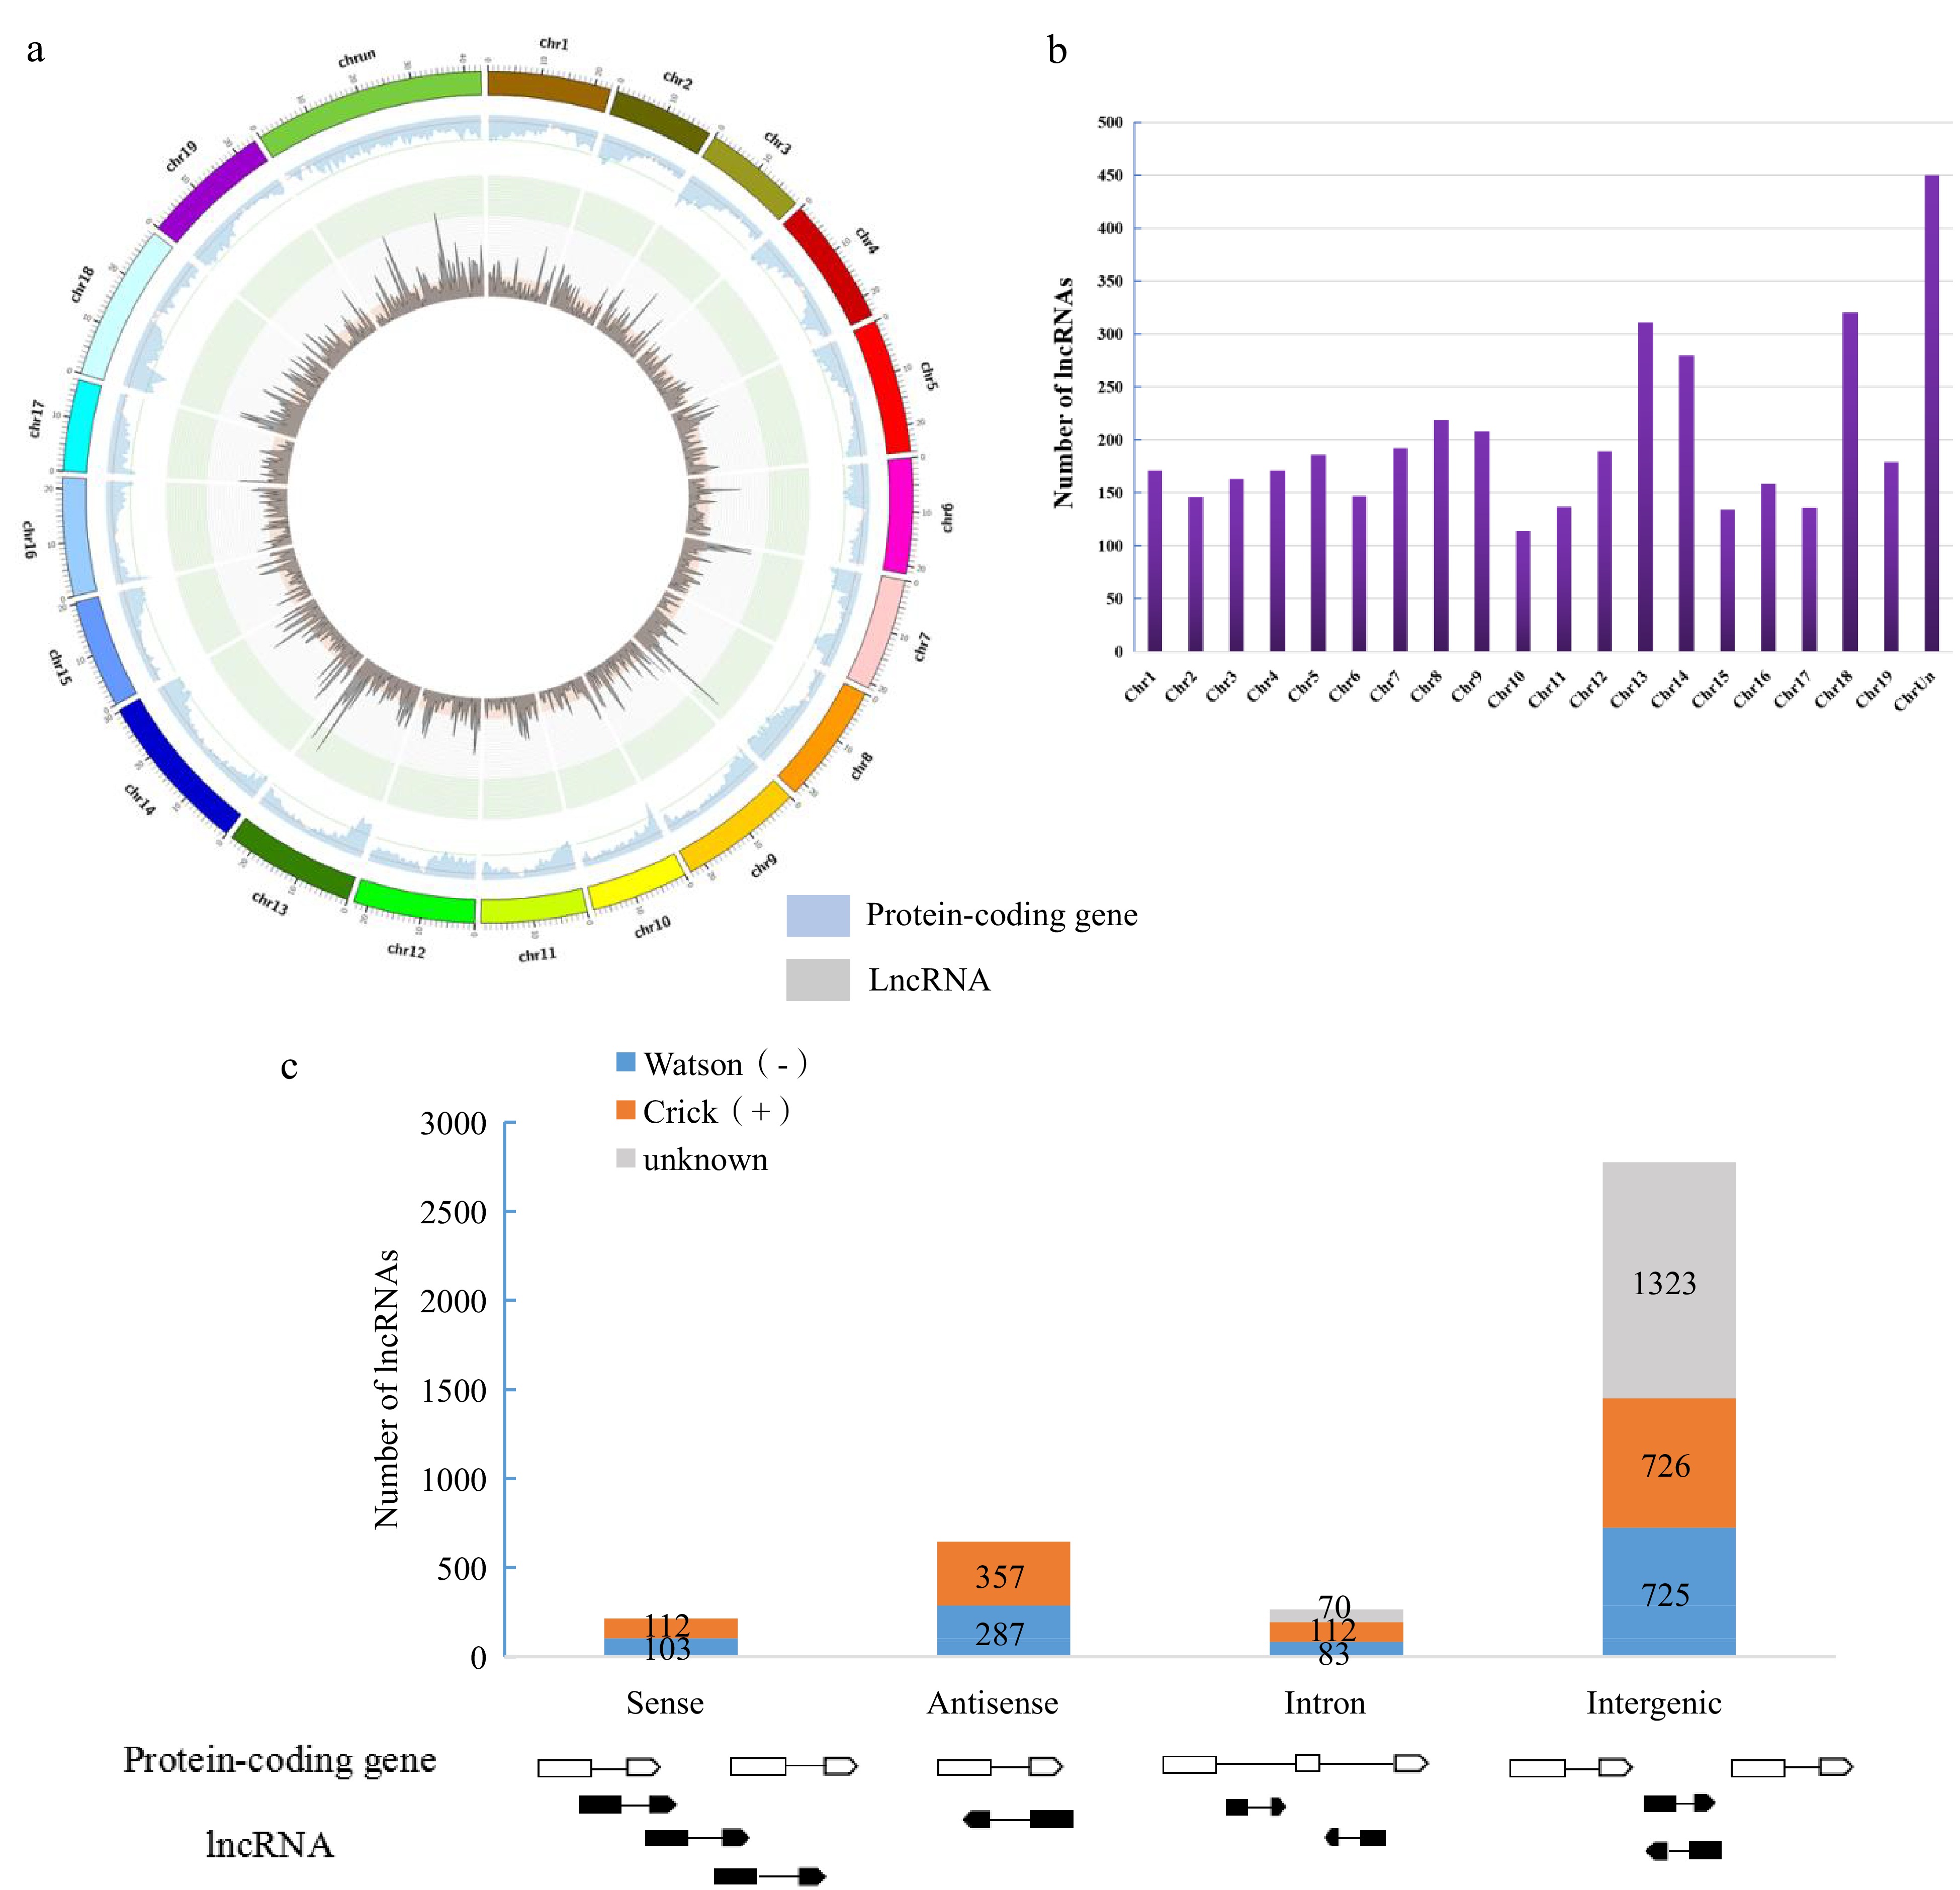
Figure 2.
Characterizations of lncRNAs and protein-coding genes in Liuba-8 and Pinot Noir. (a) Genome-wide distribution of grape lncRNAs compared with that of protein-coding genes (RNA-seq). Chromosomes are shown with different colours and in a circular form as the outer thick track. The inner chromosome scale (Mb) is labelled on each chromosome. For the inner two tracks, the abundance of lncRNAs and protein-coding genes in physical bins of 0.5 Mb for each chromosome are shown by blue and grey columns, respectively. (b) The number of lncRNAs on each chromosome. (c) Classification of grape lncRNAs according to its genomic position and overlap with protein-coding genes.
-

Figure 3.
The length and exons of lncRNAs and protein-coding transcripts. The distribution of (a) length and (b) numbers of exons of lncRNAs in comparison with protein-coding transcripts of grape (Vvinifera_145_Genoscope.12X.gene).
-
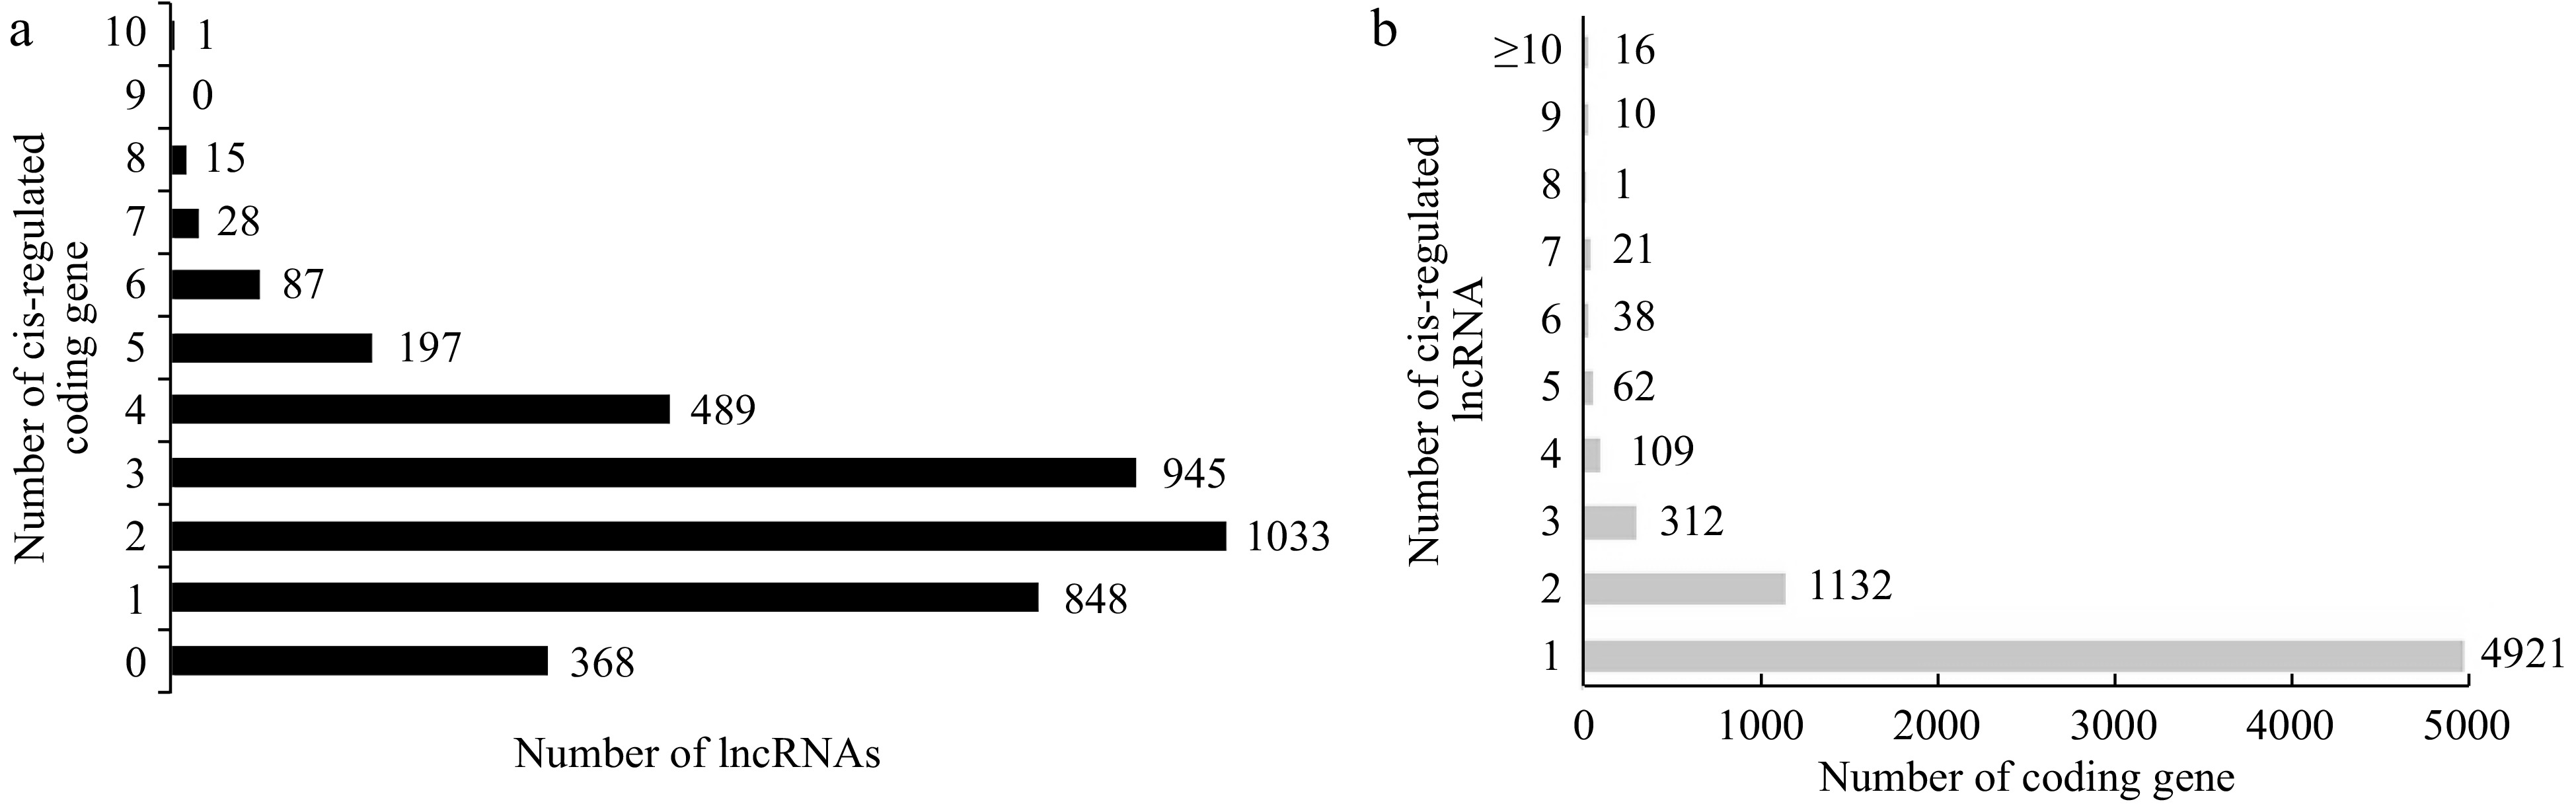
Figure 4.
LncRNAs and their cis-regulated target protein-coding genes in Liuba-8 and Pinot Noir. (a) The number of target protein-coding genes cis-regulated by lncRNAs. (b) The number of lncRNAs that have potential cis-regulatory effects on protein-coding genes
-
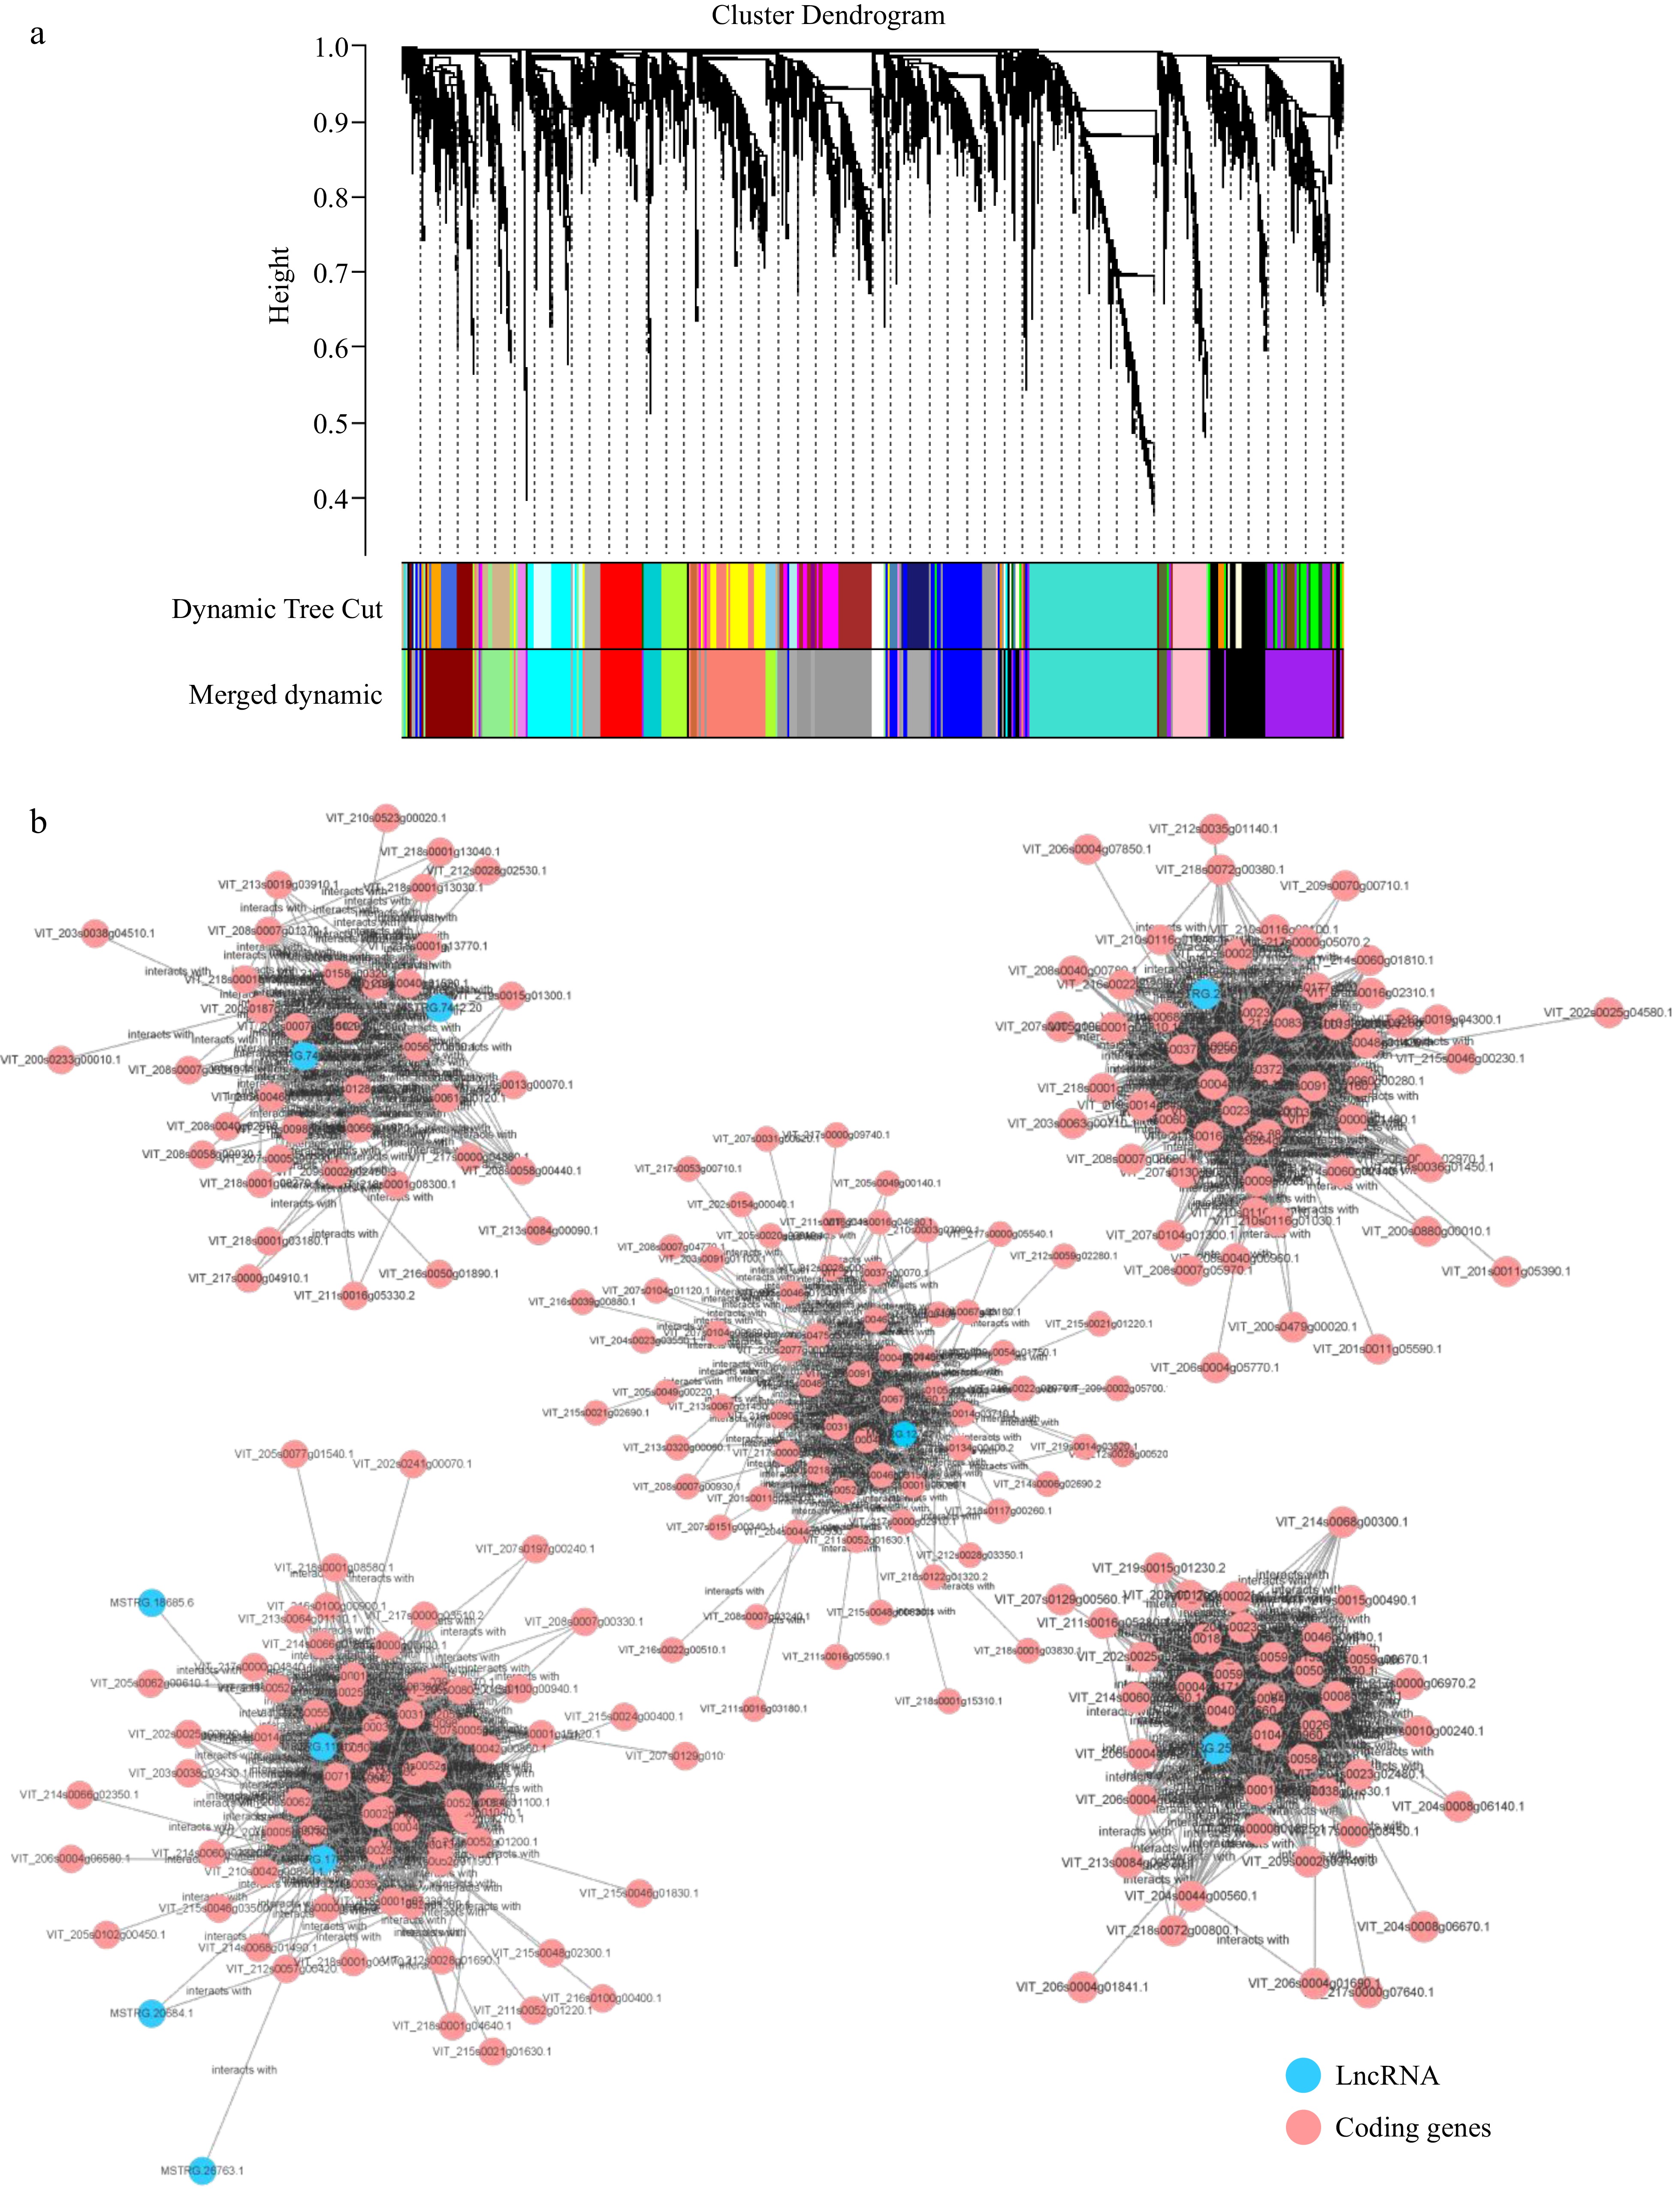
Figure 5.
WGCNA of differentially expressed lncRNAs and its trans target genes. (a) Cluster Dendrogram of the DElncRNA and mRNA. (b) The network construction of lncRNAs and its trans-target genes.
-
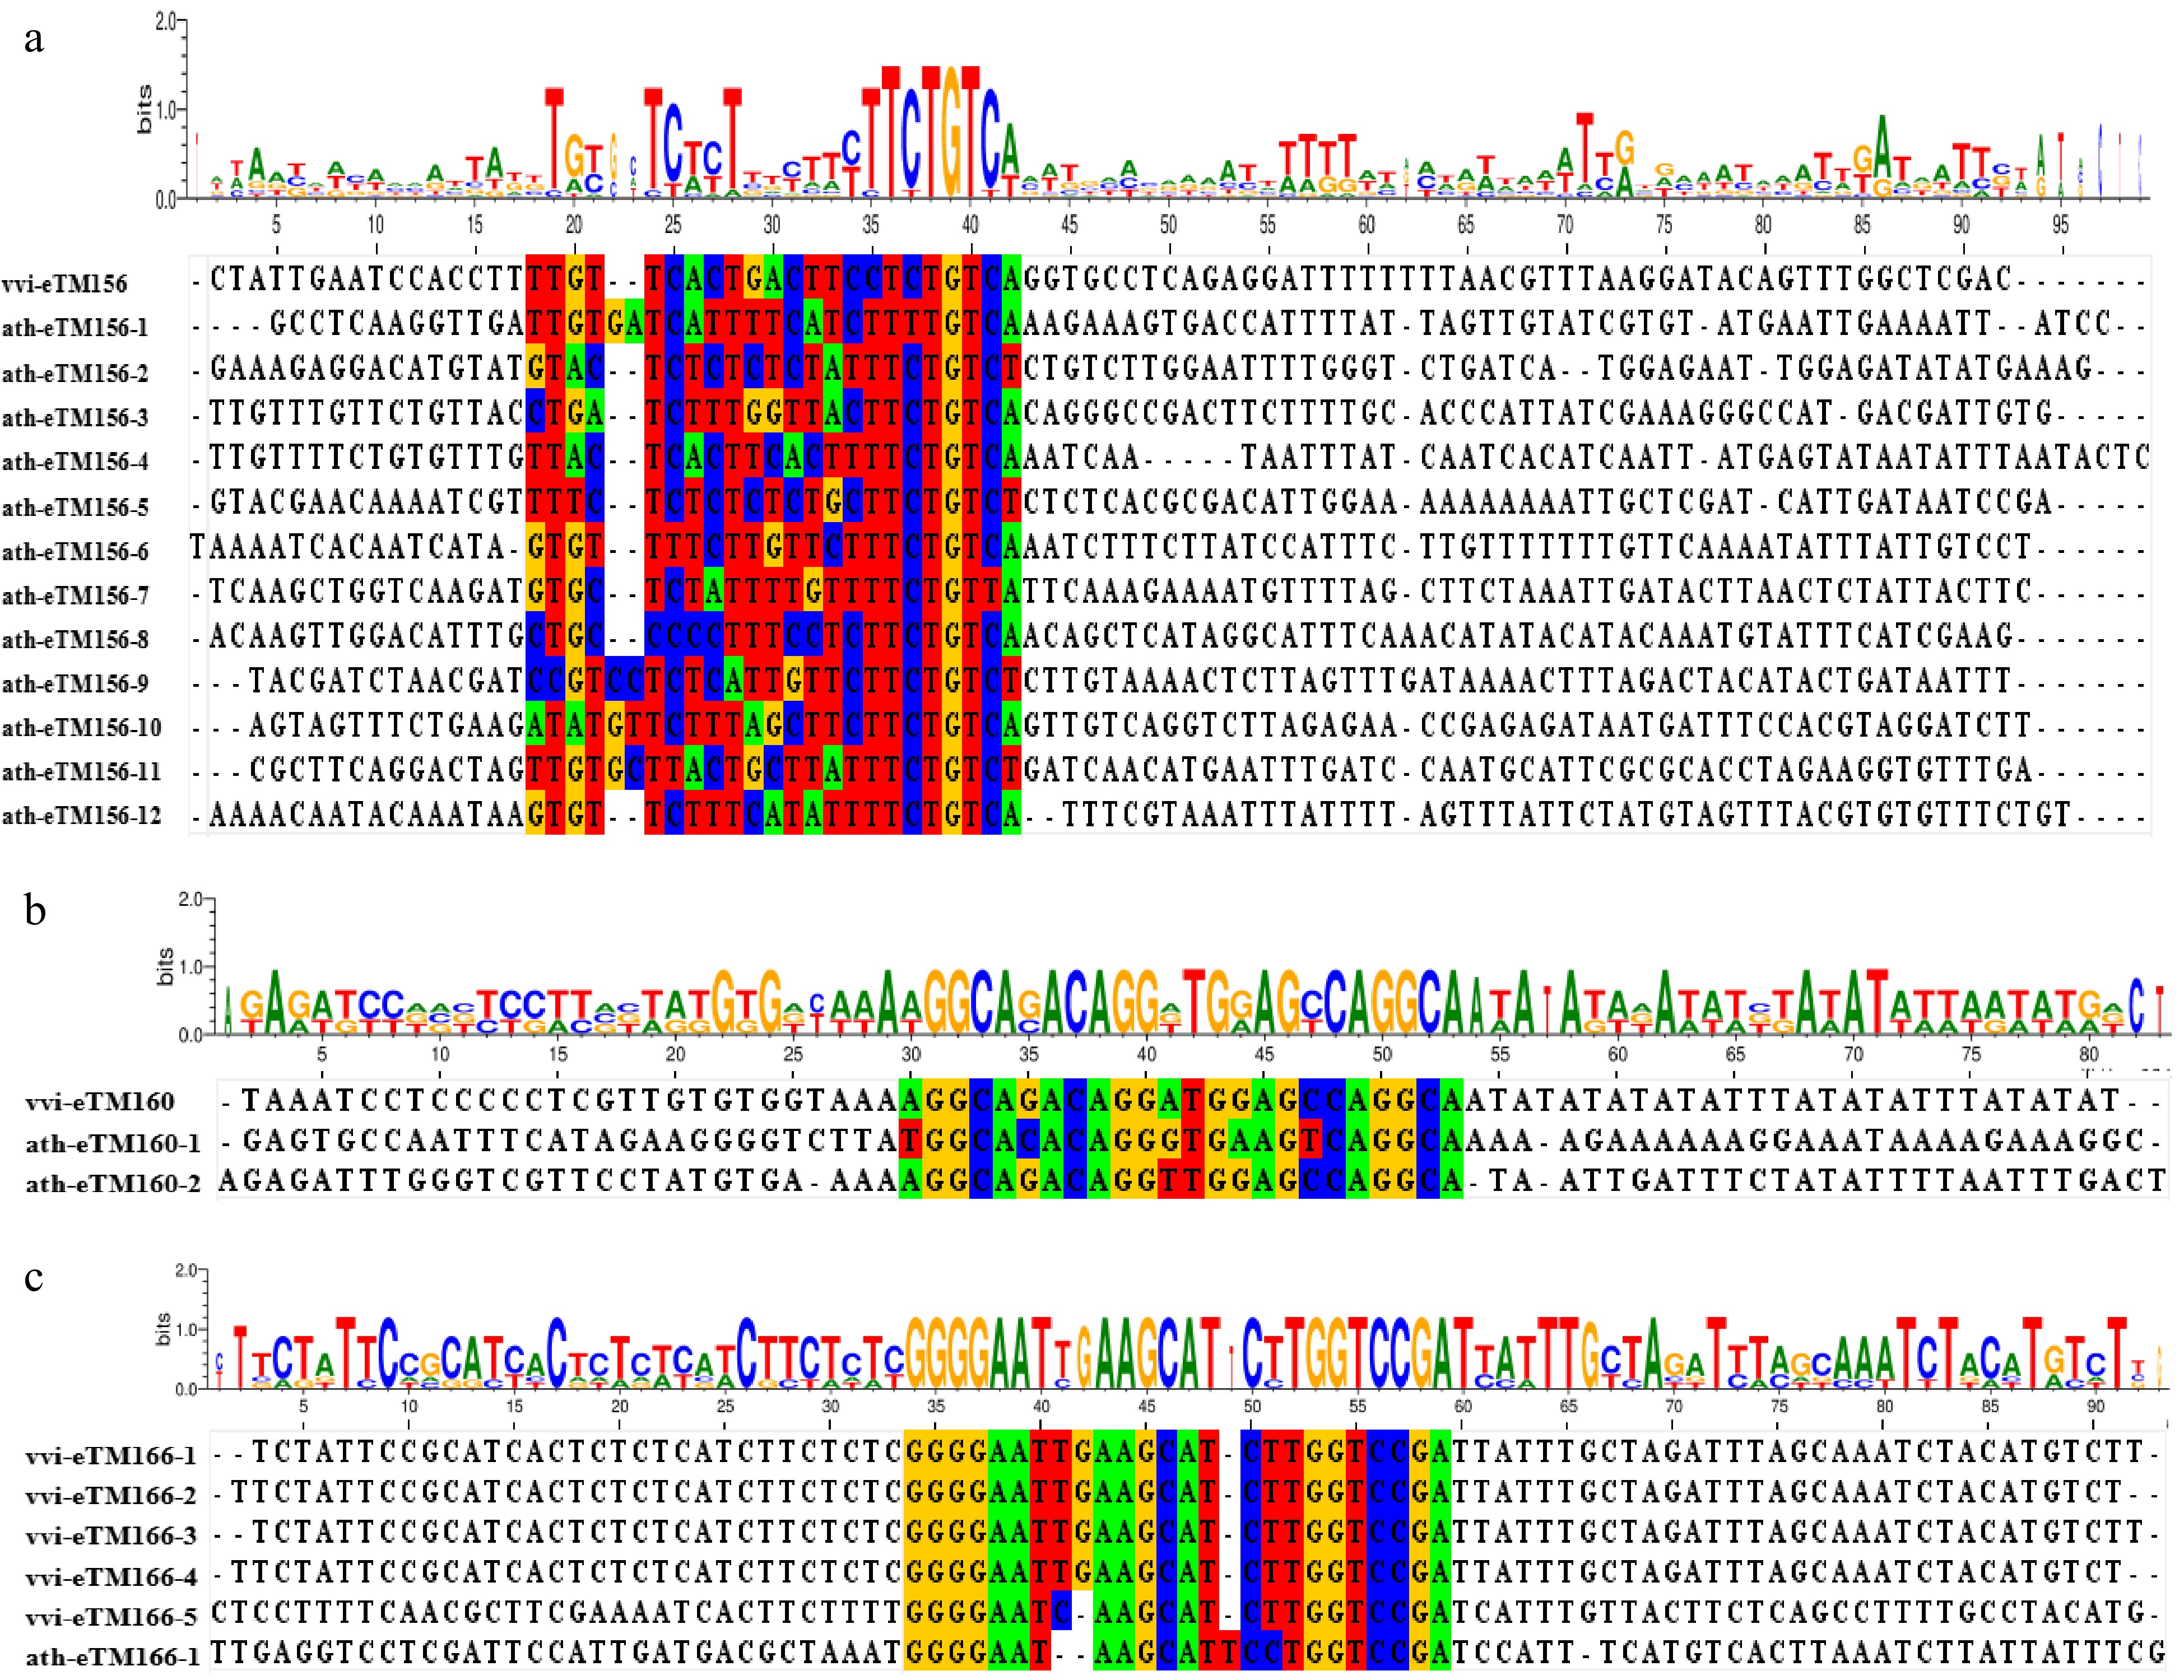
Figure 6.
Syntenic analysis of eTM156s, eTM160s,and eTM166s between V. vinifera and A. thaliana. (a) Sequence alignment of eTMs for miR156 (eTM156s). The bases with a colored background are the sequences paired to miR156. (b) Sequence alignment of eTMs for miR160 (eTM160s). The bases with a colored background are the sequences paired to miR160. (c) Sequence alignment of eTMs for miR166 (eTM166s). The bases with a colored background are the sequences paired to miR166.
-
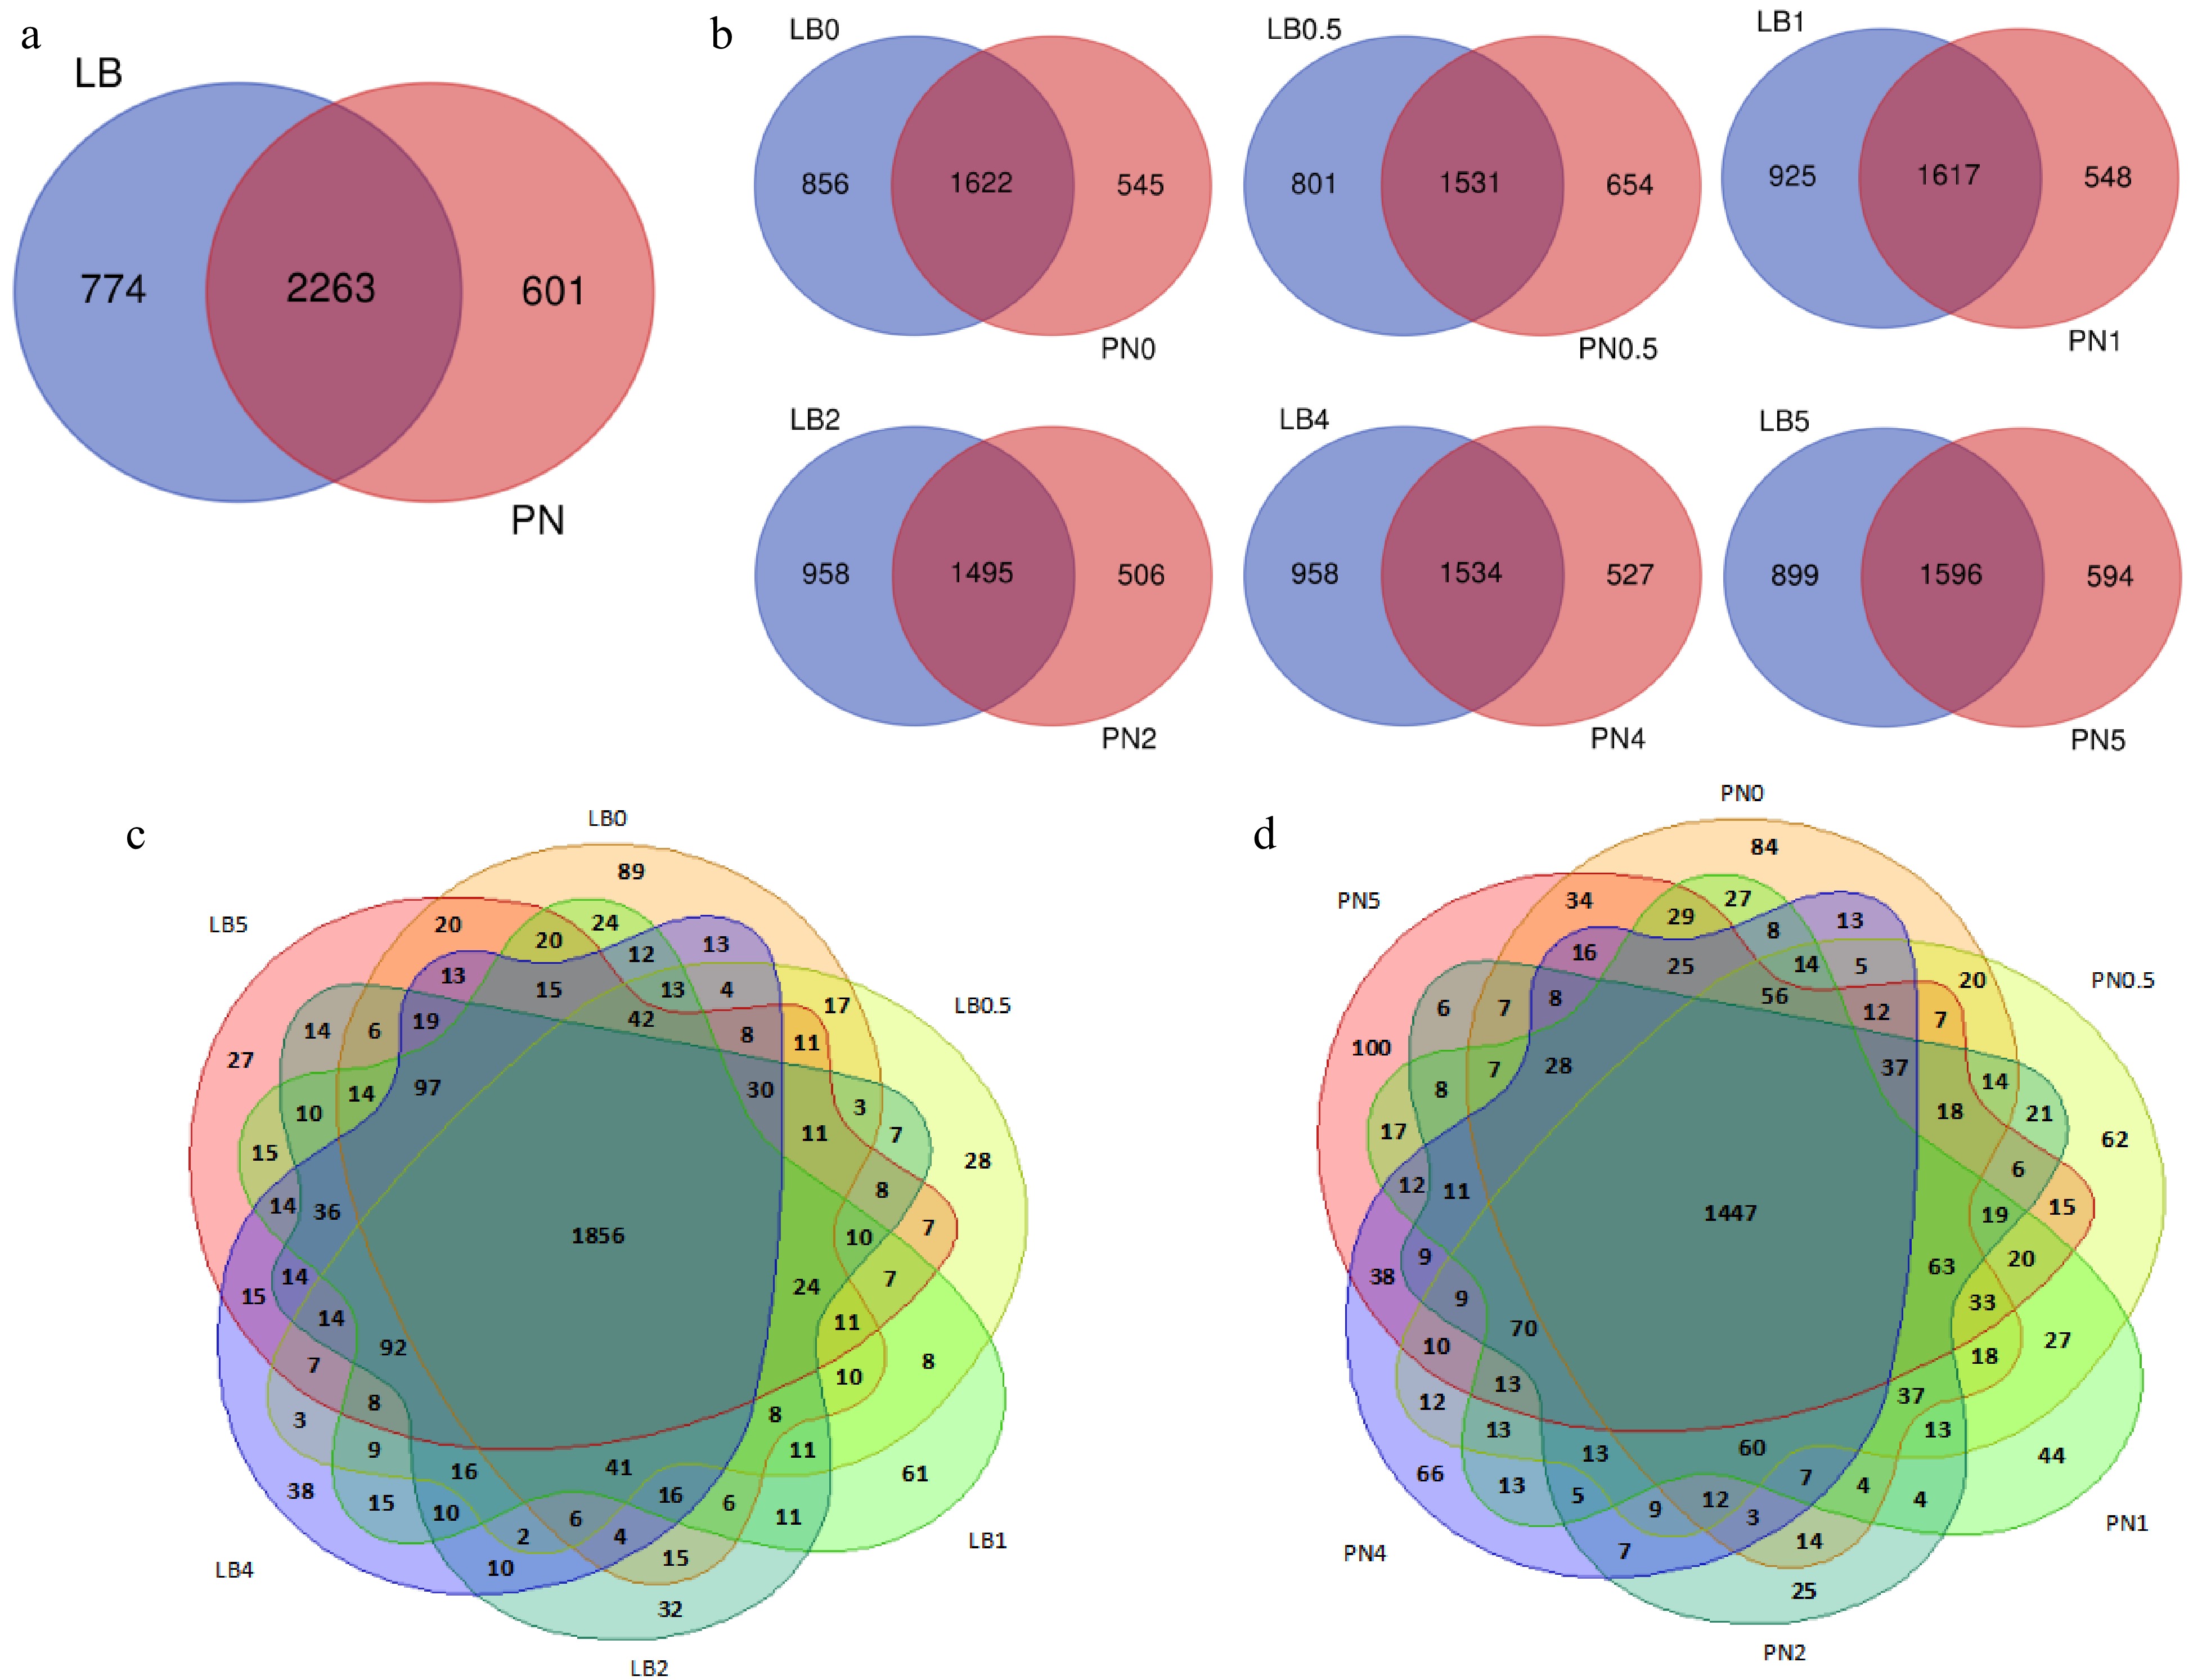
Figure 7.
The expression of lncRNAs in grape. (a) Co-expression of lncRNAs in leaves of Liuba-8 and Pinot Noir after inoculation with downy mildew. (b) The expression difference of lncRNAs in leaves of Liuba-8 and Pinot Noir inoculated with downy mildew at the same period. (c) A summary of the number of lncRNAs expressed in different stages of Liuba-8 inoculated with downy mildew. (d) A summary of the number of lncRNAs expressed in different stages of Pinot Noir inoculated with downy mildew.
-
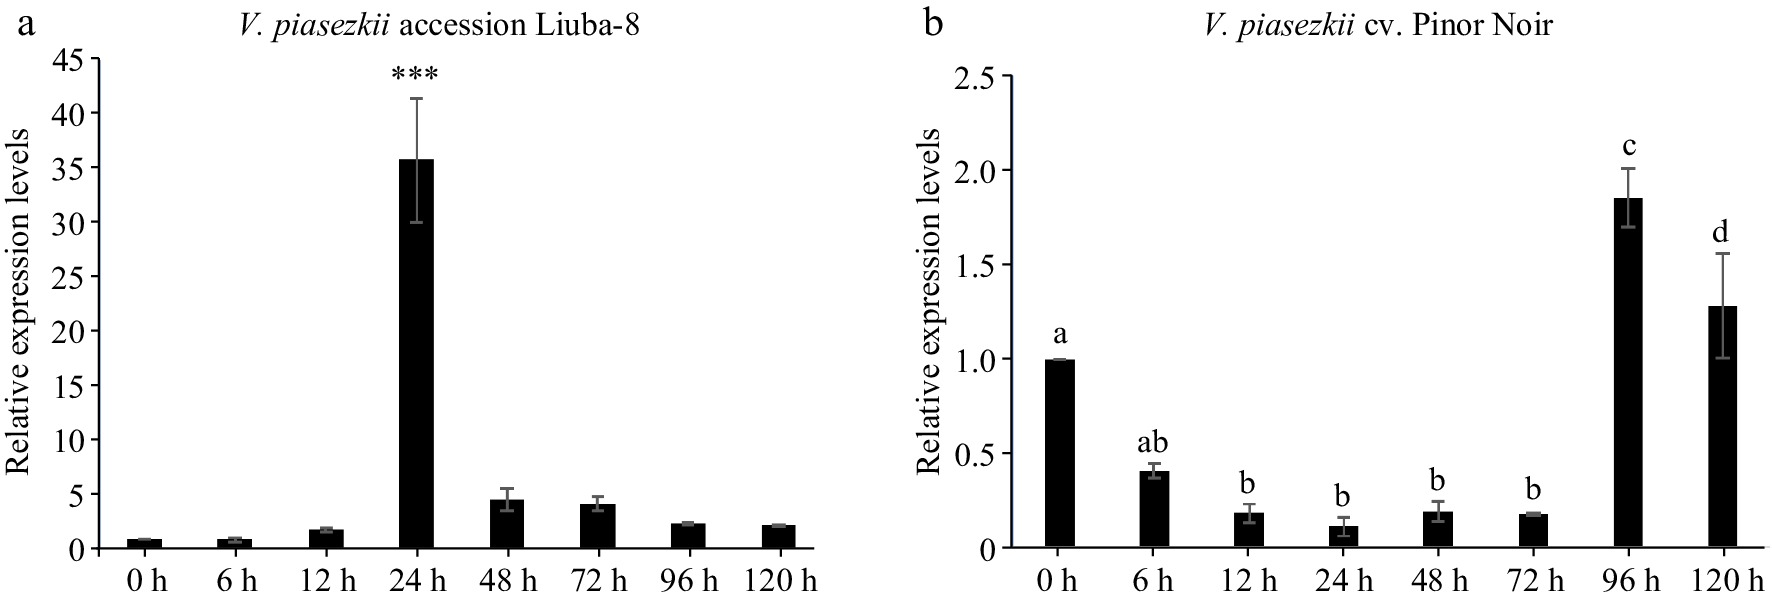
Figure 8.
Expression pattern of MSTRG.12742.1 in V. piasezkii accession Liuba-8 and V. vinifera cv. Pinot Noir. Expression pattern of MSTRG.12742.1 at 0, 6, 12, 24, 48, 72, 96 and 120 hpi in (a) V. piasezkii accession Liuba-8 and (b) V. vinifera cv. Pinot Noir.
-
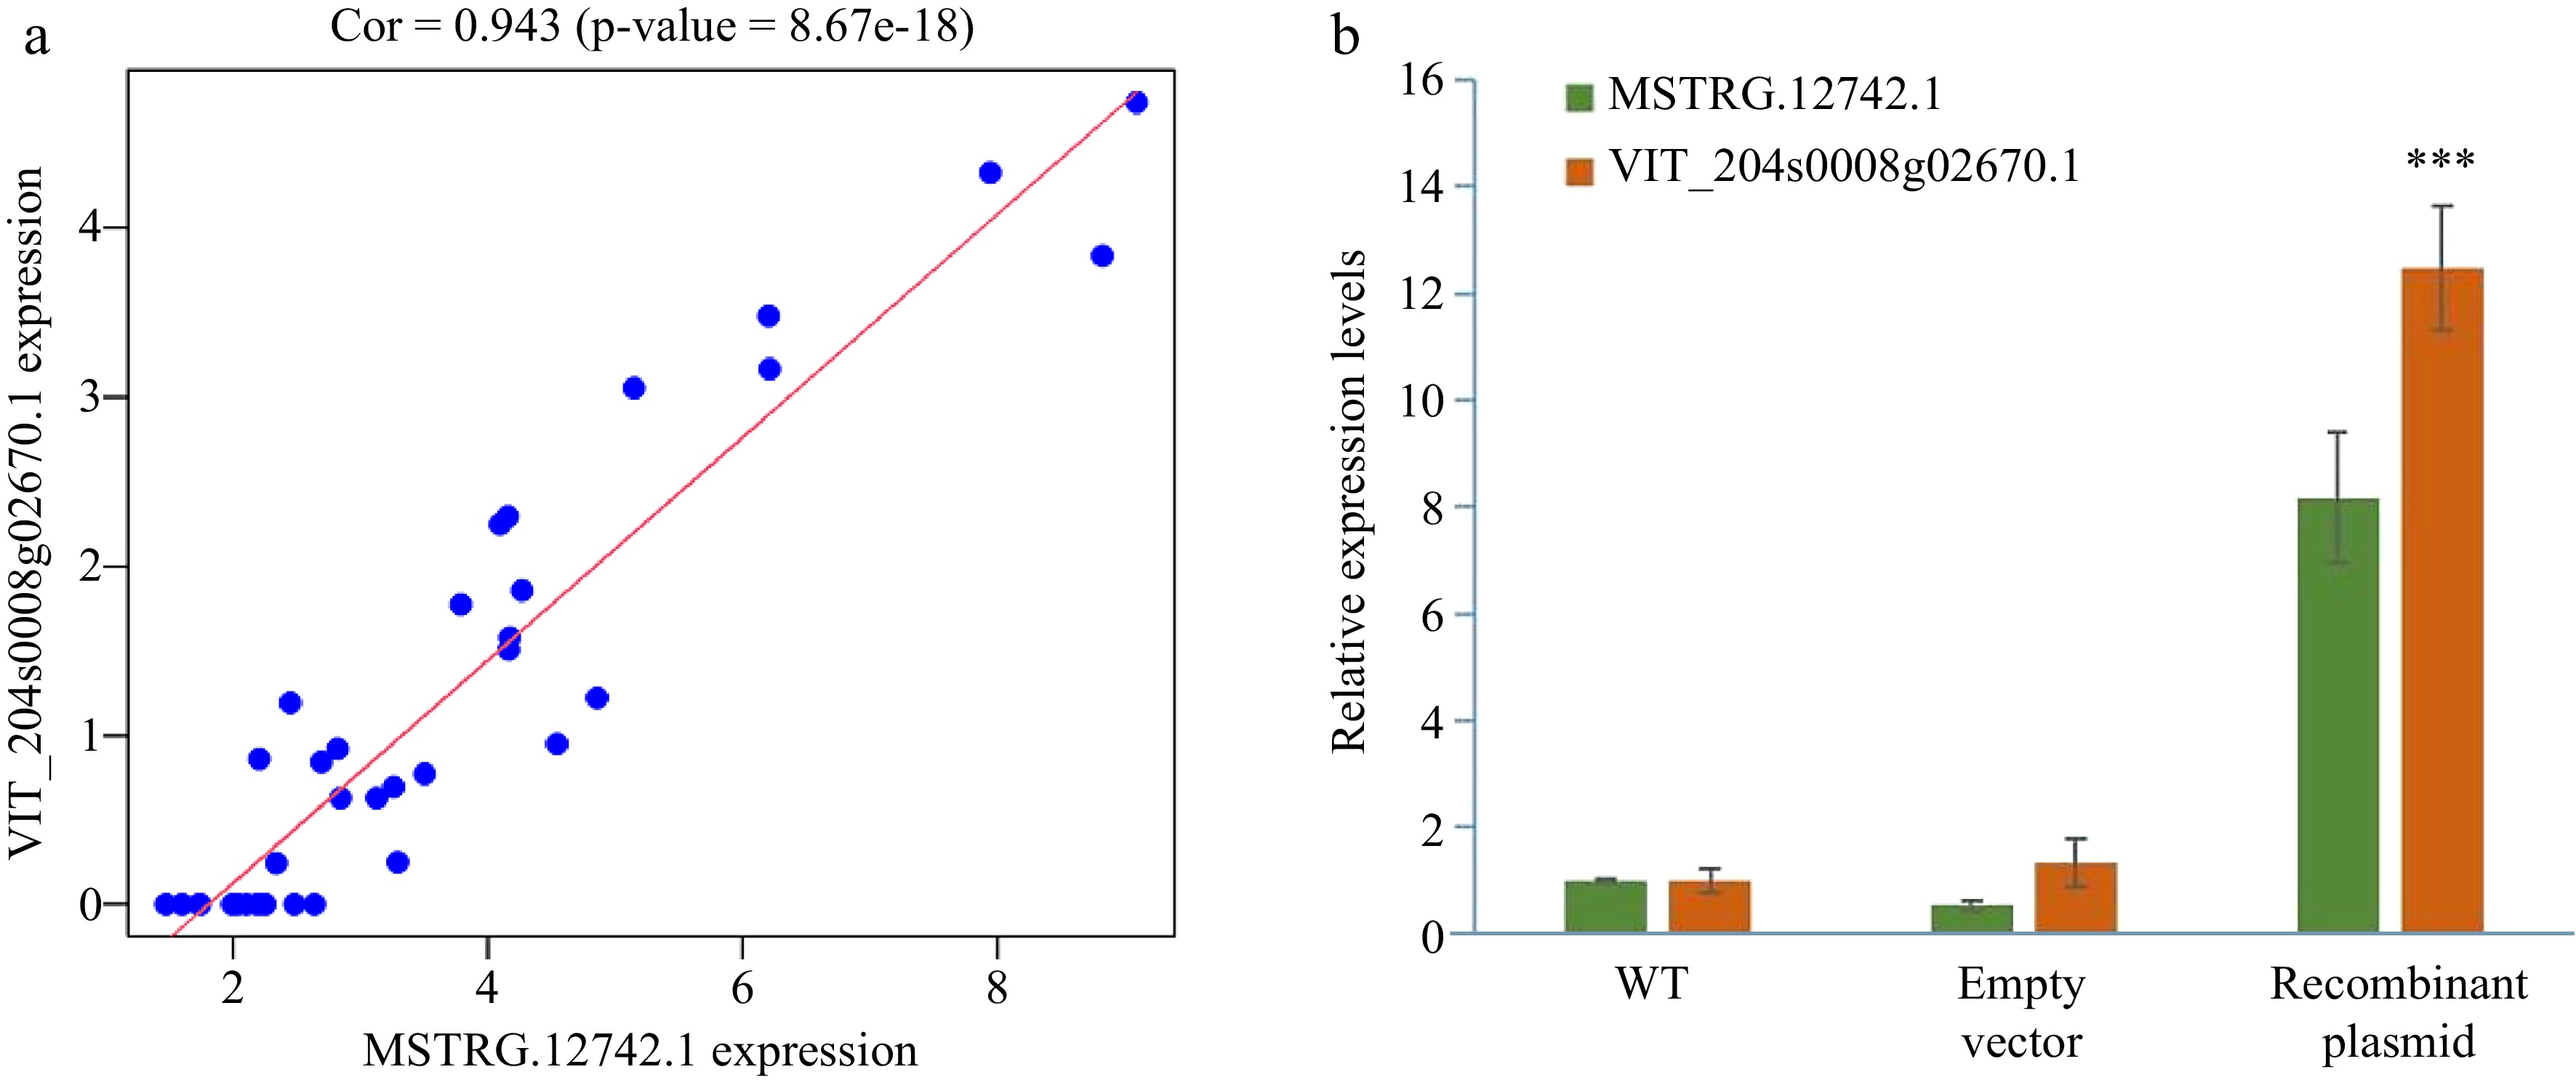
Figure 9.
The verification of MSTRG.12742.1 and its predicted target gene VIT_204s0008g02671.1. (a) The Pearson correlation coefficient of the expression of MSTRG.12742.1 and VIT_204s0008g02671.1. (b) MSTRG.12742.1 and predicted target genes expression after instantaneous transformation of Vitis vinifera cv. Pinot Noir leaves.
-
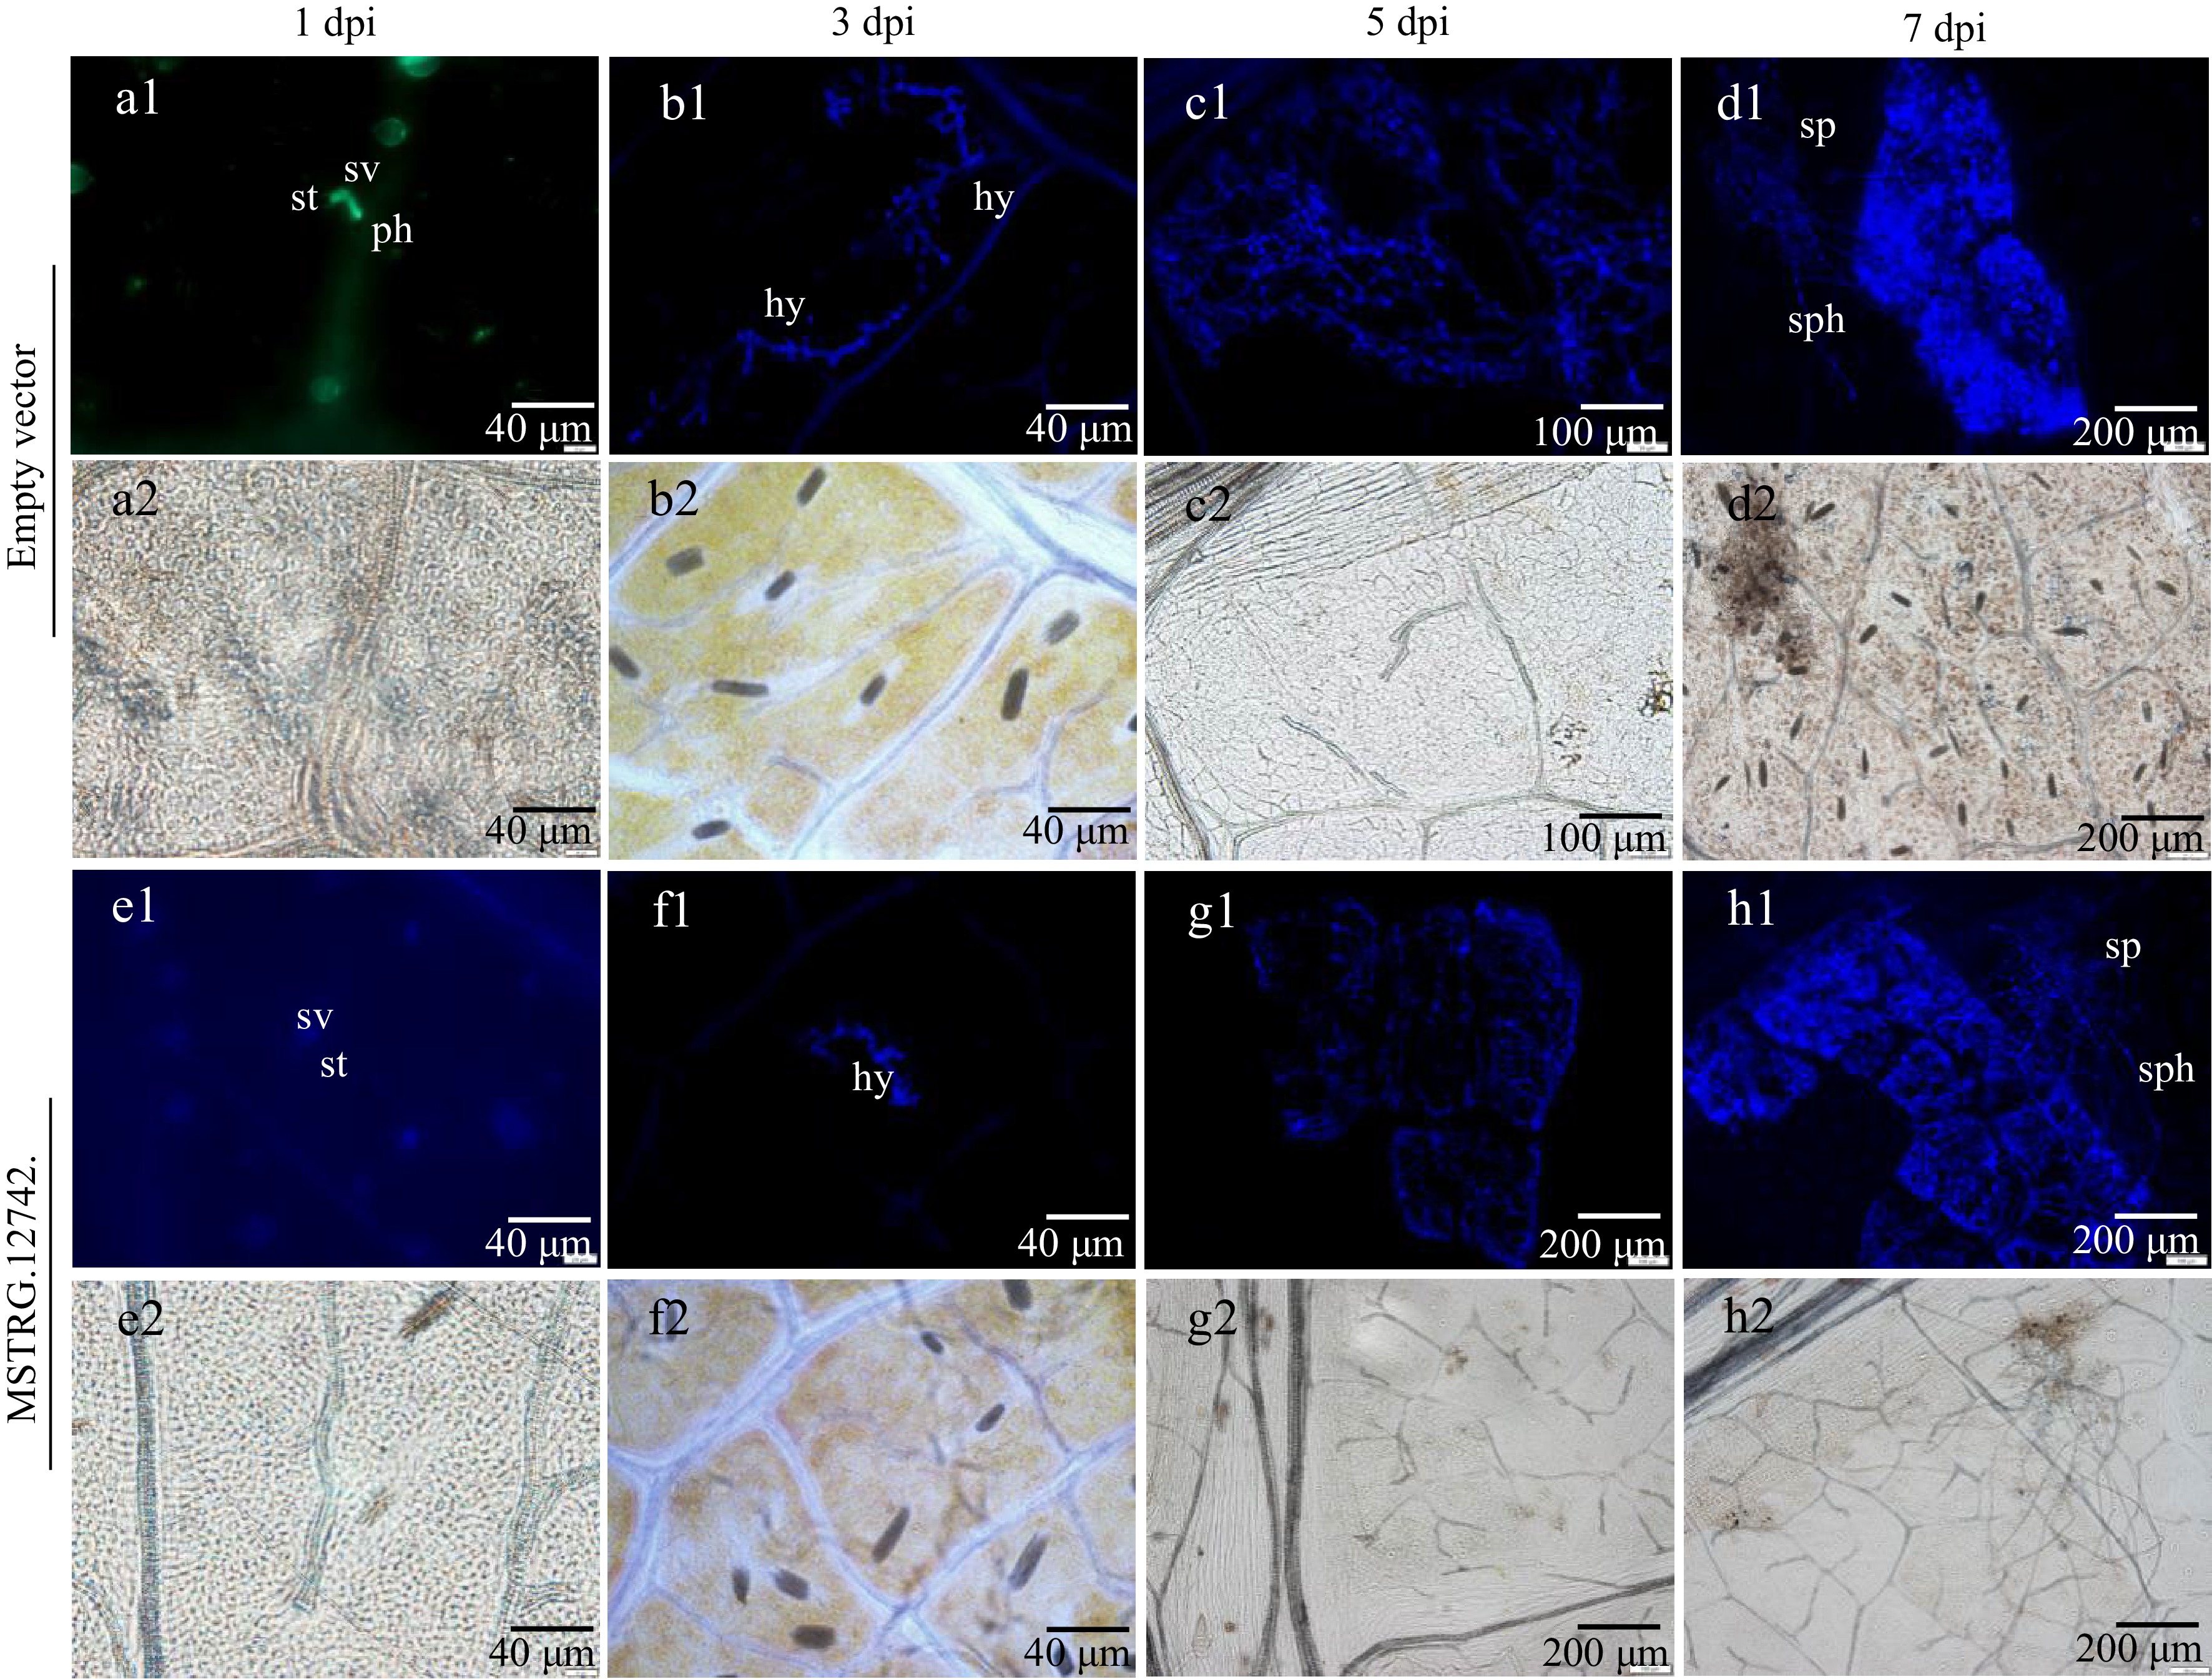
Figure 10.
P. viticola development in leaf discs of transient expression of MSTRG.12742.1 and empty vector as revealed by staining with aniline blue. (a1)−(h1) is stained with aniline blue under epifluorenscense UV-microscopy. (a2)−(h2) is under bright-field illumination in the field of vision corresponding to (a1)−(h1). St stomata, sv substomatal vesicle, ph primary hyphae, hy hyphae, sph sporangiophores, sp sporangia
-
lncRNAs Sequences miRNA MSTRG.14598.2 
vvi-miR156e MSTRG.13285.1 
vvi-miR160c MSTRG.13285.1 
vvi-miR160d MSTRG.13285.1 
vvi-miR160e Table 1.
lncRNAs are acting as endogenous target mimics (eTMs) of miRNAs (miRNA156, miRNA160) in Vitis vinifera.
-
FPKM LB0 LB0.5 LB1 LB2 LB4 LB5 PN0 PN0.5 PN1 PN2 PN4 PN5 0 1078 1135 1022 1097 1045 1082 1289 1301 1258 1446 1331 1291 0−0.1 455 544 447 461 474 434 555 525 588 564 619 530 0.1−1 1584 1614 1602 1609 1592 1647 1405 1350 1373 1344 1392 1449 ≥ 1 894 718 940 844 900 848 762 835 792 657 669 741 Table 2.
The distribution number of lncRNAs according to FPKM value in each interval in each stage after grape leaf inoculation with downy mildew. Each FPKM the average of three biological replicates.
-
Sample LB0 LB0.5 LB1 LB2 LB4 LB5 PN0 PN0.5 PN1 PN2 PN4 PN5 Expression 2478 2332 2542 2453 2492 2495 2167 2185 2165 2001 2061 2190 Specific expression 27 9 15 6 4 9 10 12 6 8 22 25 Table 3.
The number of lncRNAs expressed and specific expressed in each period of grape leaf inoculation with downy mildew.
Figures
(10)
Tables
(3)