-
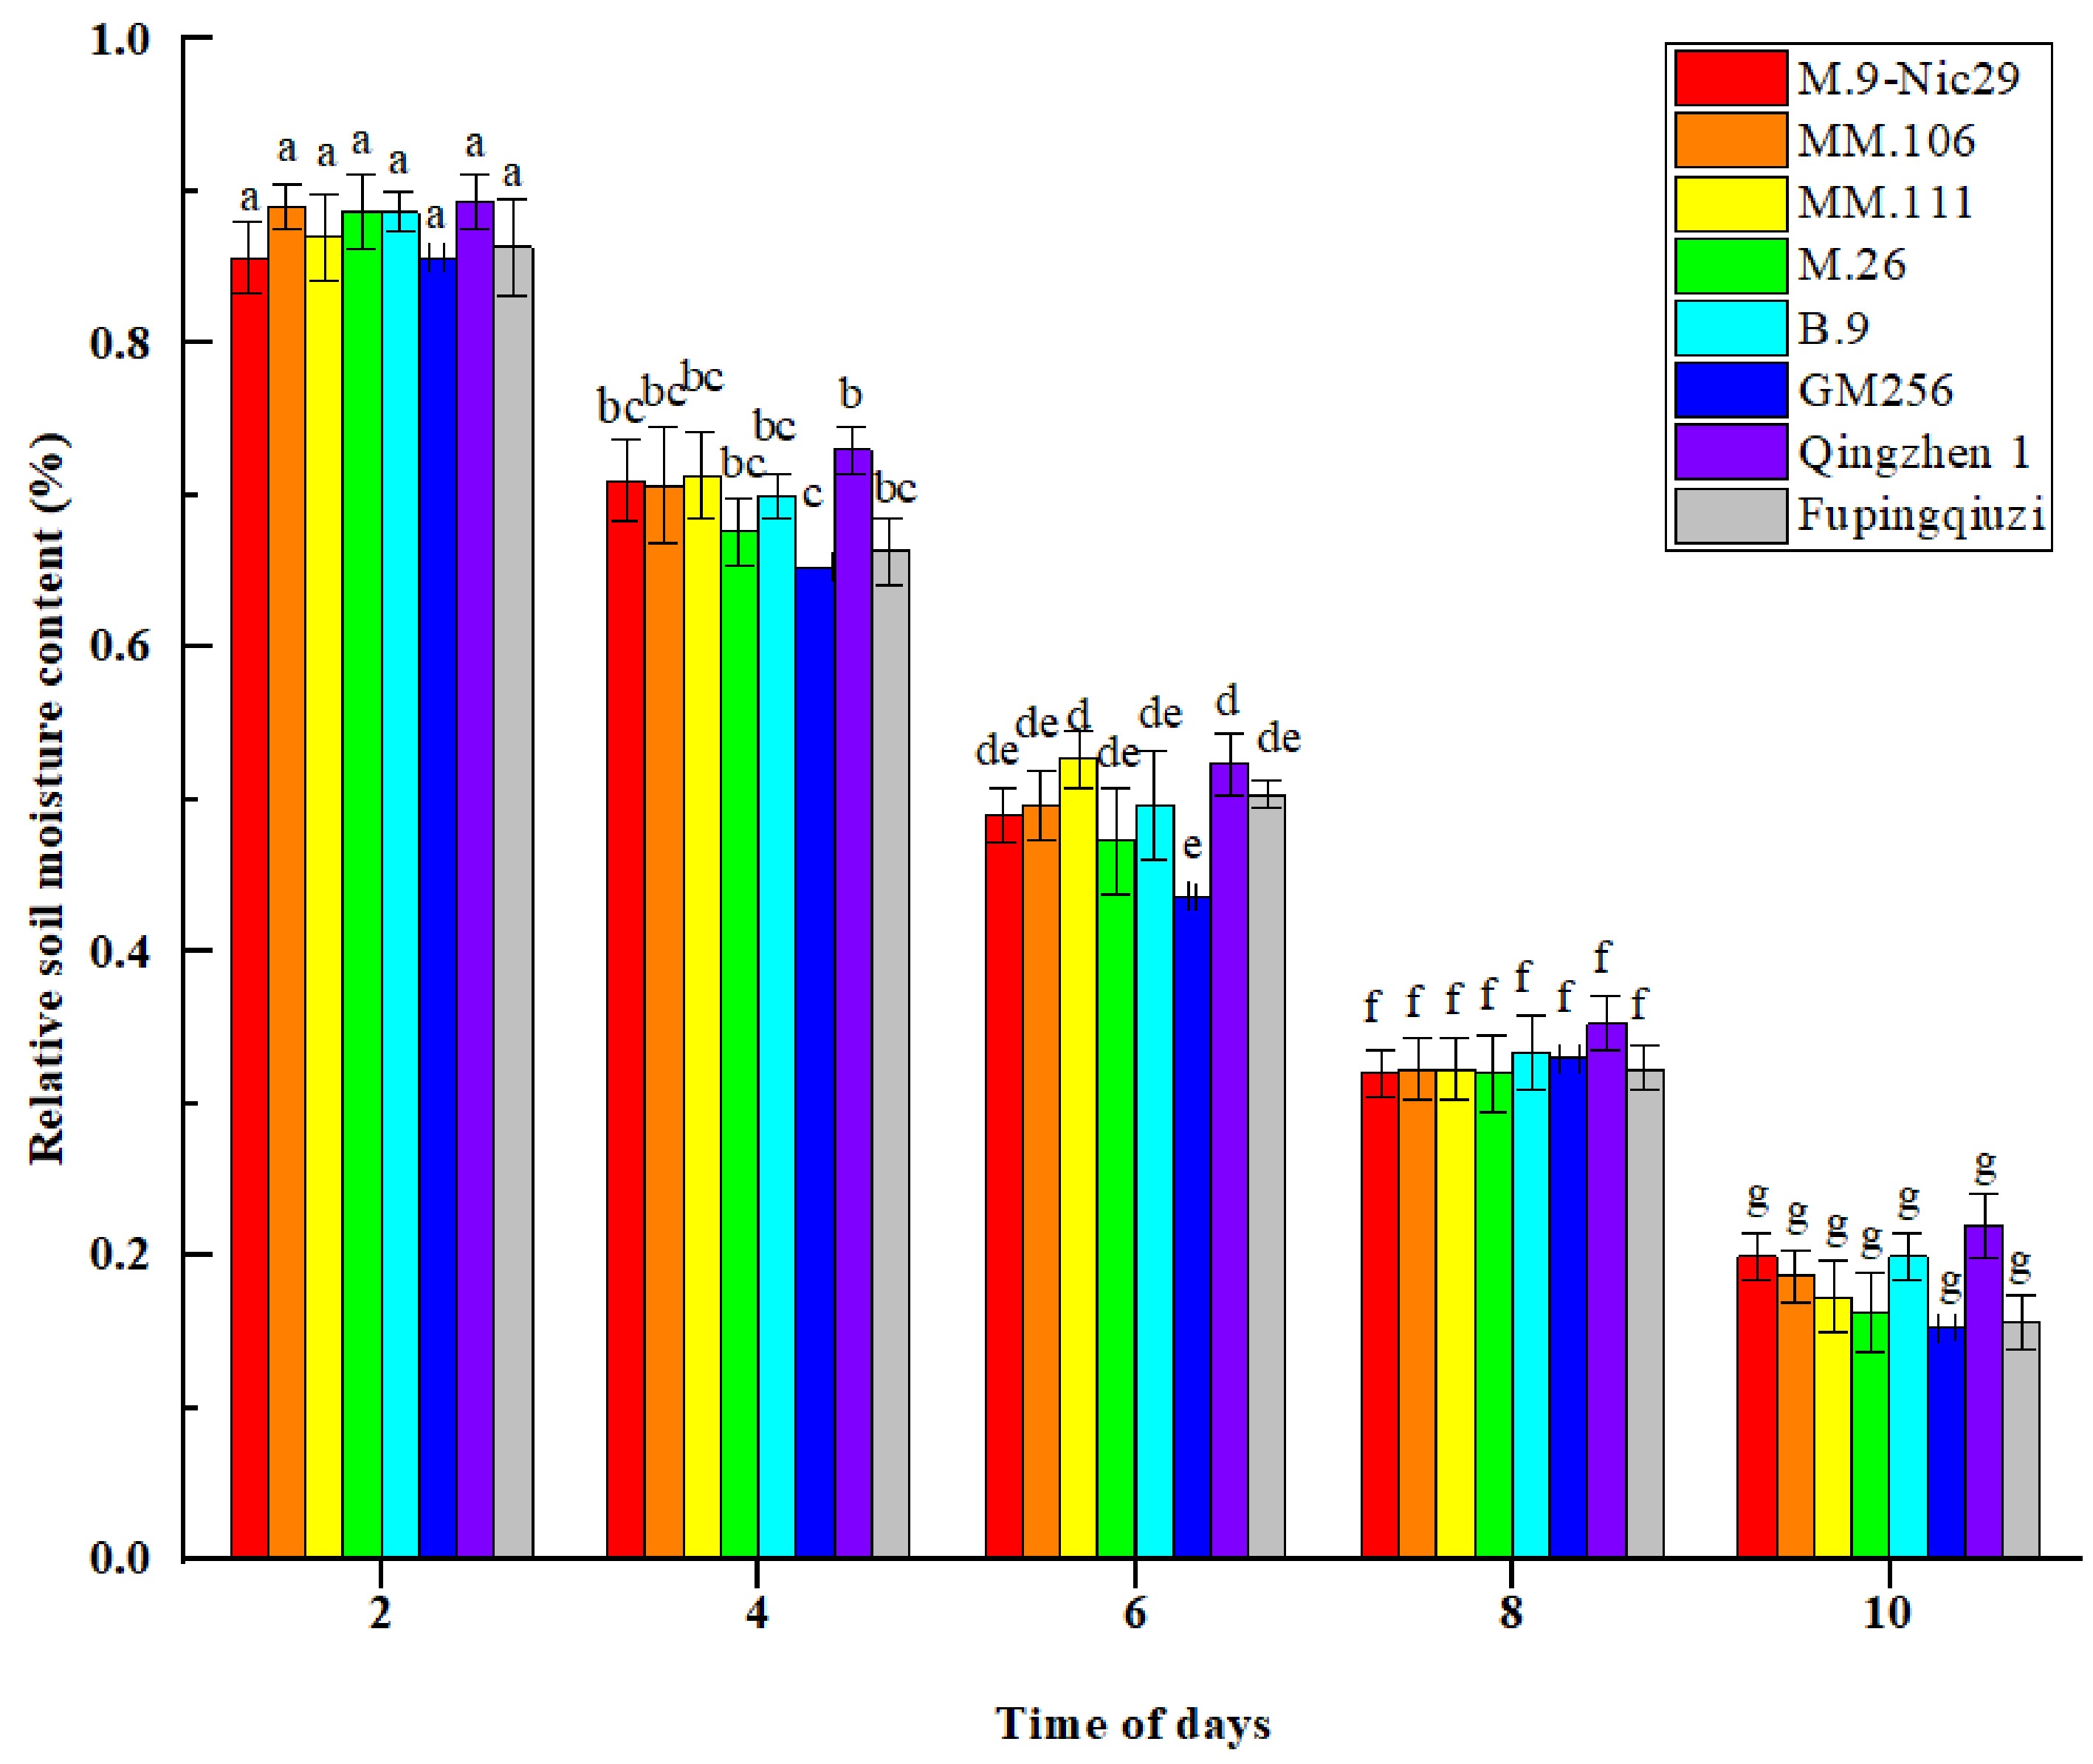
Figure 1.
The effect of natural drought stress on the relative soil moisture content of different apple rootstocks over the duration of 2, 4, 6, 8, and 10 d. Error bars refer to the average value ± SD from three biological replicates. Different letters indicate a significant difference at p < 0.05.
-
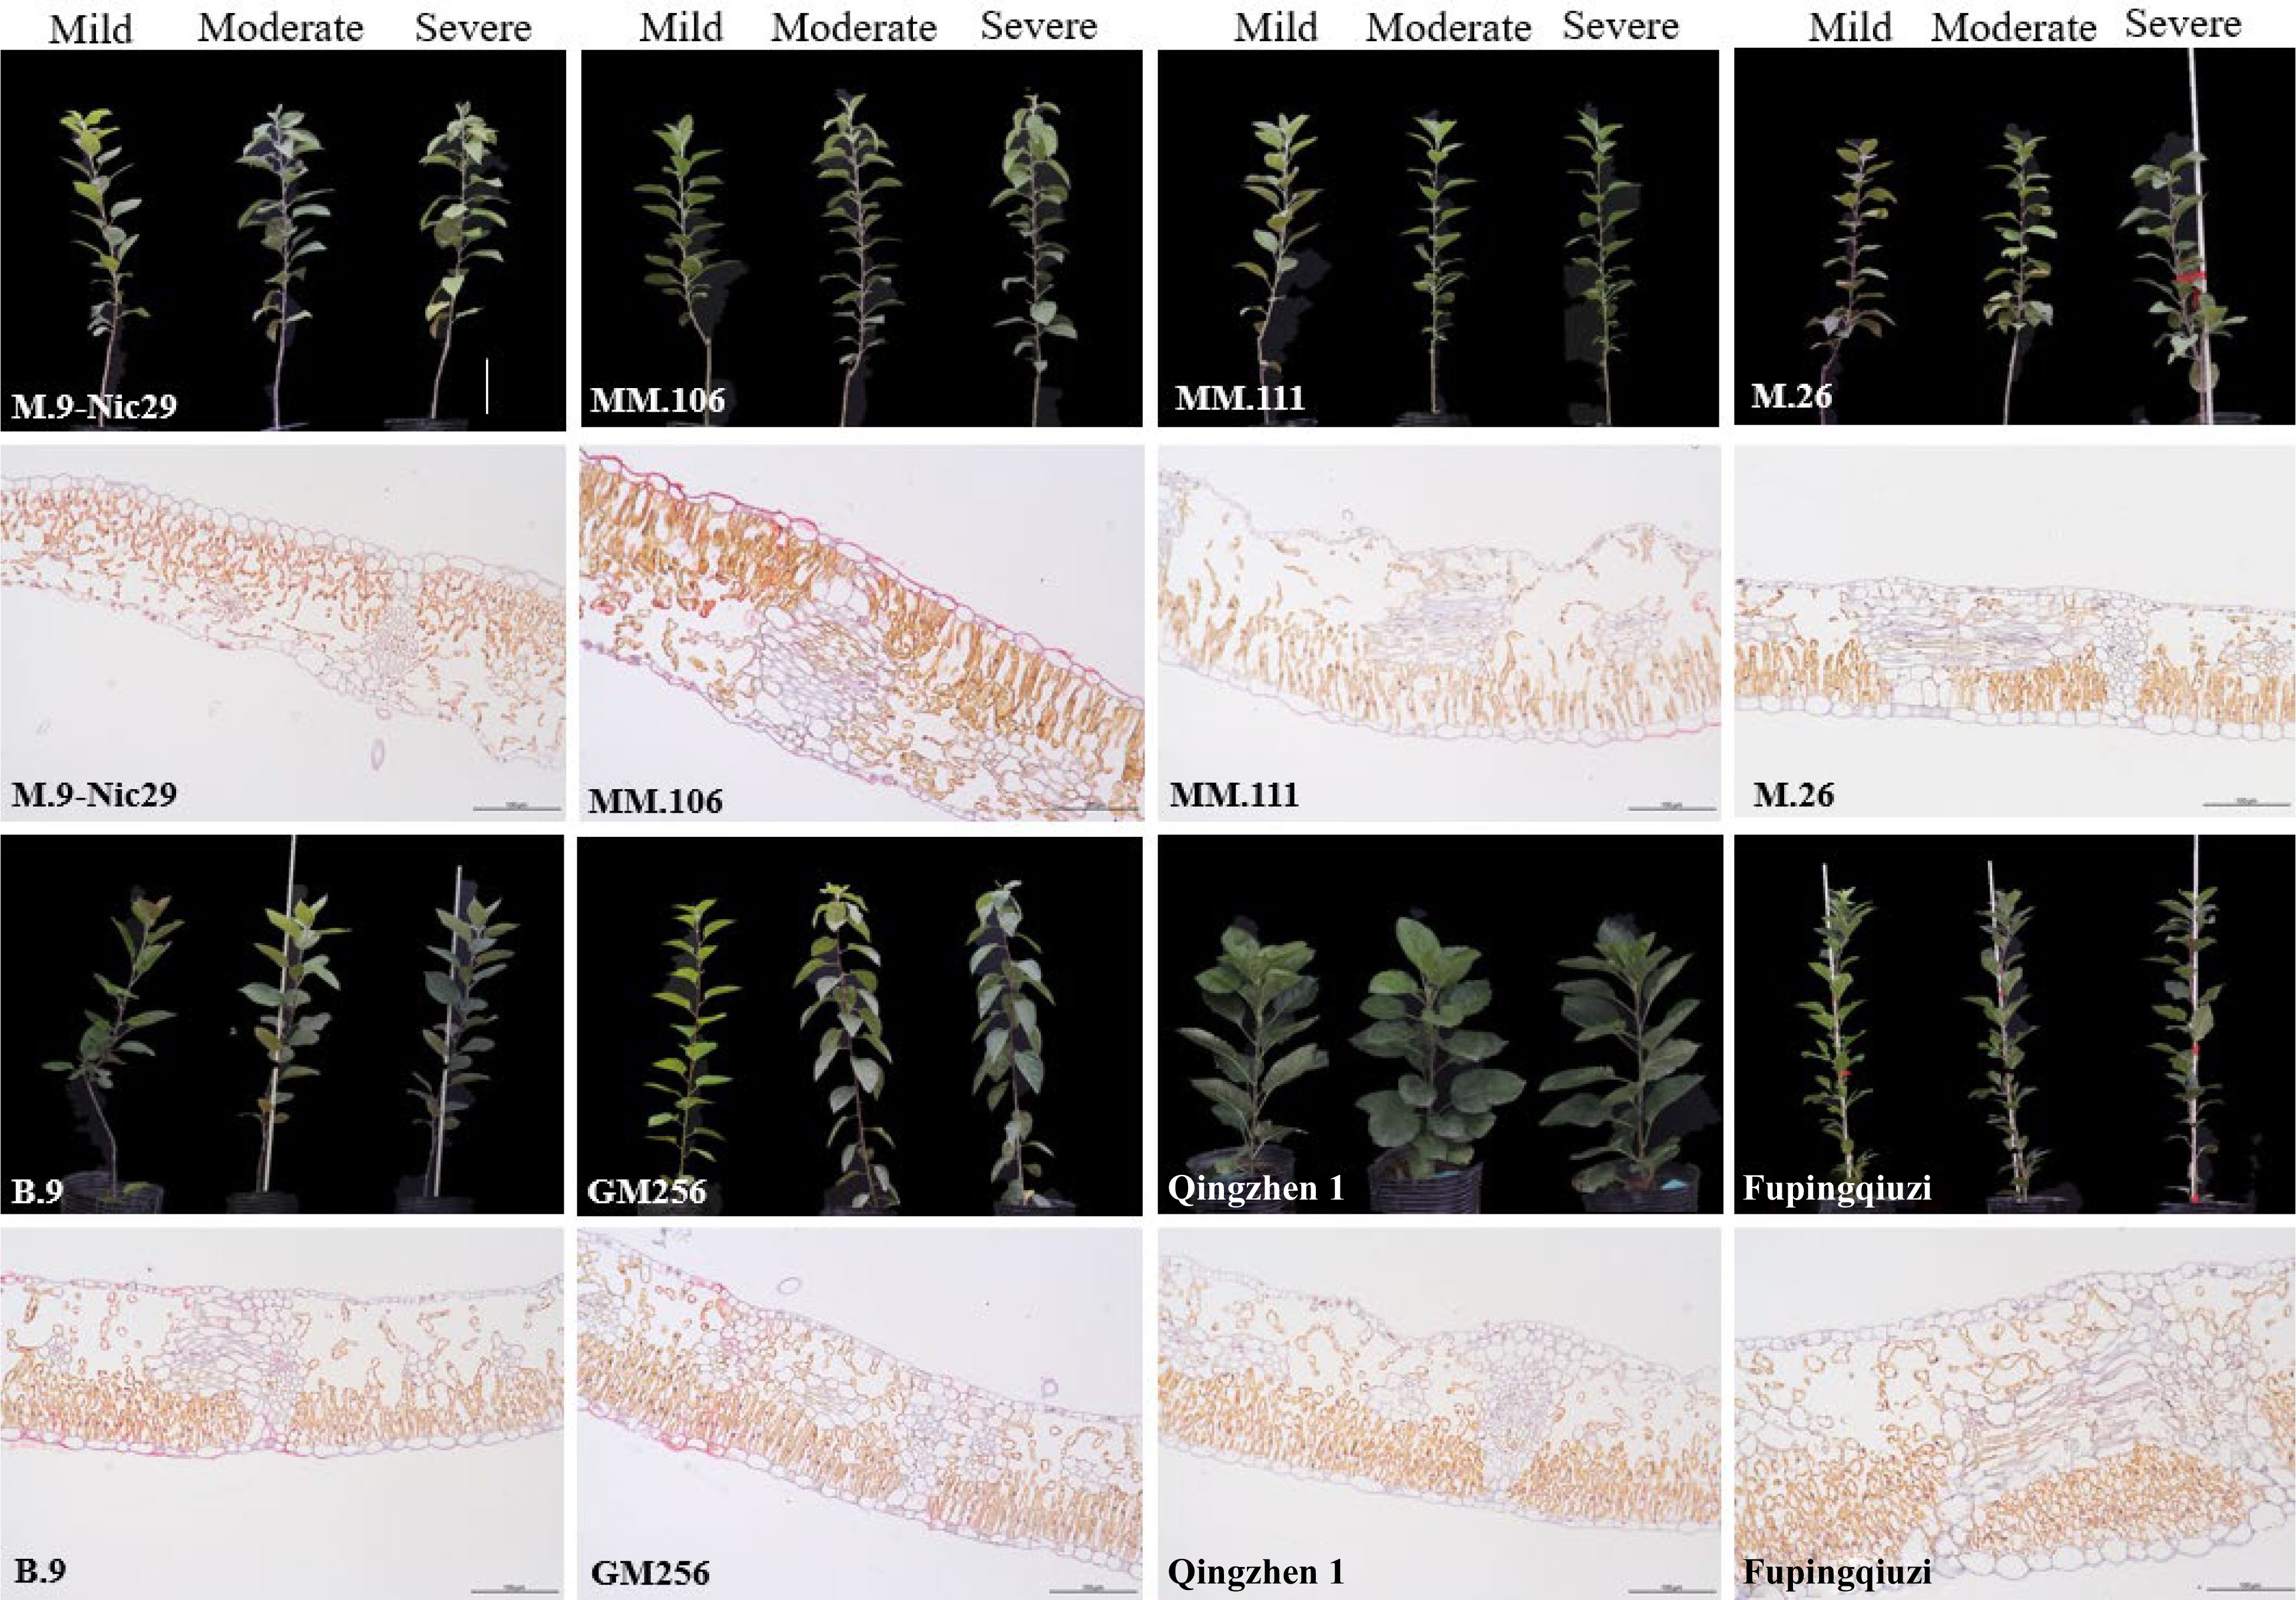
Figure 2.
Morphological changes of leaves among eight genotypes of apple rootstocks. Samples were taken when the relative soil water content reached 65%–75% (mild drought stress), 45%–55% (moderate drought stress), and 25%–35% (severe drought stress); the scale bar = 10 cm. From left to right, the same rootstock represents three states of stress. The anatomical structure of different rootstock leaves under severe drought stress (relative soil water content reached 25%–35%); the scale bar = 250 µm.
-
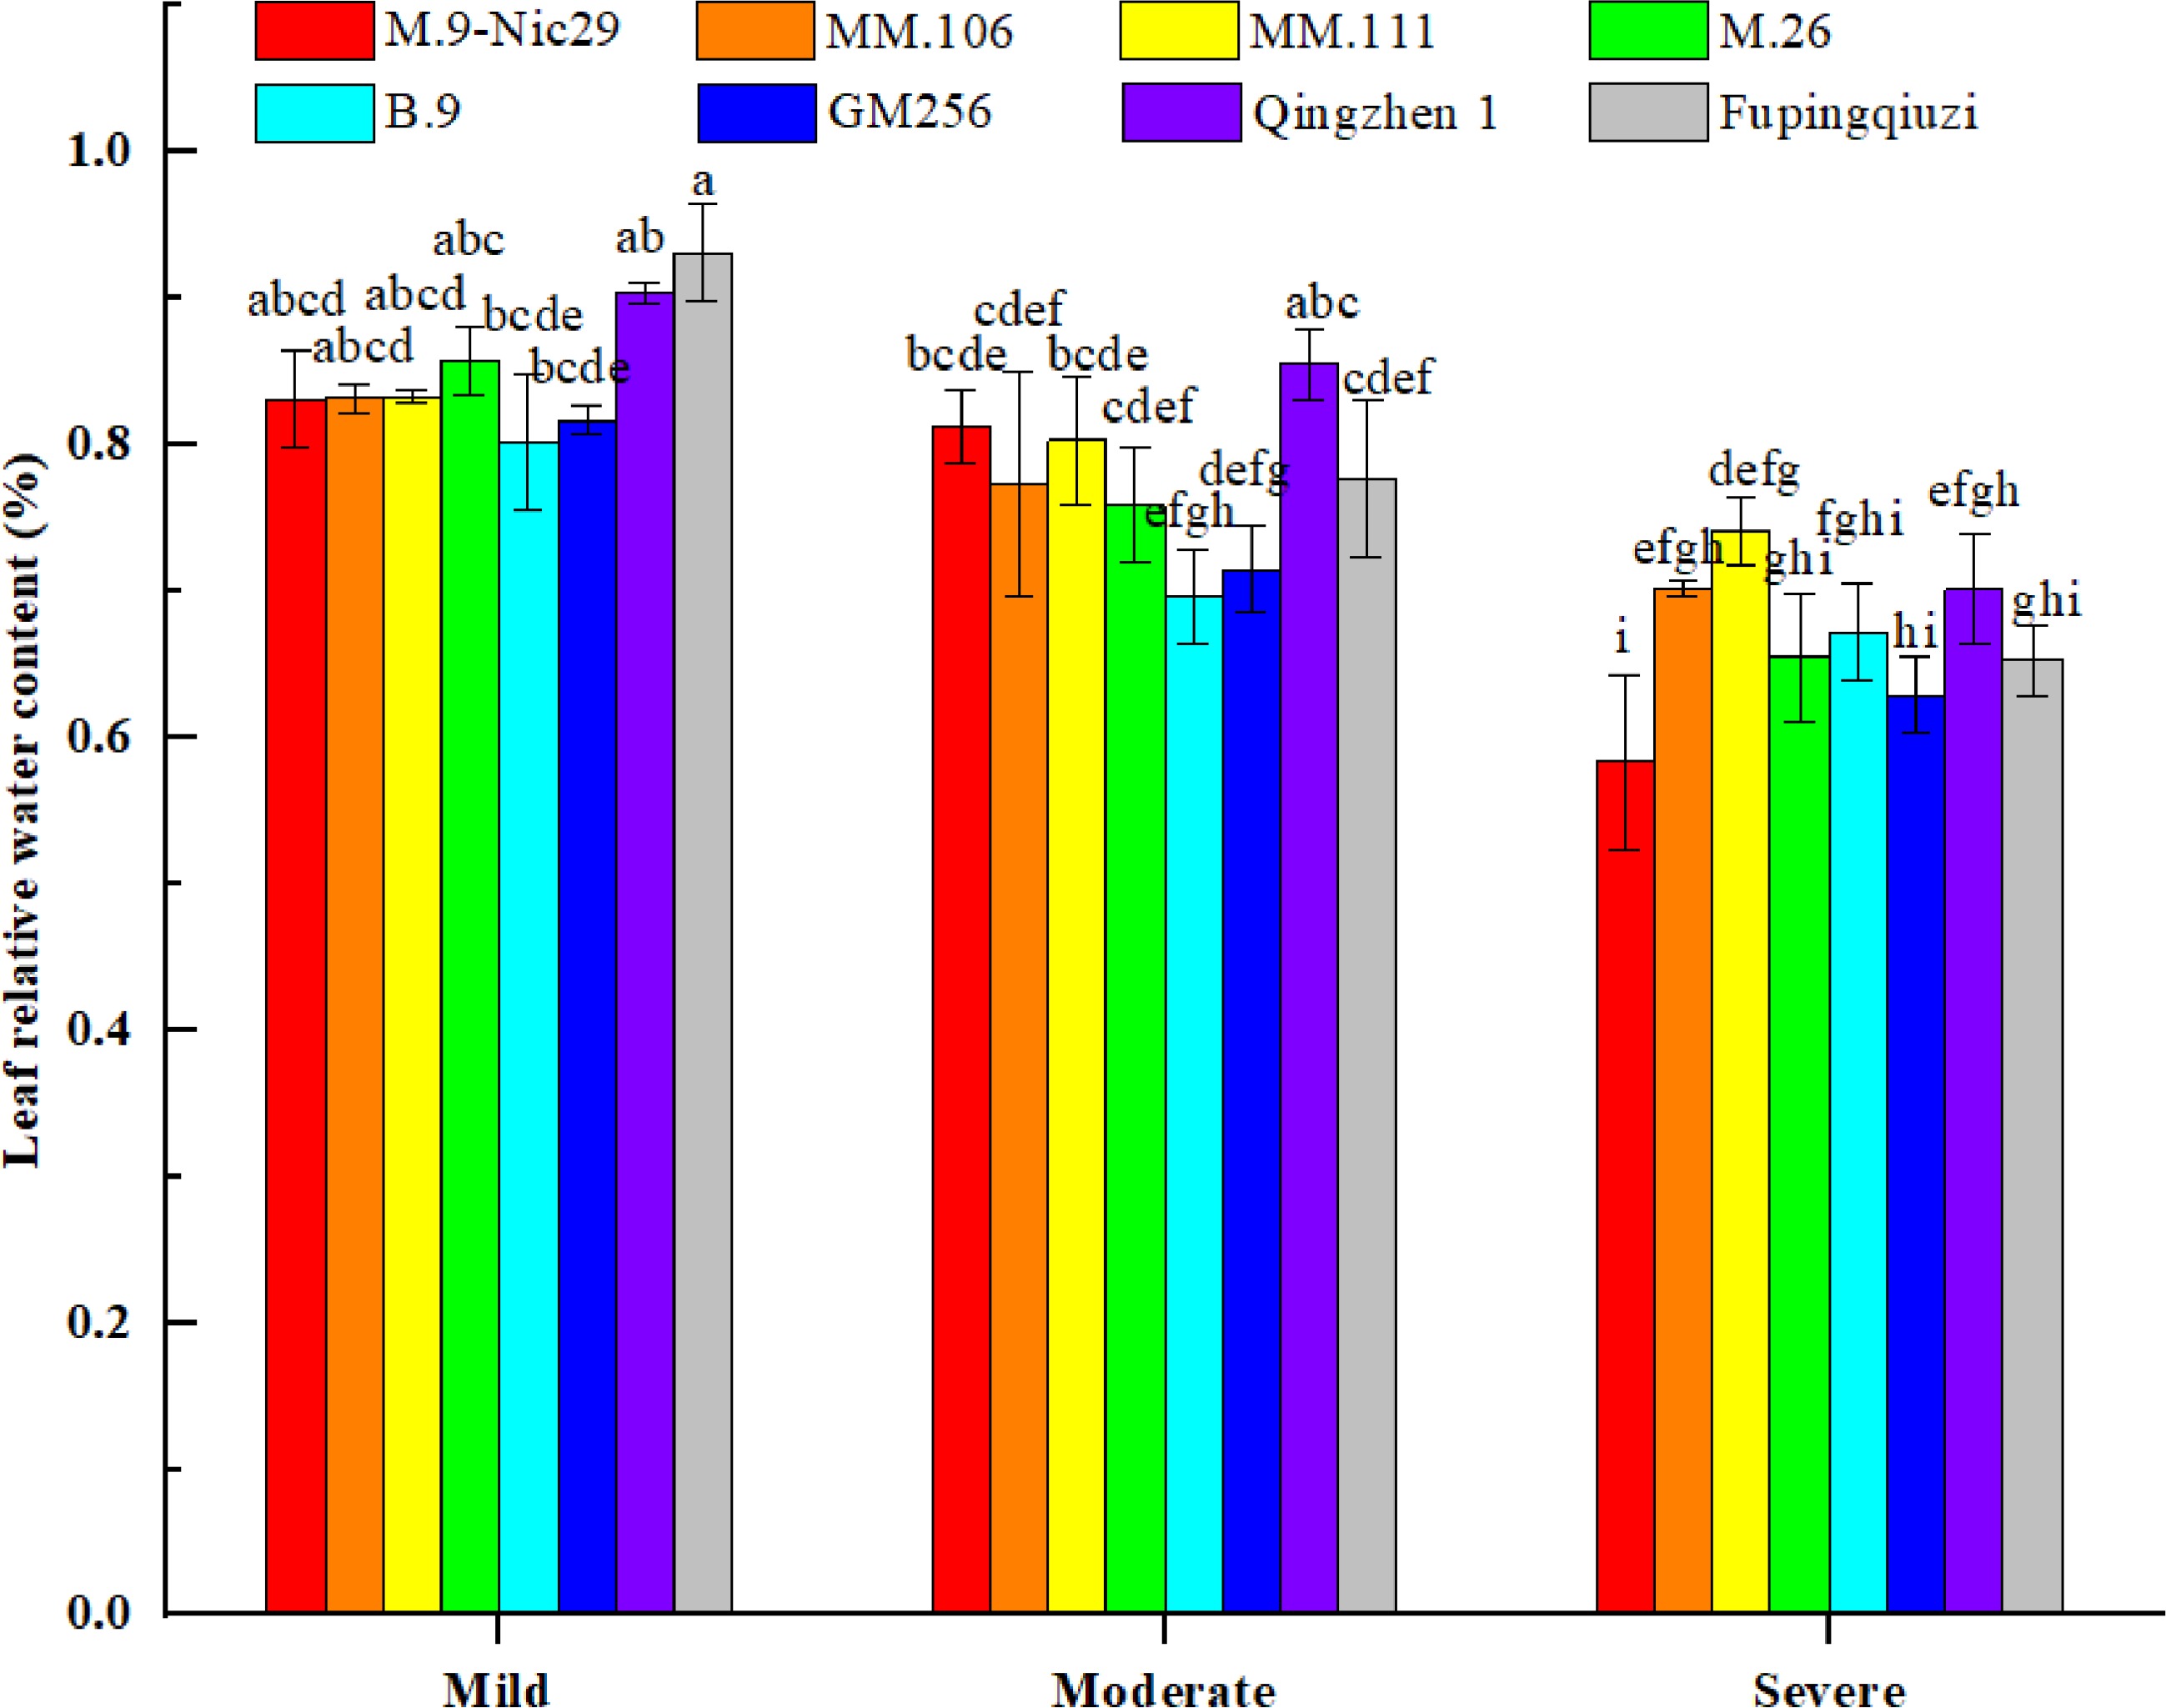
Figure 3.
The effect of different levels of drought on the relative water content (RWC) of leaves on different apple rootstocks. Samples were harvested when the relative soil water content reached 65%–75% (mild drought stress), 45%–55% (moderate drought stress), and 25%–35% (severe drought stress). Error bars refer to the average value ± SD from three biological replicates. Different letters indicate a significant difference at p < 0.05.
-
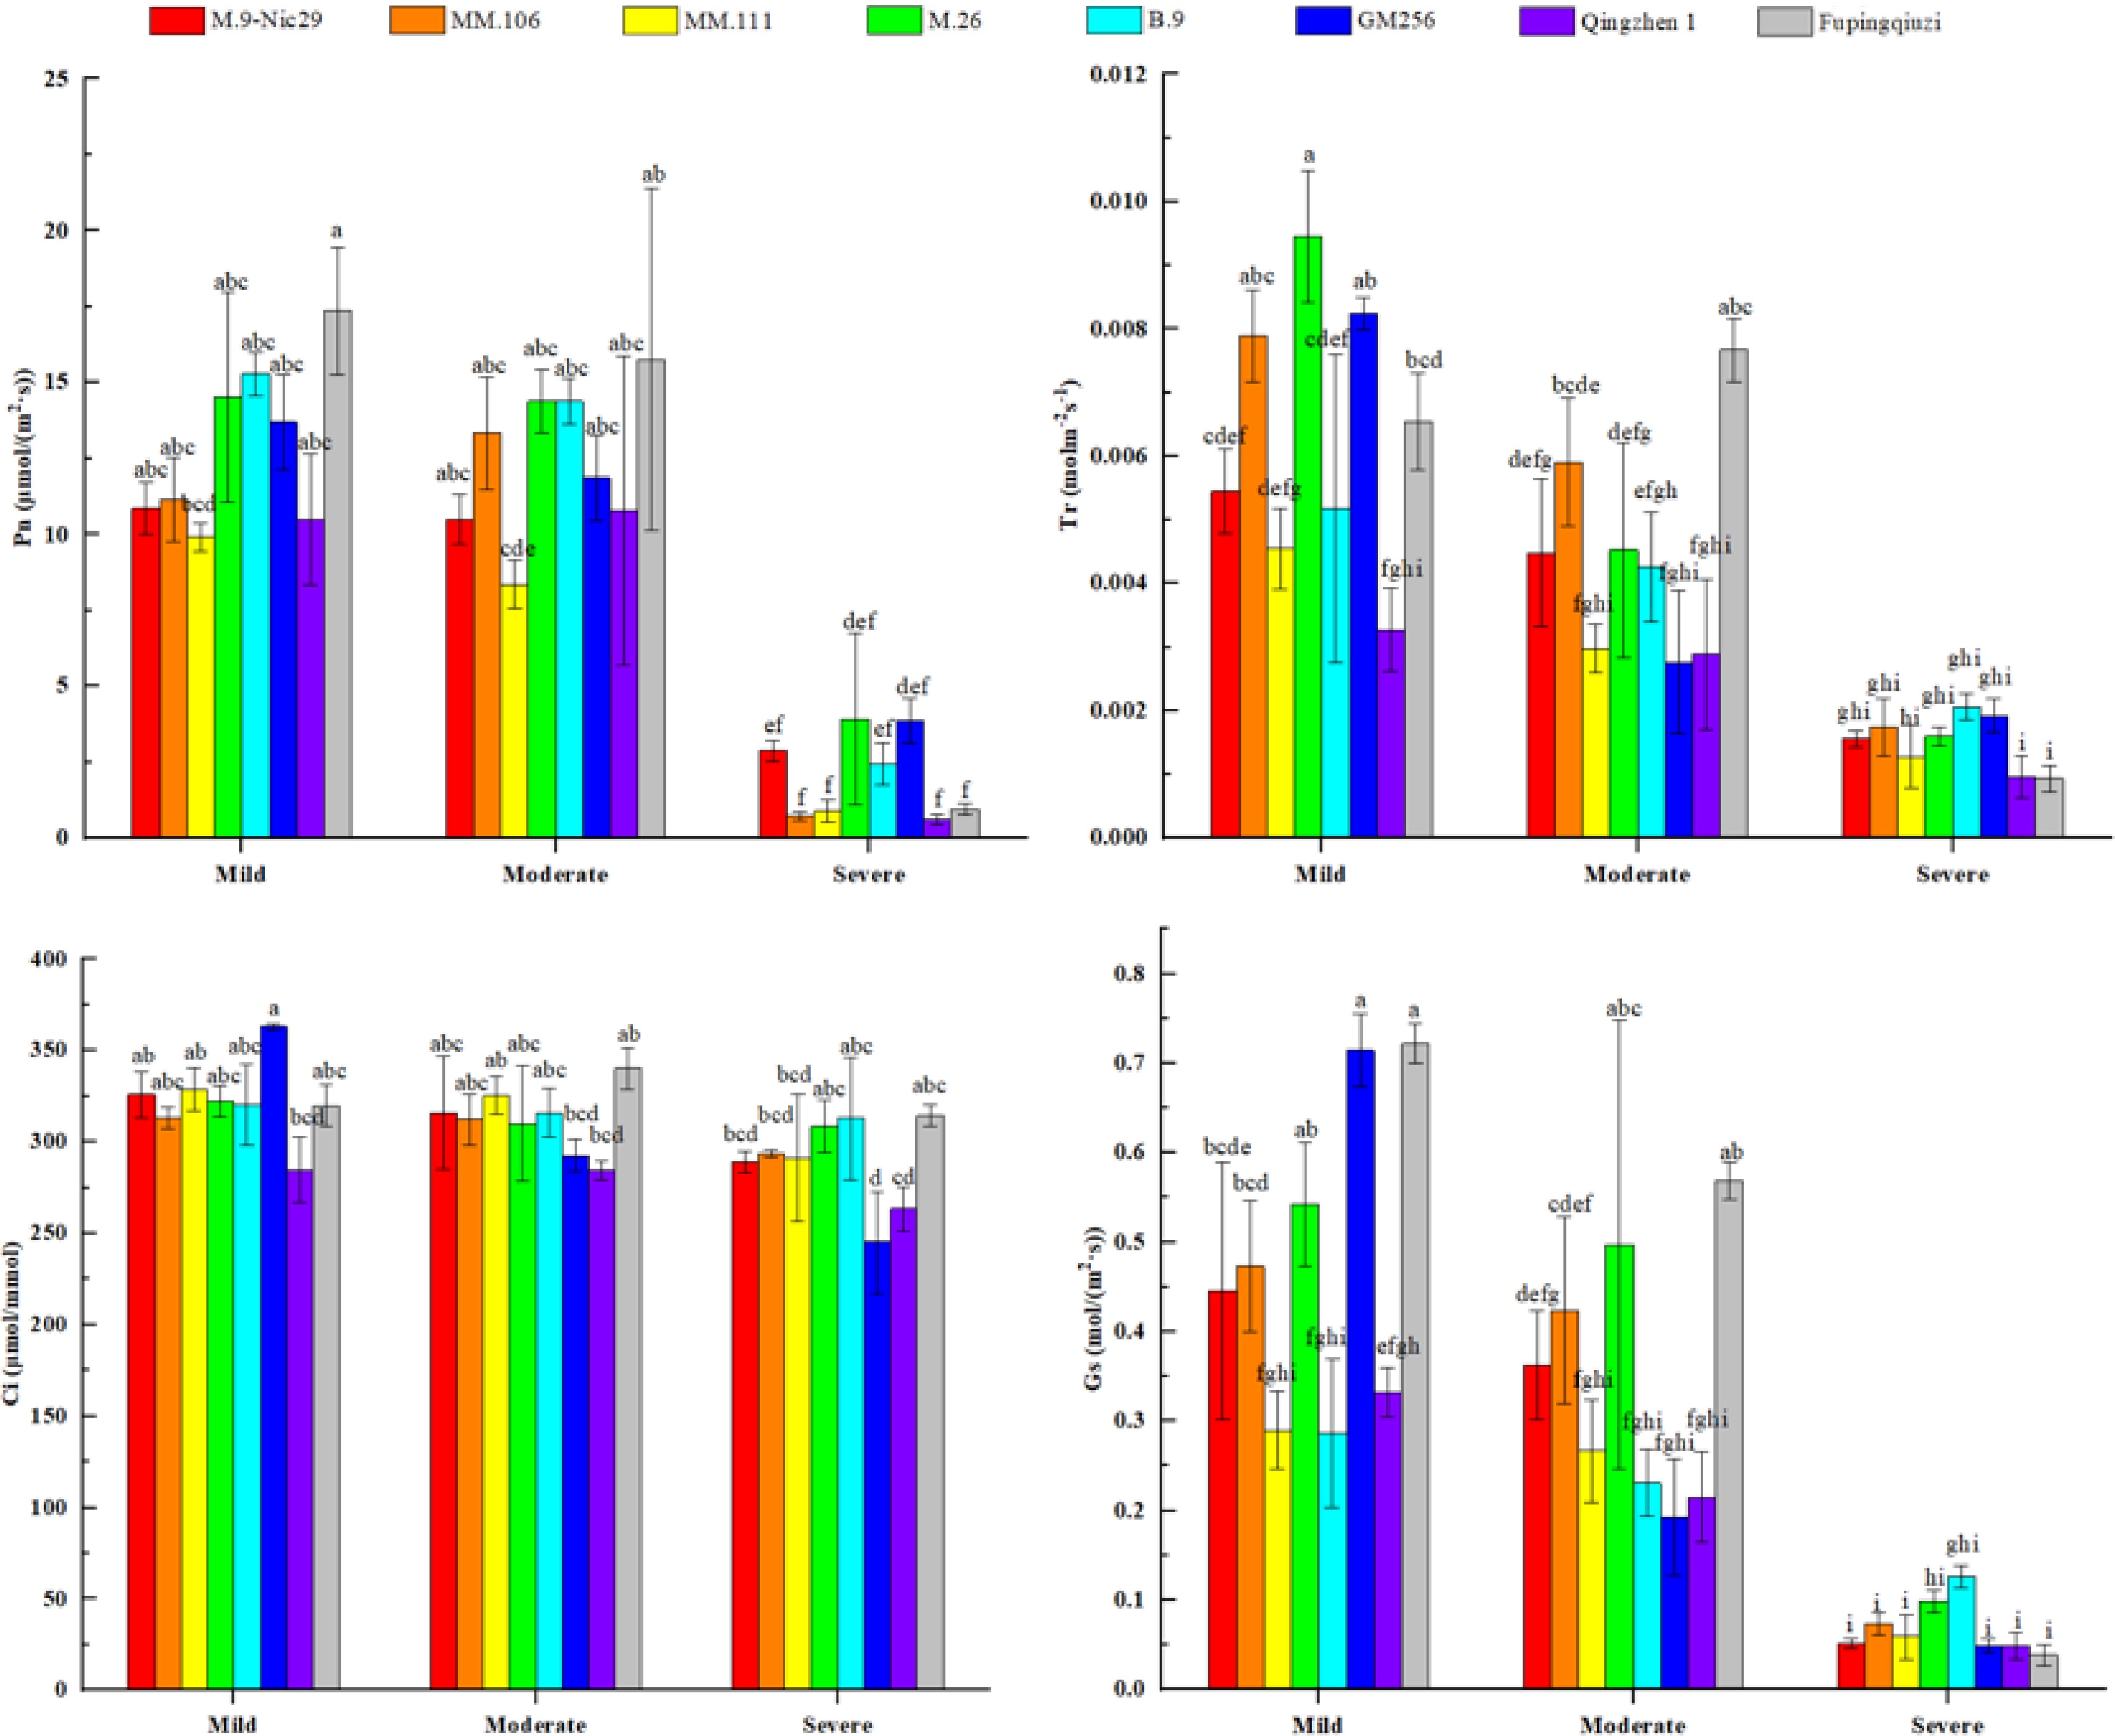
Figure 4.
The effect of different levels of drought on the photosynthetic parameters, such as photosynthetic rate (Pn), transpiration rate (Tr), intercellular CO2 concentration (Ci), and stomatal conductance (Gs), in different apple rootstocks. Samples were harvested when the relative soil water content reached 65%–75% (mild drought stress), 45%–55% (moderate drought stress), and 25%–35% (severe drought stress). Error bars refer to the average value ± SD from three biological replicates. Different letters indicate a significant difference at p < 0.05.
-
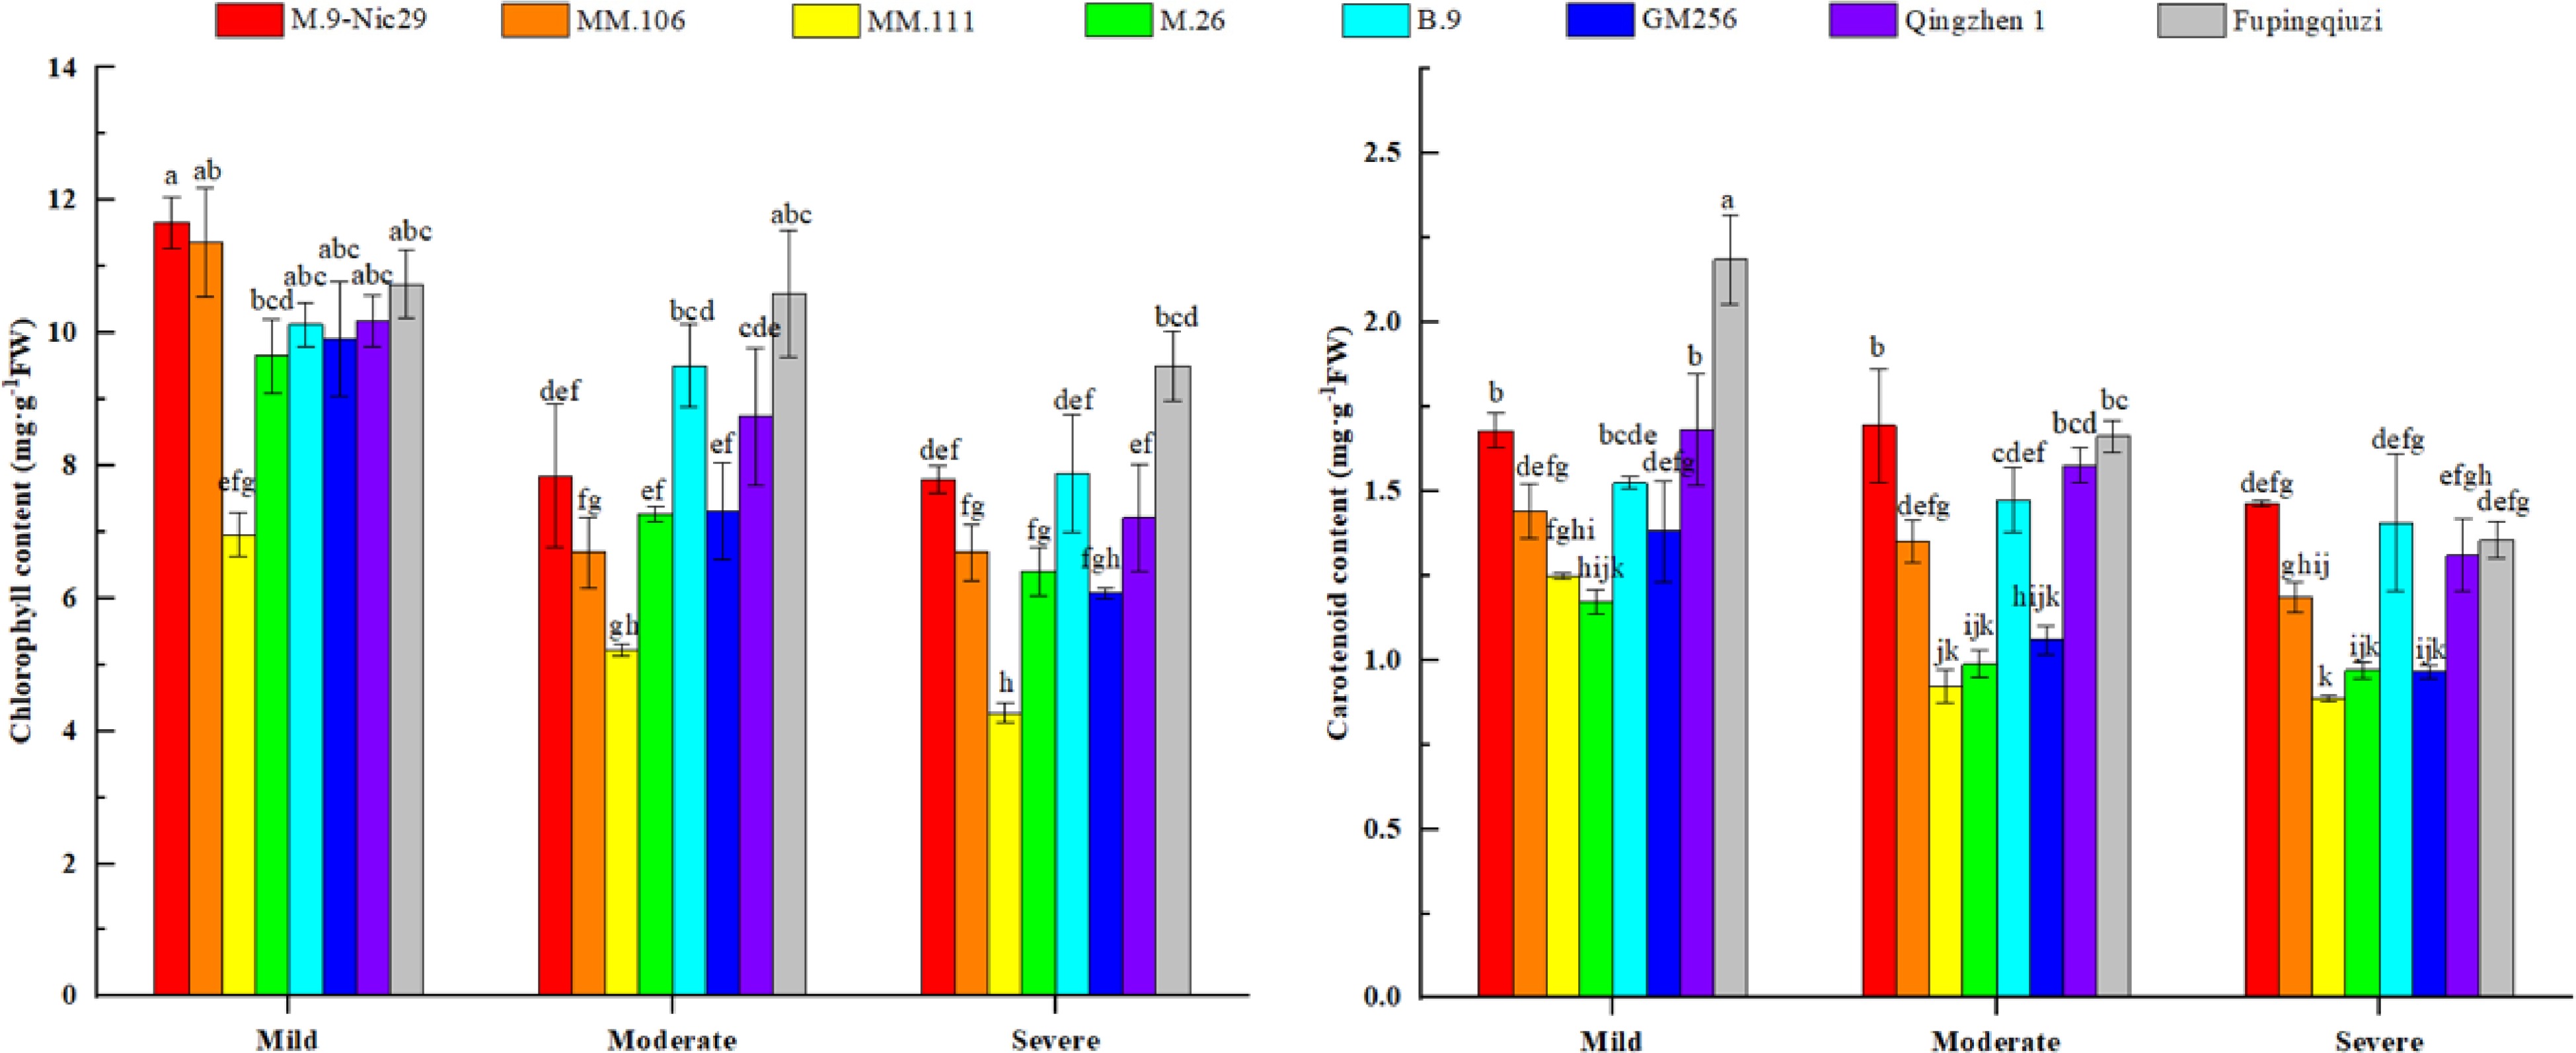
Figure 5.
The effect of different levels of drought on the contents of photosynthetic pigments (chlorophyll and carotenoid) in different apple rootstocks. Samples were harvested when the relative soil water content reached 65%–75% (mild drought stress), 45%–55% (moderate drought stress), and 25%–35% (severe drought stress). Error bars refer to the average value ± SD from three biological replicates. Different letters indicate a significant difference at p < 0.05.
-
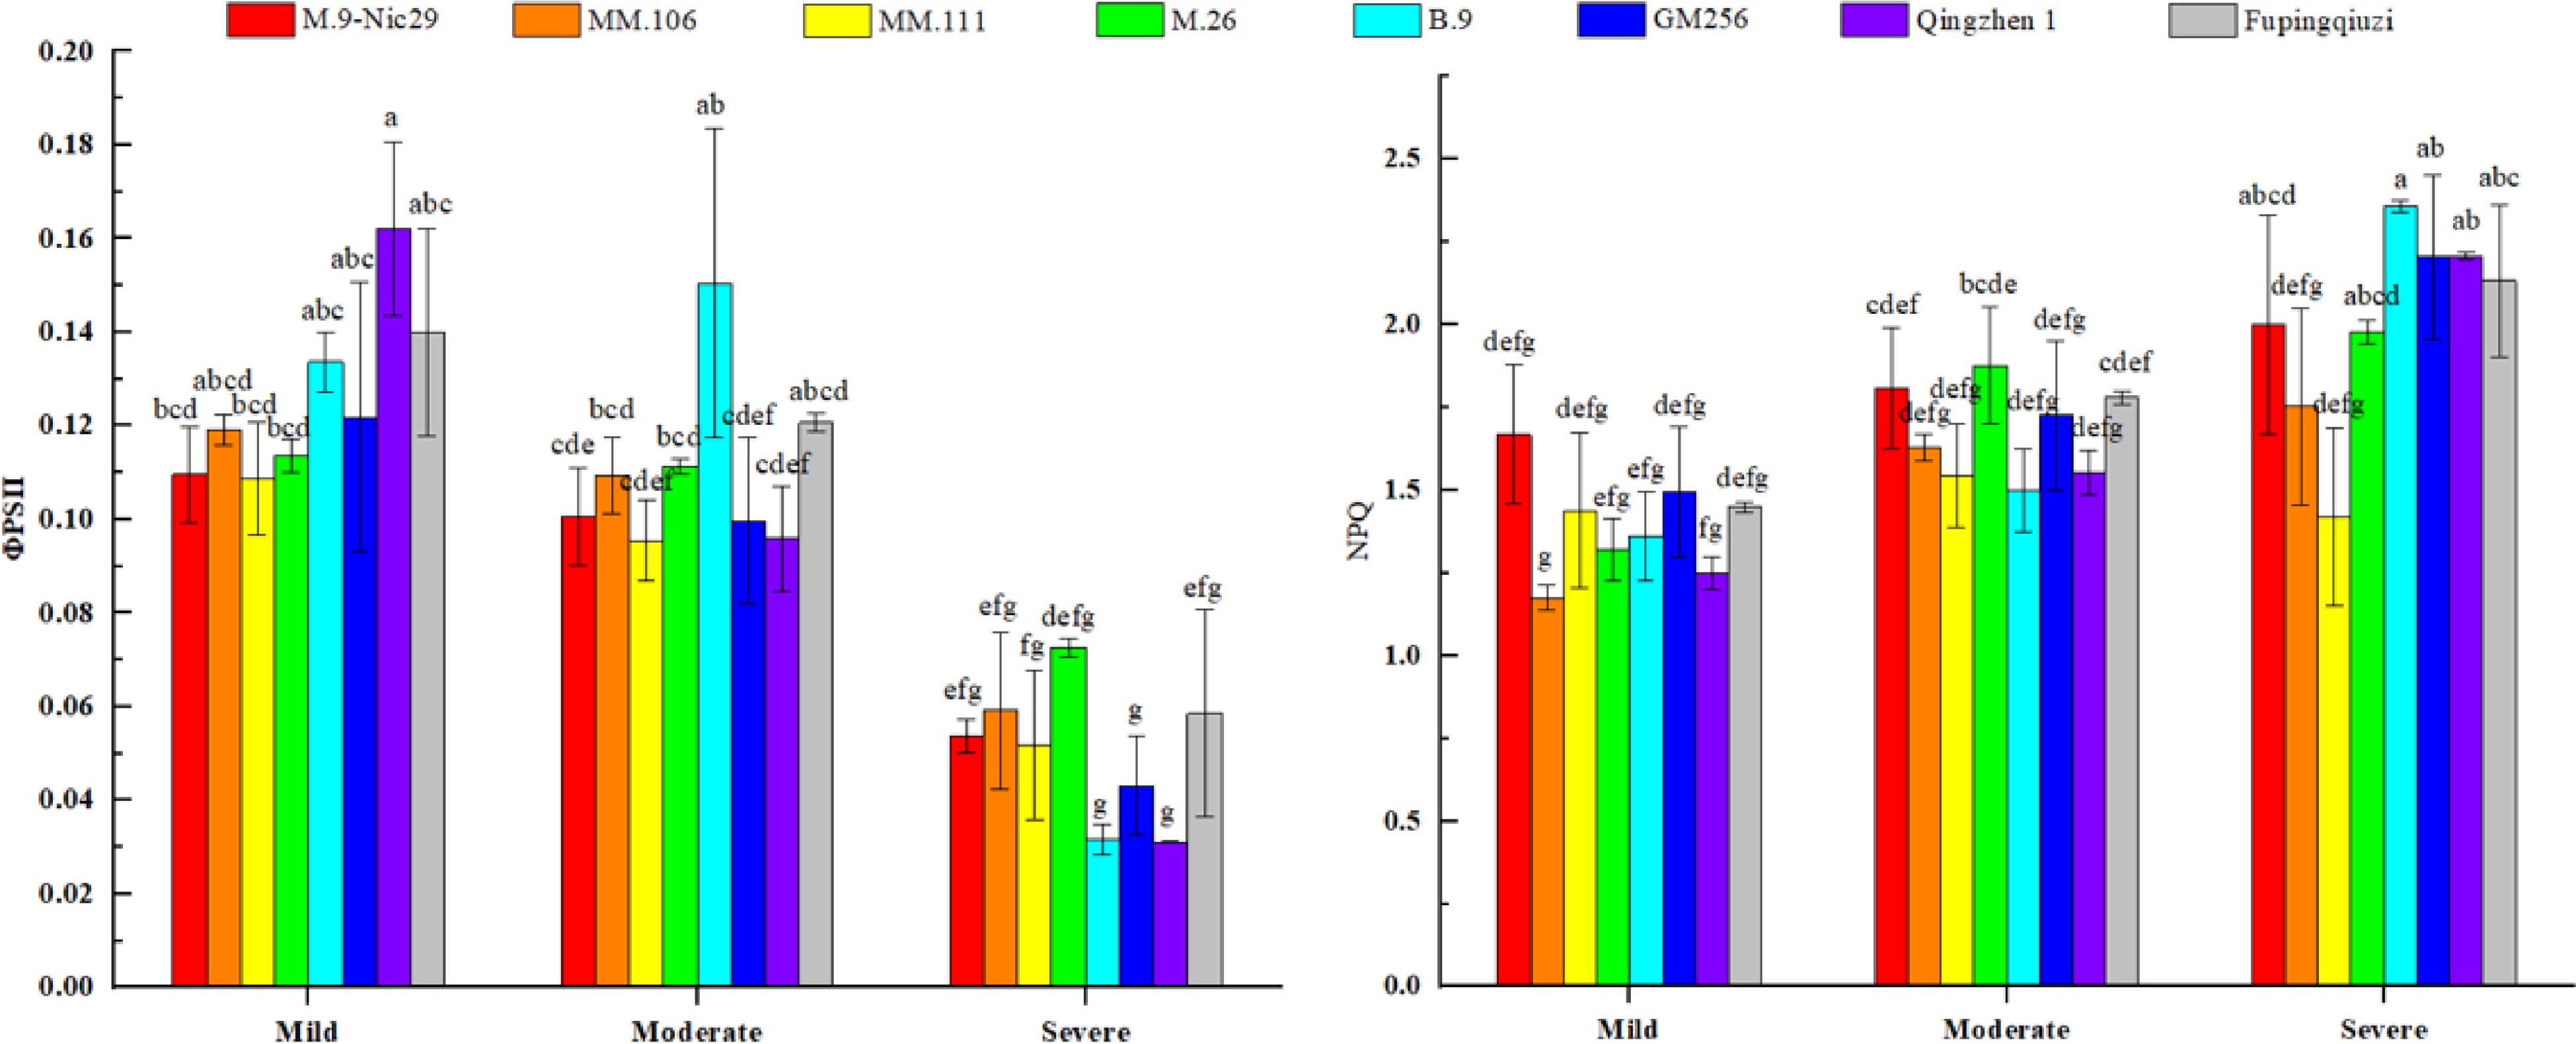
Figure 6.
The effect of different levels of drought on the chlorophyll fluorescence (photochemical efficiency of PSII reaction centre,
${\text Φ} $ -
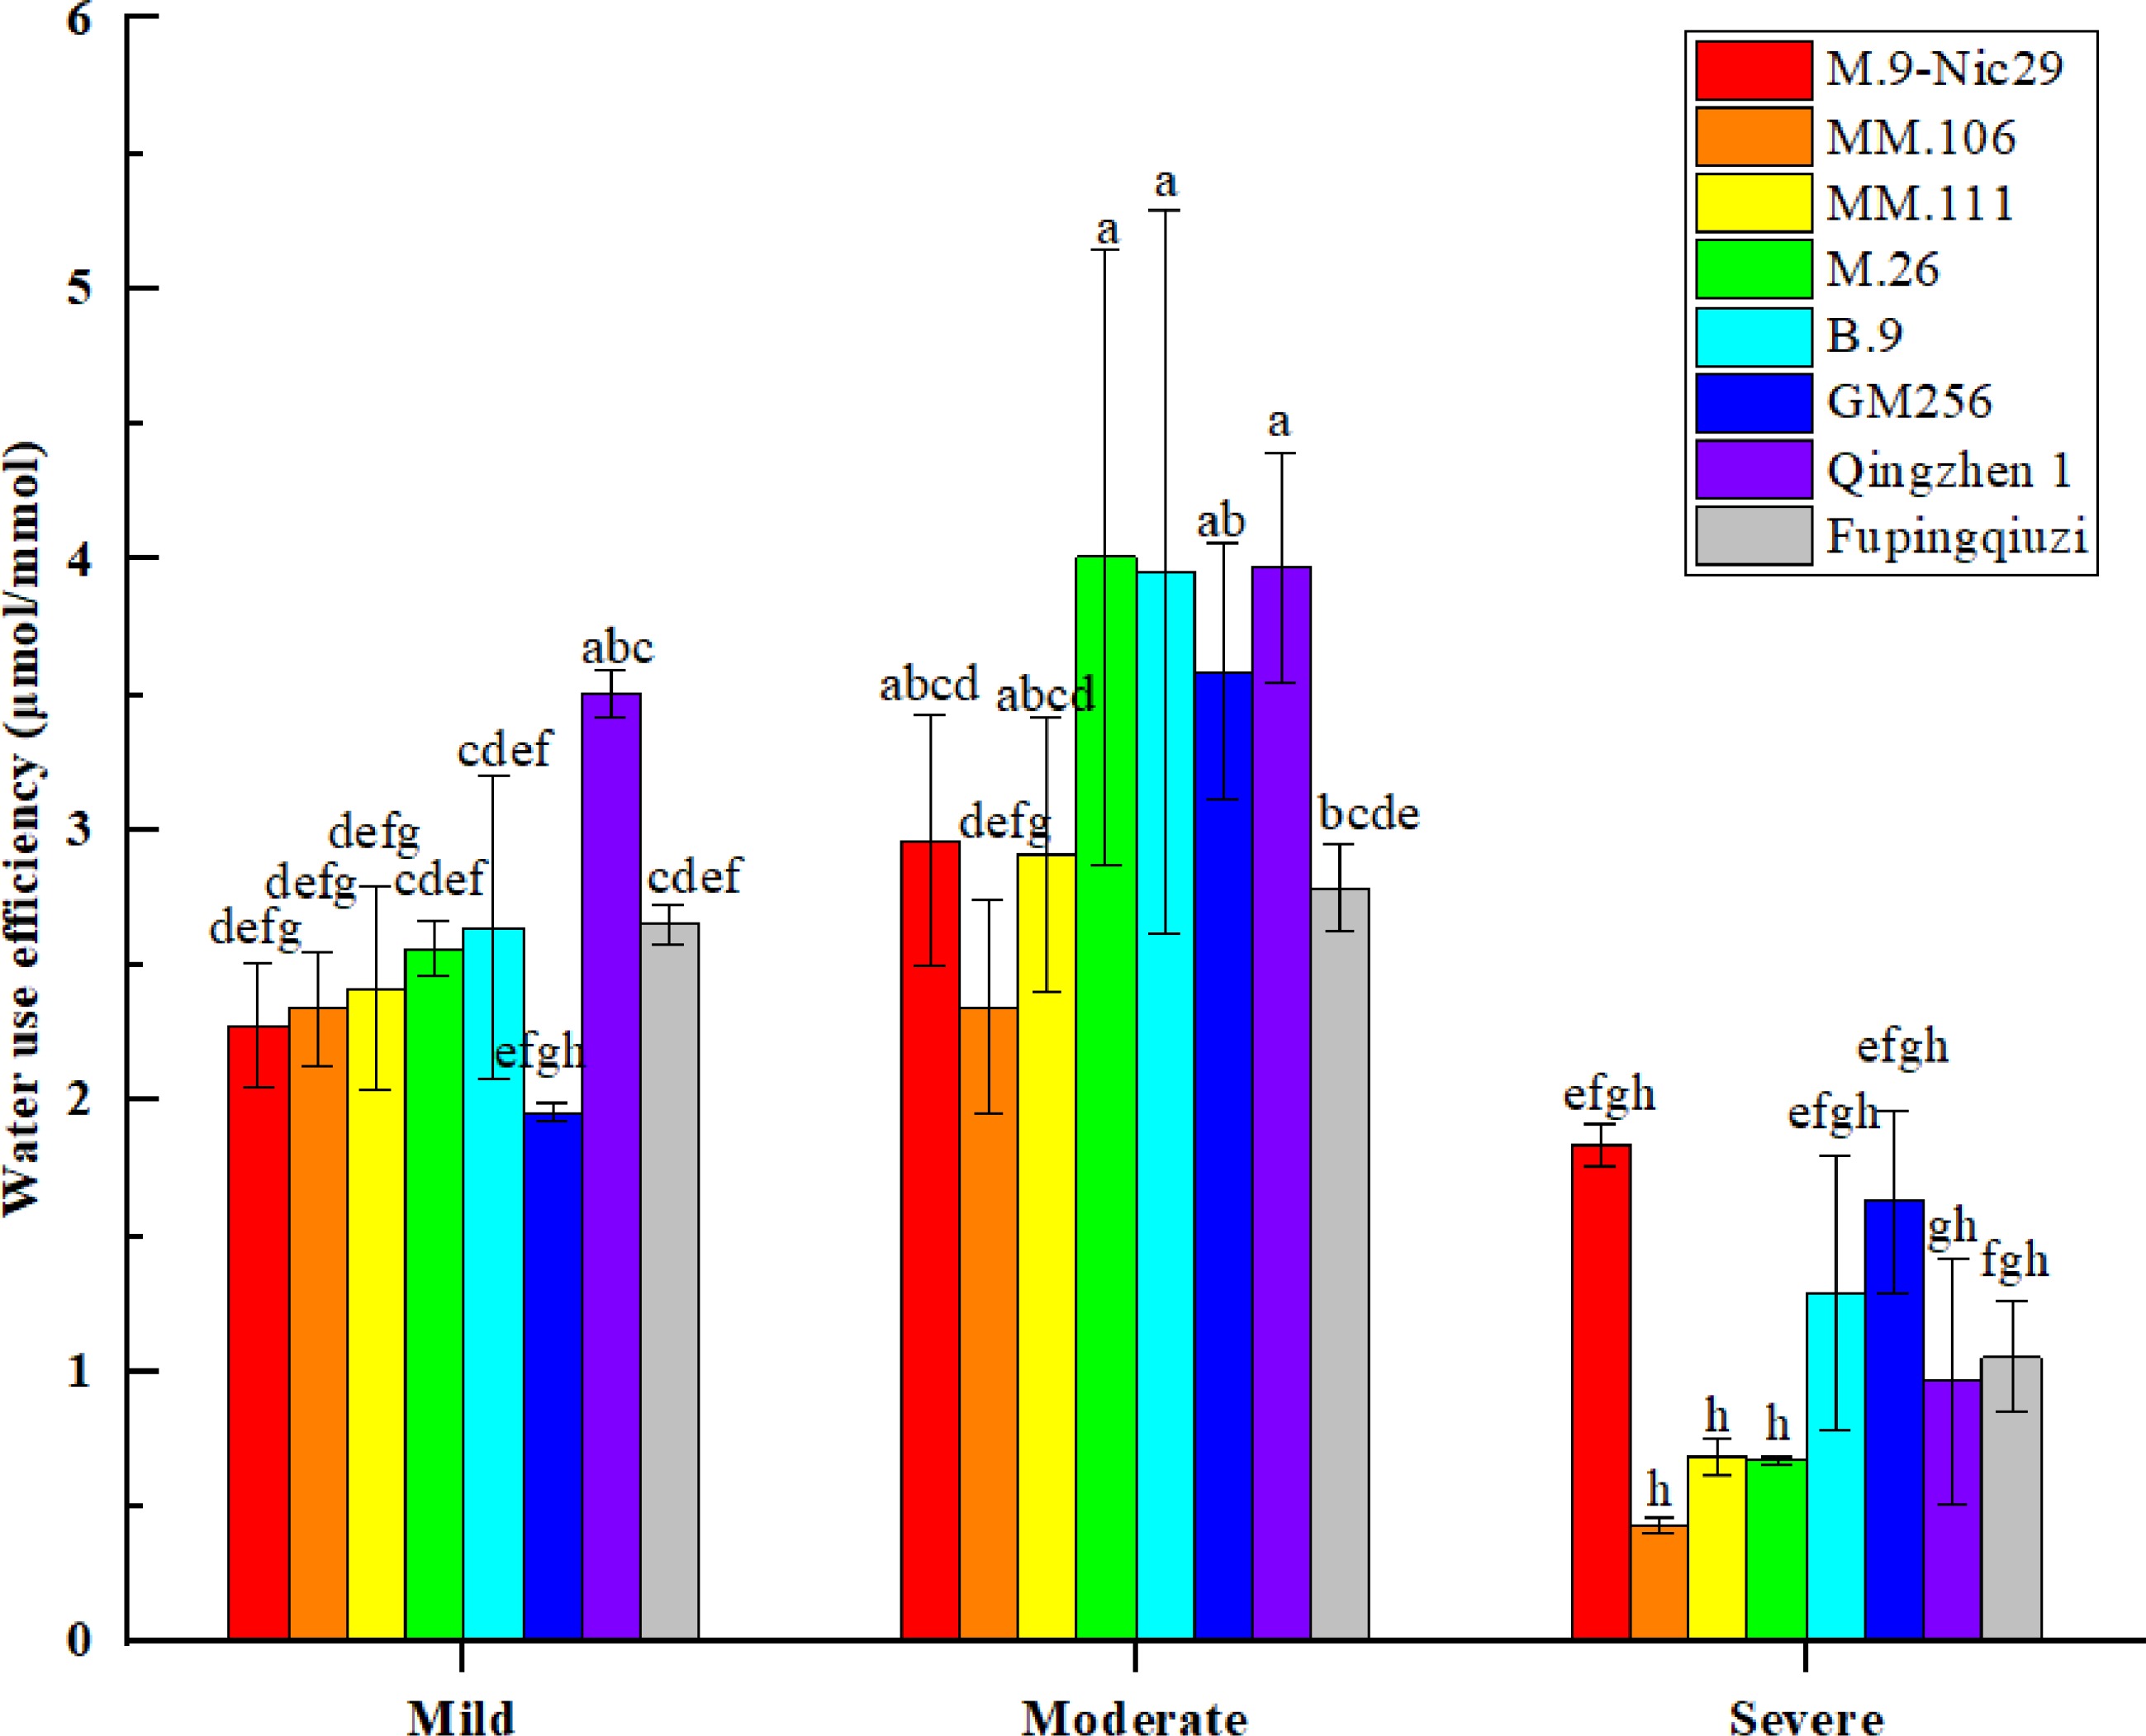
Figure 7.
The effect of different levels of drought on the water use efficiency (WUE) of different apple rootstocks. Samples were harvested when the relative soil water content reached 65%–75% (mild drought stress), 45%–55% (moderate drought stress), and 25%–35% (severe drought stress). Error bars refer to the average value ± SD from three biological replicates. Different letters indicate a significant difference at p < 0.05.
-
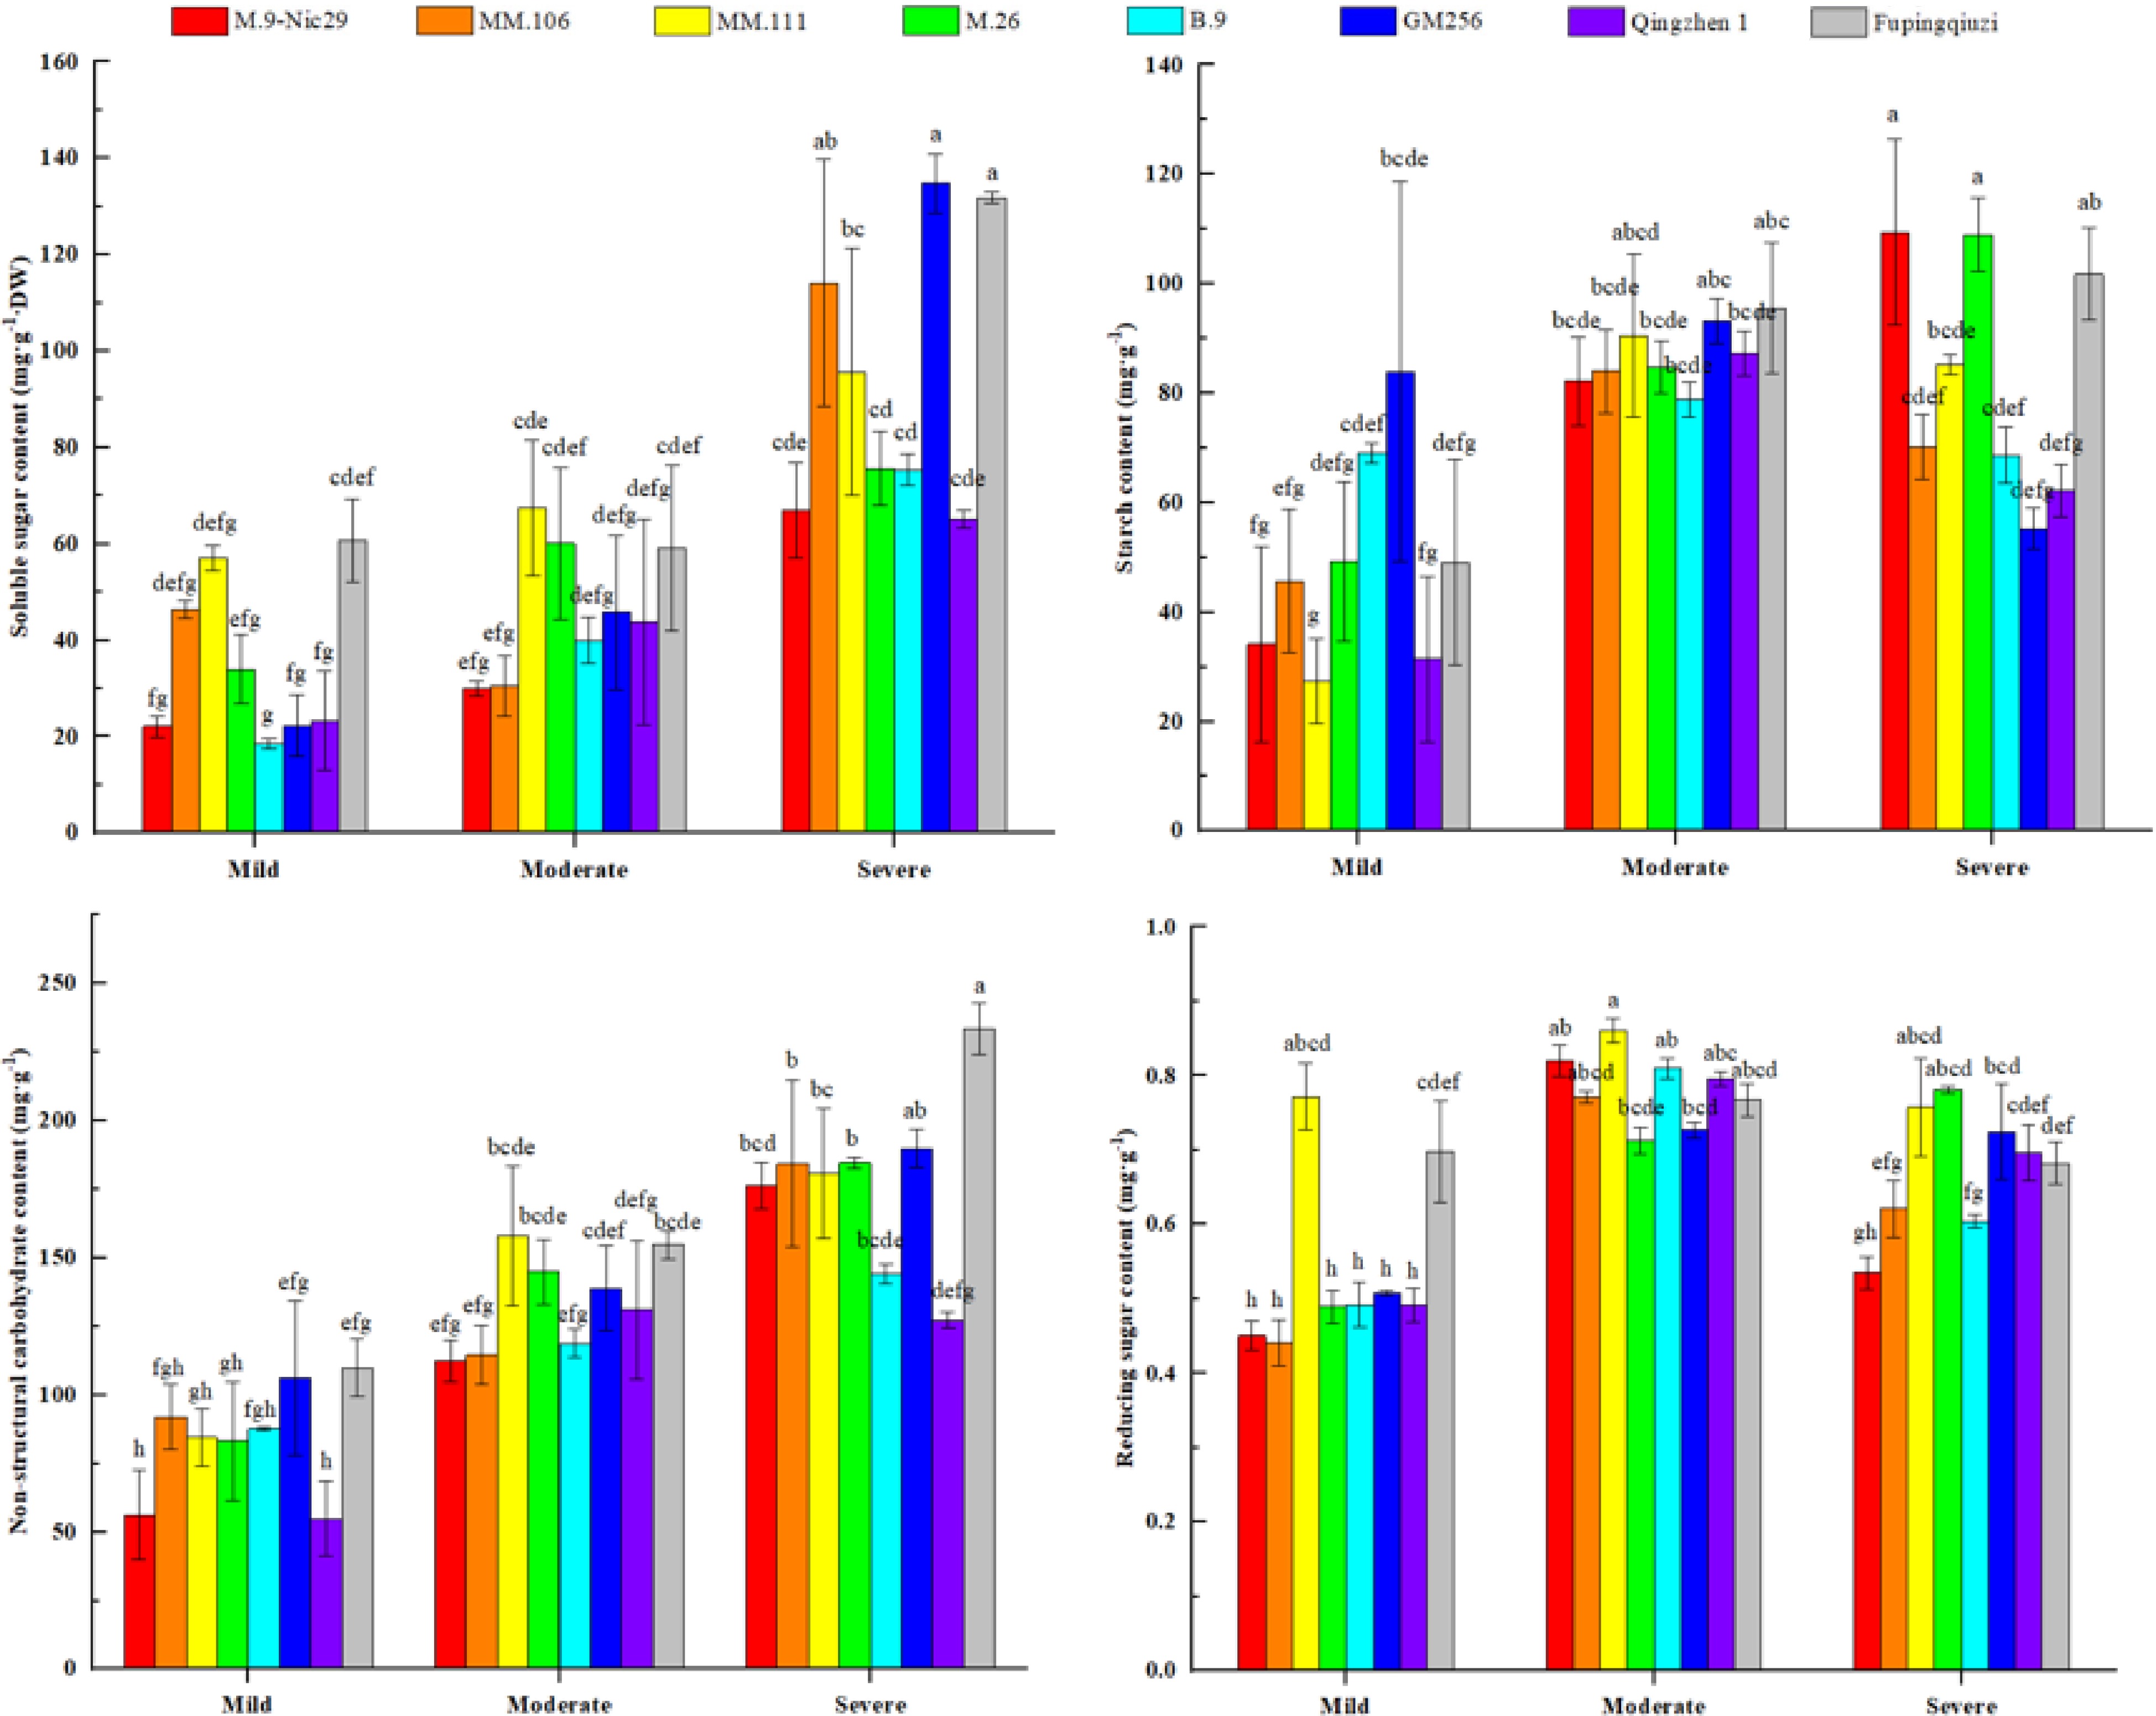
Figure 8.
The effect of different levels of drought on non-structural carbohydrates (NSC) and reducing sugar content in leaves of different apple rootstocks. Samples were harvested when the relative soil water content reached 65%–75% (mild drought stress), 45%–55% (moderate drought stress), and 25%–35% (severe drought stress). Error bars refer to the average value ± SD from three biological replicates. Different letters indicate a significant difference at p < 0.05.
-
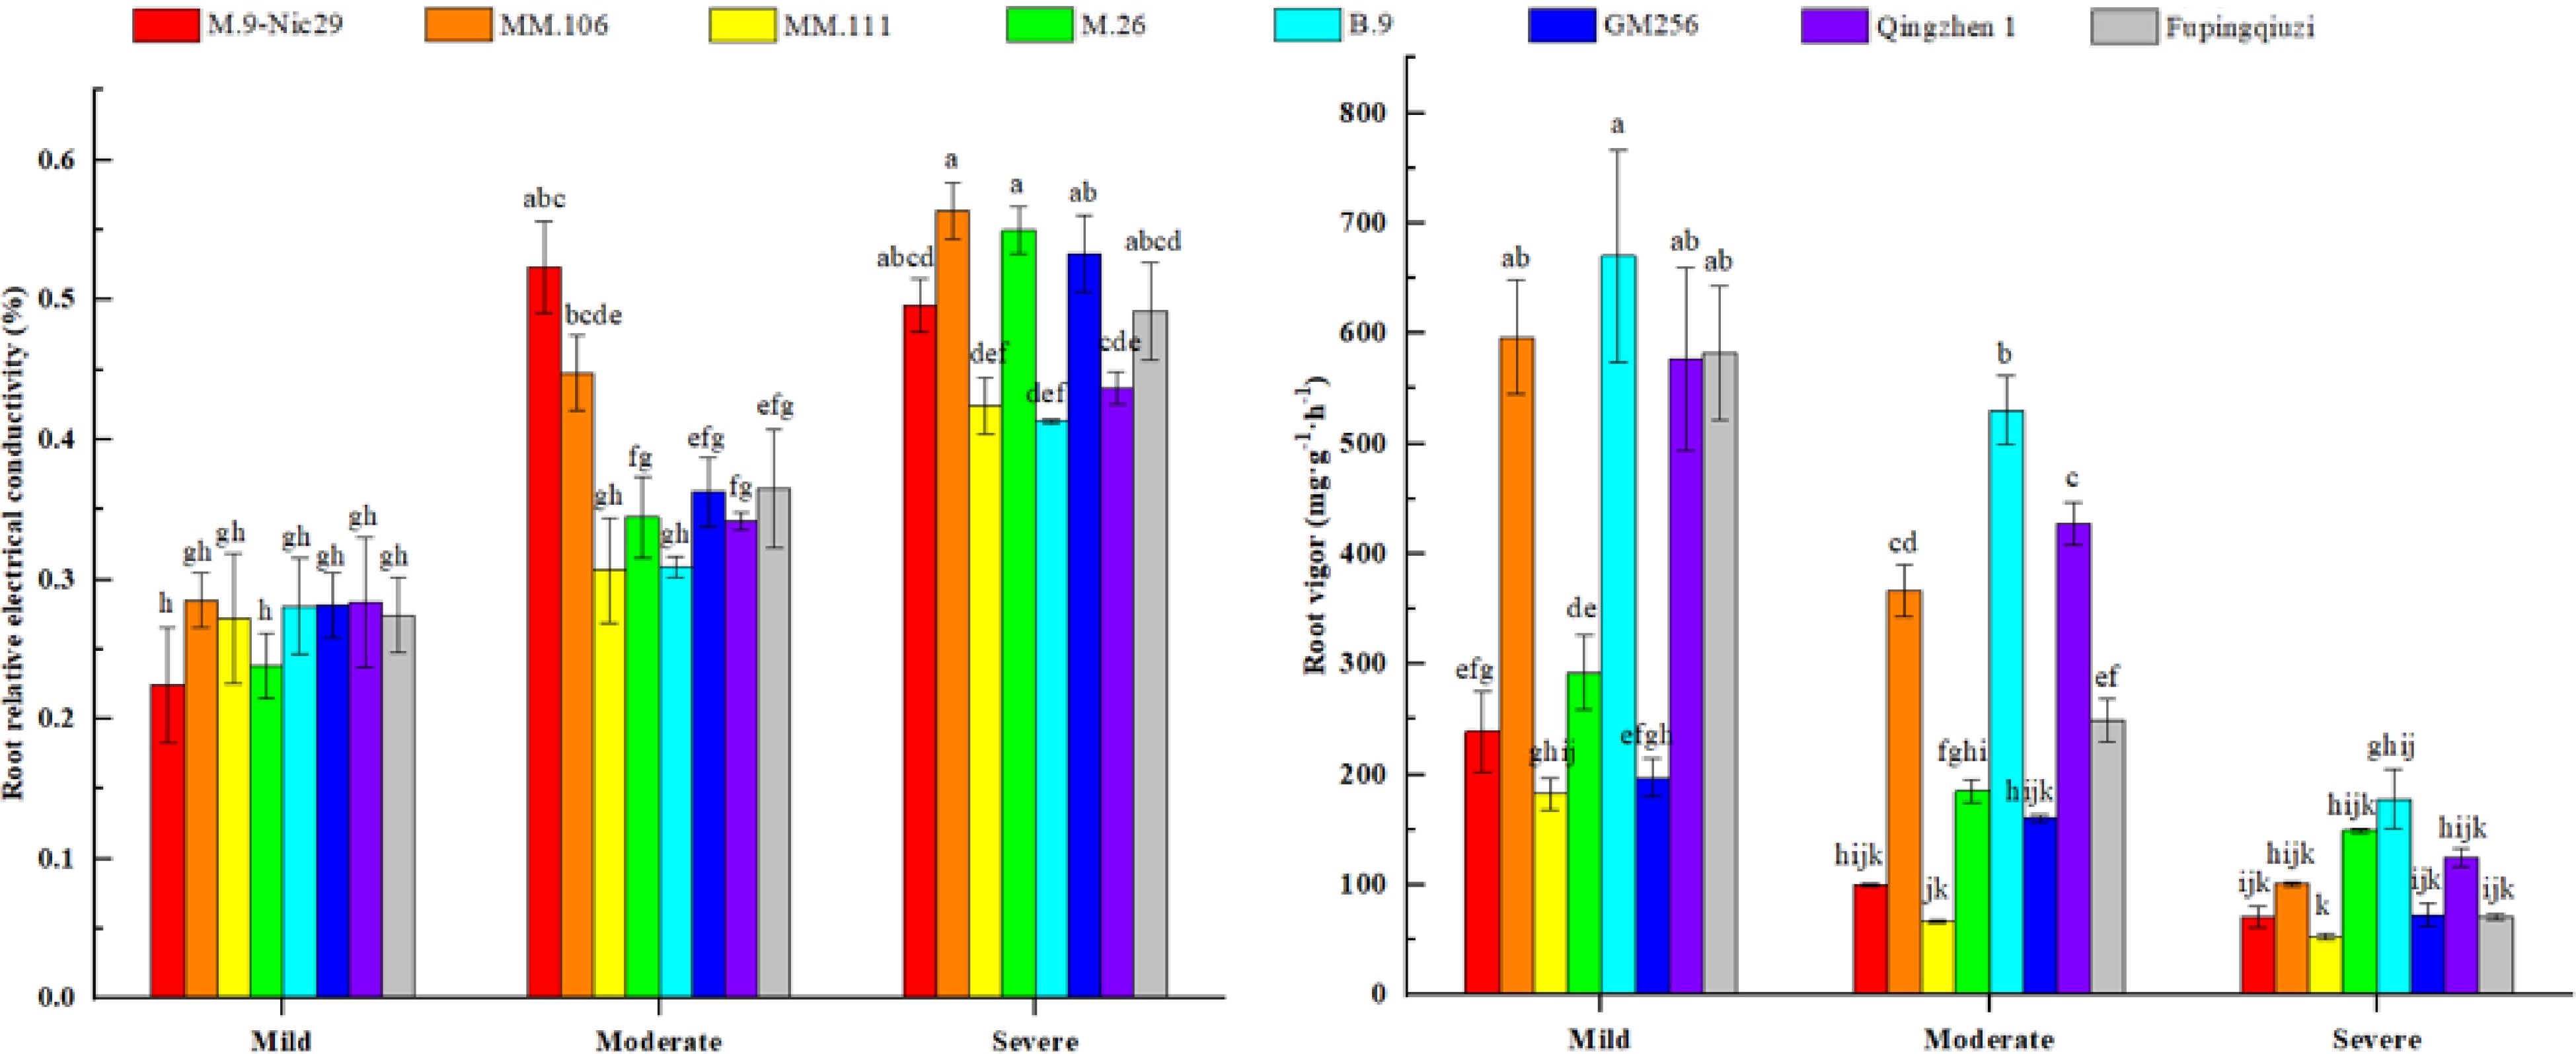
Figure 9.
The effect of different levels of drought on the relative electrical conductivity and root vigor of different apple rootstocks. Samples were harvested when the relative soil water content reached 65%–75% (mild drought stress), 45%–55% (moderate drought stress), and 25%–35% (severe drought stress). Error bars refer to the average value ± SD from three biological replicates. Different letters indicate a significant difference at p < 0.05.
-
Thickness (μm) 'M.9-Nic29' 'MM.106' 'MM.111' 'M.26' 'B.9' 'GM256' 'Qingzhen 1' 'Fupingqiuzi' Leaf thickness 155.2 ± 9 f 226.5 ± 5 b 218.7±7 bc 155.1 ± 3 e 191.8 ± 4 de 179.8 ± 4 f 202.6 ± 4 cd 292.1 ± 13 a Upper epidermis thickness 18.6 ± 1 ab 19.0 ± 1 a 17.1 ± 1 ab 16.1 ± 1 abcd 14.0 ± 1 cd 15.7 ± 1 bcd 13.4 ± 1 d 16.5 ± 1 abc Palisade tissue thickness 66.1 ± 5 d 94.6 ± 1 b 86.0 ± 4 bc 65.5 ± 5 d 71.6 ± 5 cd 70.4 ± 4 cd 83.1 ± 5 bc 114.0 ± 10 a Sponge tissue thickness 60.4 ± 7 e 103.8 ± 3 bc 108.8 ± 8 b 67.8 ± 6 de 100.7 ± 6 bc 84.4 ± 3 cd 96.7 ± 10 bc 148.5 ± 6 a Different letters indicate significant differences at the 0.05 level. Table 1.
The anatomical structure index values of leaves of different rootstocks.
-
Indexes Membership function value 'M.9-Nic29' 'MM.106' 'MM.111' 'M.26' 'B.9' 'GM256' 'Qingzhen 1' 'Fupingqiuzi' Pn 0.340 0.405 0.000 0.918 0.869 0.688 0.183 1.000 Gs 0.638 0.489 0.973 0.259 0.934 0.508 1.000 0.000 Ci 0.307 0.390 0.205 0.237 0.180 0.522 1.000 0.000 Tr 0.500 0.000 0.821 0.000 0.500 0.321 1.000 0.071 WUE 0.589 0.000 0.268 0.640 0.832 0.617 1.000 0.404 Chlorophyll 0.755 0.577 0.000 0.478 0.770 0.476 0.674 1.000 Carotenoid 0.829 0.429 0.000 0.035 0.628 0.163 0.704 1.000 Soluble sugar 0.000 0.542 0.764 0.382 0.112 0.631 0.100 1.000 Starch 0.684 0.288 0.337 0.947 0.545 0.784 0.000 1.000 NSC 0.171 0.420 0.596 0.538 0.202 0.659 0.000 1.000 Reducing sugar 0.000 0.049 1.000 0.305 0.172 0.264 0.305 0.586 Relative water content of leaves 0.221 0.485 0.721 0.367 0.037 0.000 1.000 0.668 Root relative Conductivity 0.178 0.000 1.000 0.555 0.999 0.406 0.797 0.561 Root vitality 0.100 0.708 0.000 0.301 1.000 0.119 0.768 0.558 Leaf thickness 0.004 0.521 0.464 0.000 0.268 0.180 0.346 1.000 Upper epidermis thickness 0.927 1.000 0.659 0.493 0.051 0.419 0.000 0.554 Palisade tissue thickness 0.012 0.601 0.424 0.000 0.126 0.100 0.363 1.000 Sponge tissue thickness 0.000 0.493 0.550 0.084 0.457 0.273 0.412 1.000 ${\text Φ} $ 

0.119 0.500 0.000 0.657 0.948 0.138 0.519 1.000 NPQ 1.000 0.145 0.000 0.718 0.761 0.952 0.564 0.892 Average score 0.369 0.402 0.439 0.396 0.520 0.411 0.537 0.715 Rank 8 6 4 7 3 5 2 1 Photosynthetic rate (Pn), transpiration rate (Tr), intercellular CO2 concentration (Ci), stomatal conductance (Gs), water use efficiency (WUE), non-structural carbohydrate (NSC), photochemical efficiency of PSII reaction centre (ΦPSII), and non-photochemical quenching coefficient (NPQ). Table 2.
Membership function value of drought resistance of different apple rootstock.
-
Genotype Species Dwarfing class Origin Parents 'M.9-Nic29' Malus domestica Borkh. Dwarfing Belgian Nursery Rene Nicolai N.V. M9 'MM.106' Malus domestica Borkh. Semi-vigorous East Malling Research, UK Junxiu × M1 'MM.111' Malus domestica Borkh. Vigorous East Malling Research, UK Junxiu × M1 'M.26' Malus domestica Borkh. Semi-Dwarfing East Malling Research, UK M.16 × M.9 'B.9' Malus domestica Borkh Dwarfing Michurin University of former the Soviet Union M.8 × Red Standard 'GM256' Malus domestica Borkh. Semi-dwarfing Fruit Tree Institute of Jilin Academy of Agricultural Sciences Malus Prunifolia (Willd.) Borkh. × M.9 'Qingzhen 1' No species name Semi-dwarfing Qingdao Agricultural Academy, China Malus domestica Borkh. × Malus hupehensis Rehd. 'Fupingqiuzi' Malus prunifolia (Willd.) Borkh. Vigorous China Natural seedlings of Malus prunifolia Borkh. Table 3.
Background information about rootstocks used in this study.
Figures
(9)
Tables
(3)