-
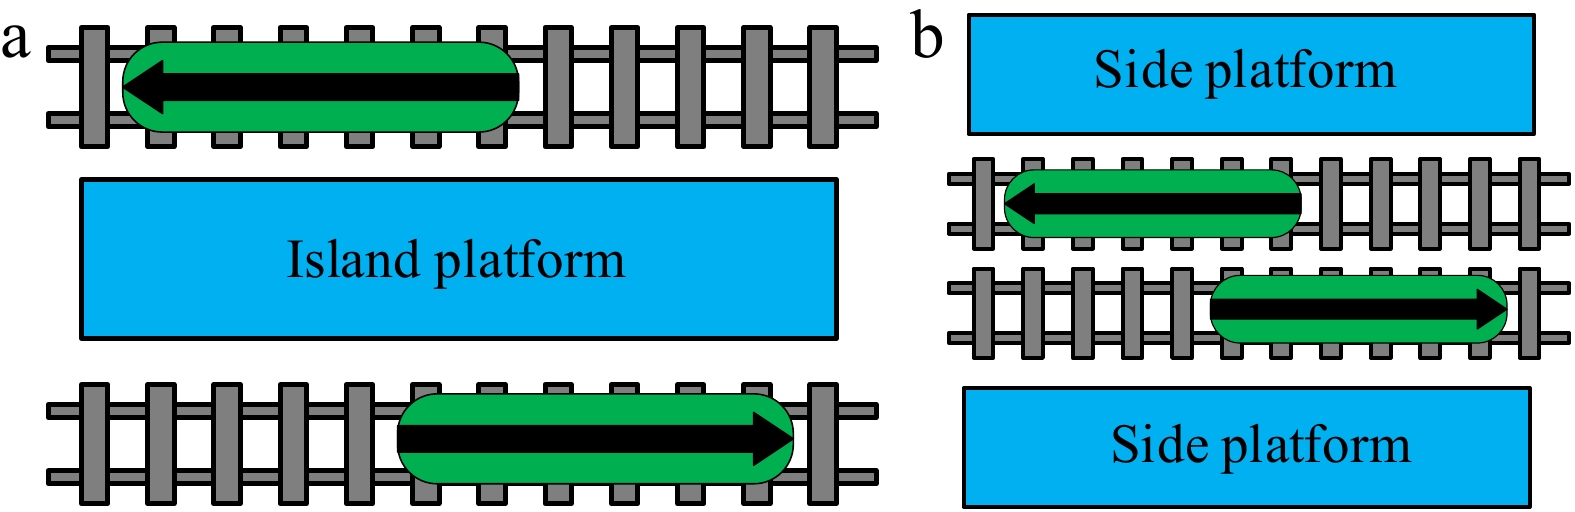
Figure 1.
Subway platform diagram.
-
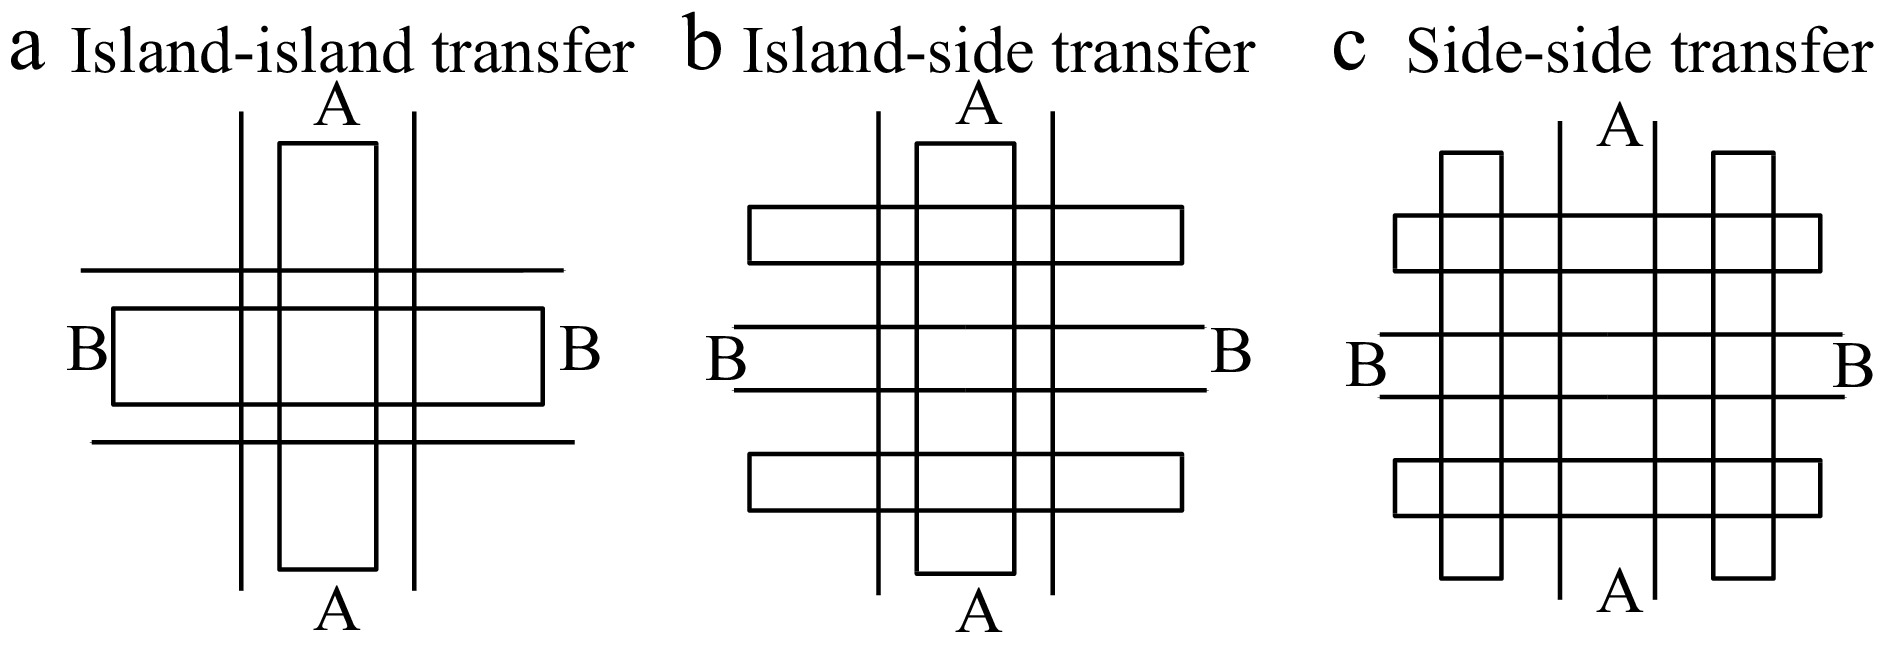
Figure 2.
Three forms of cross transfer diagram.
-
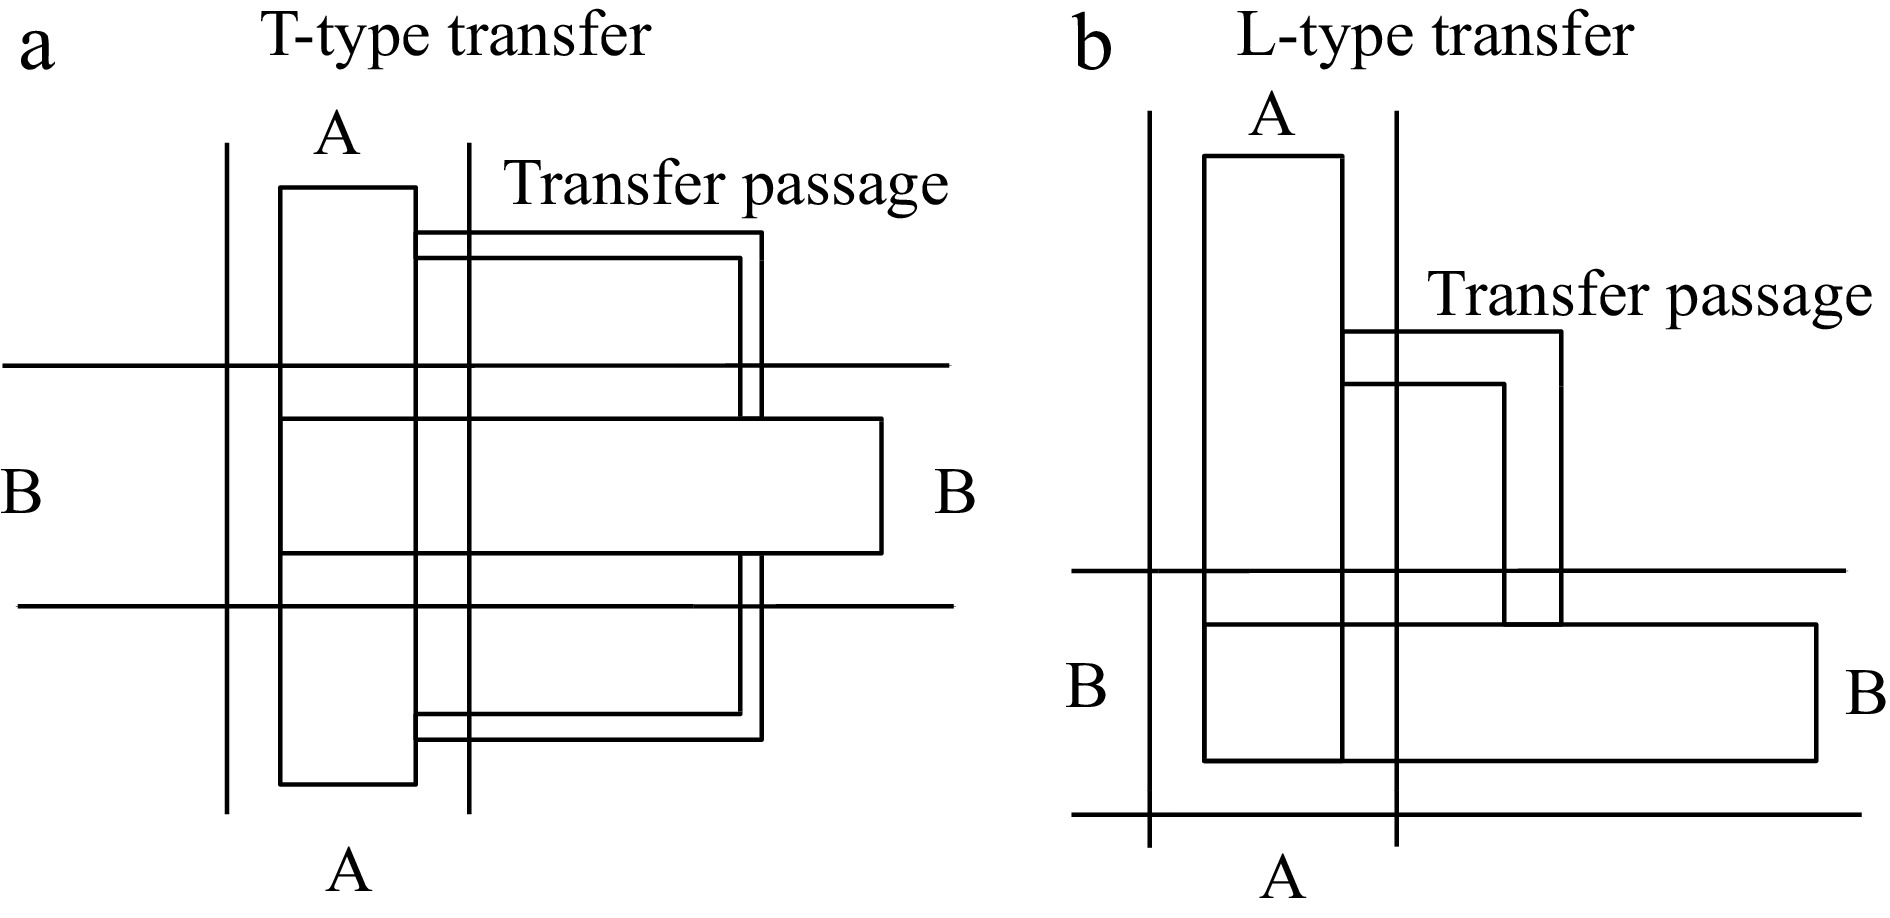
Figure 3.
T-type transfer and L-type transfer diagram.
-
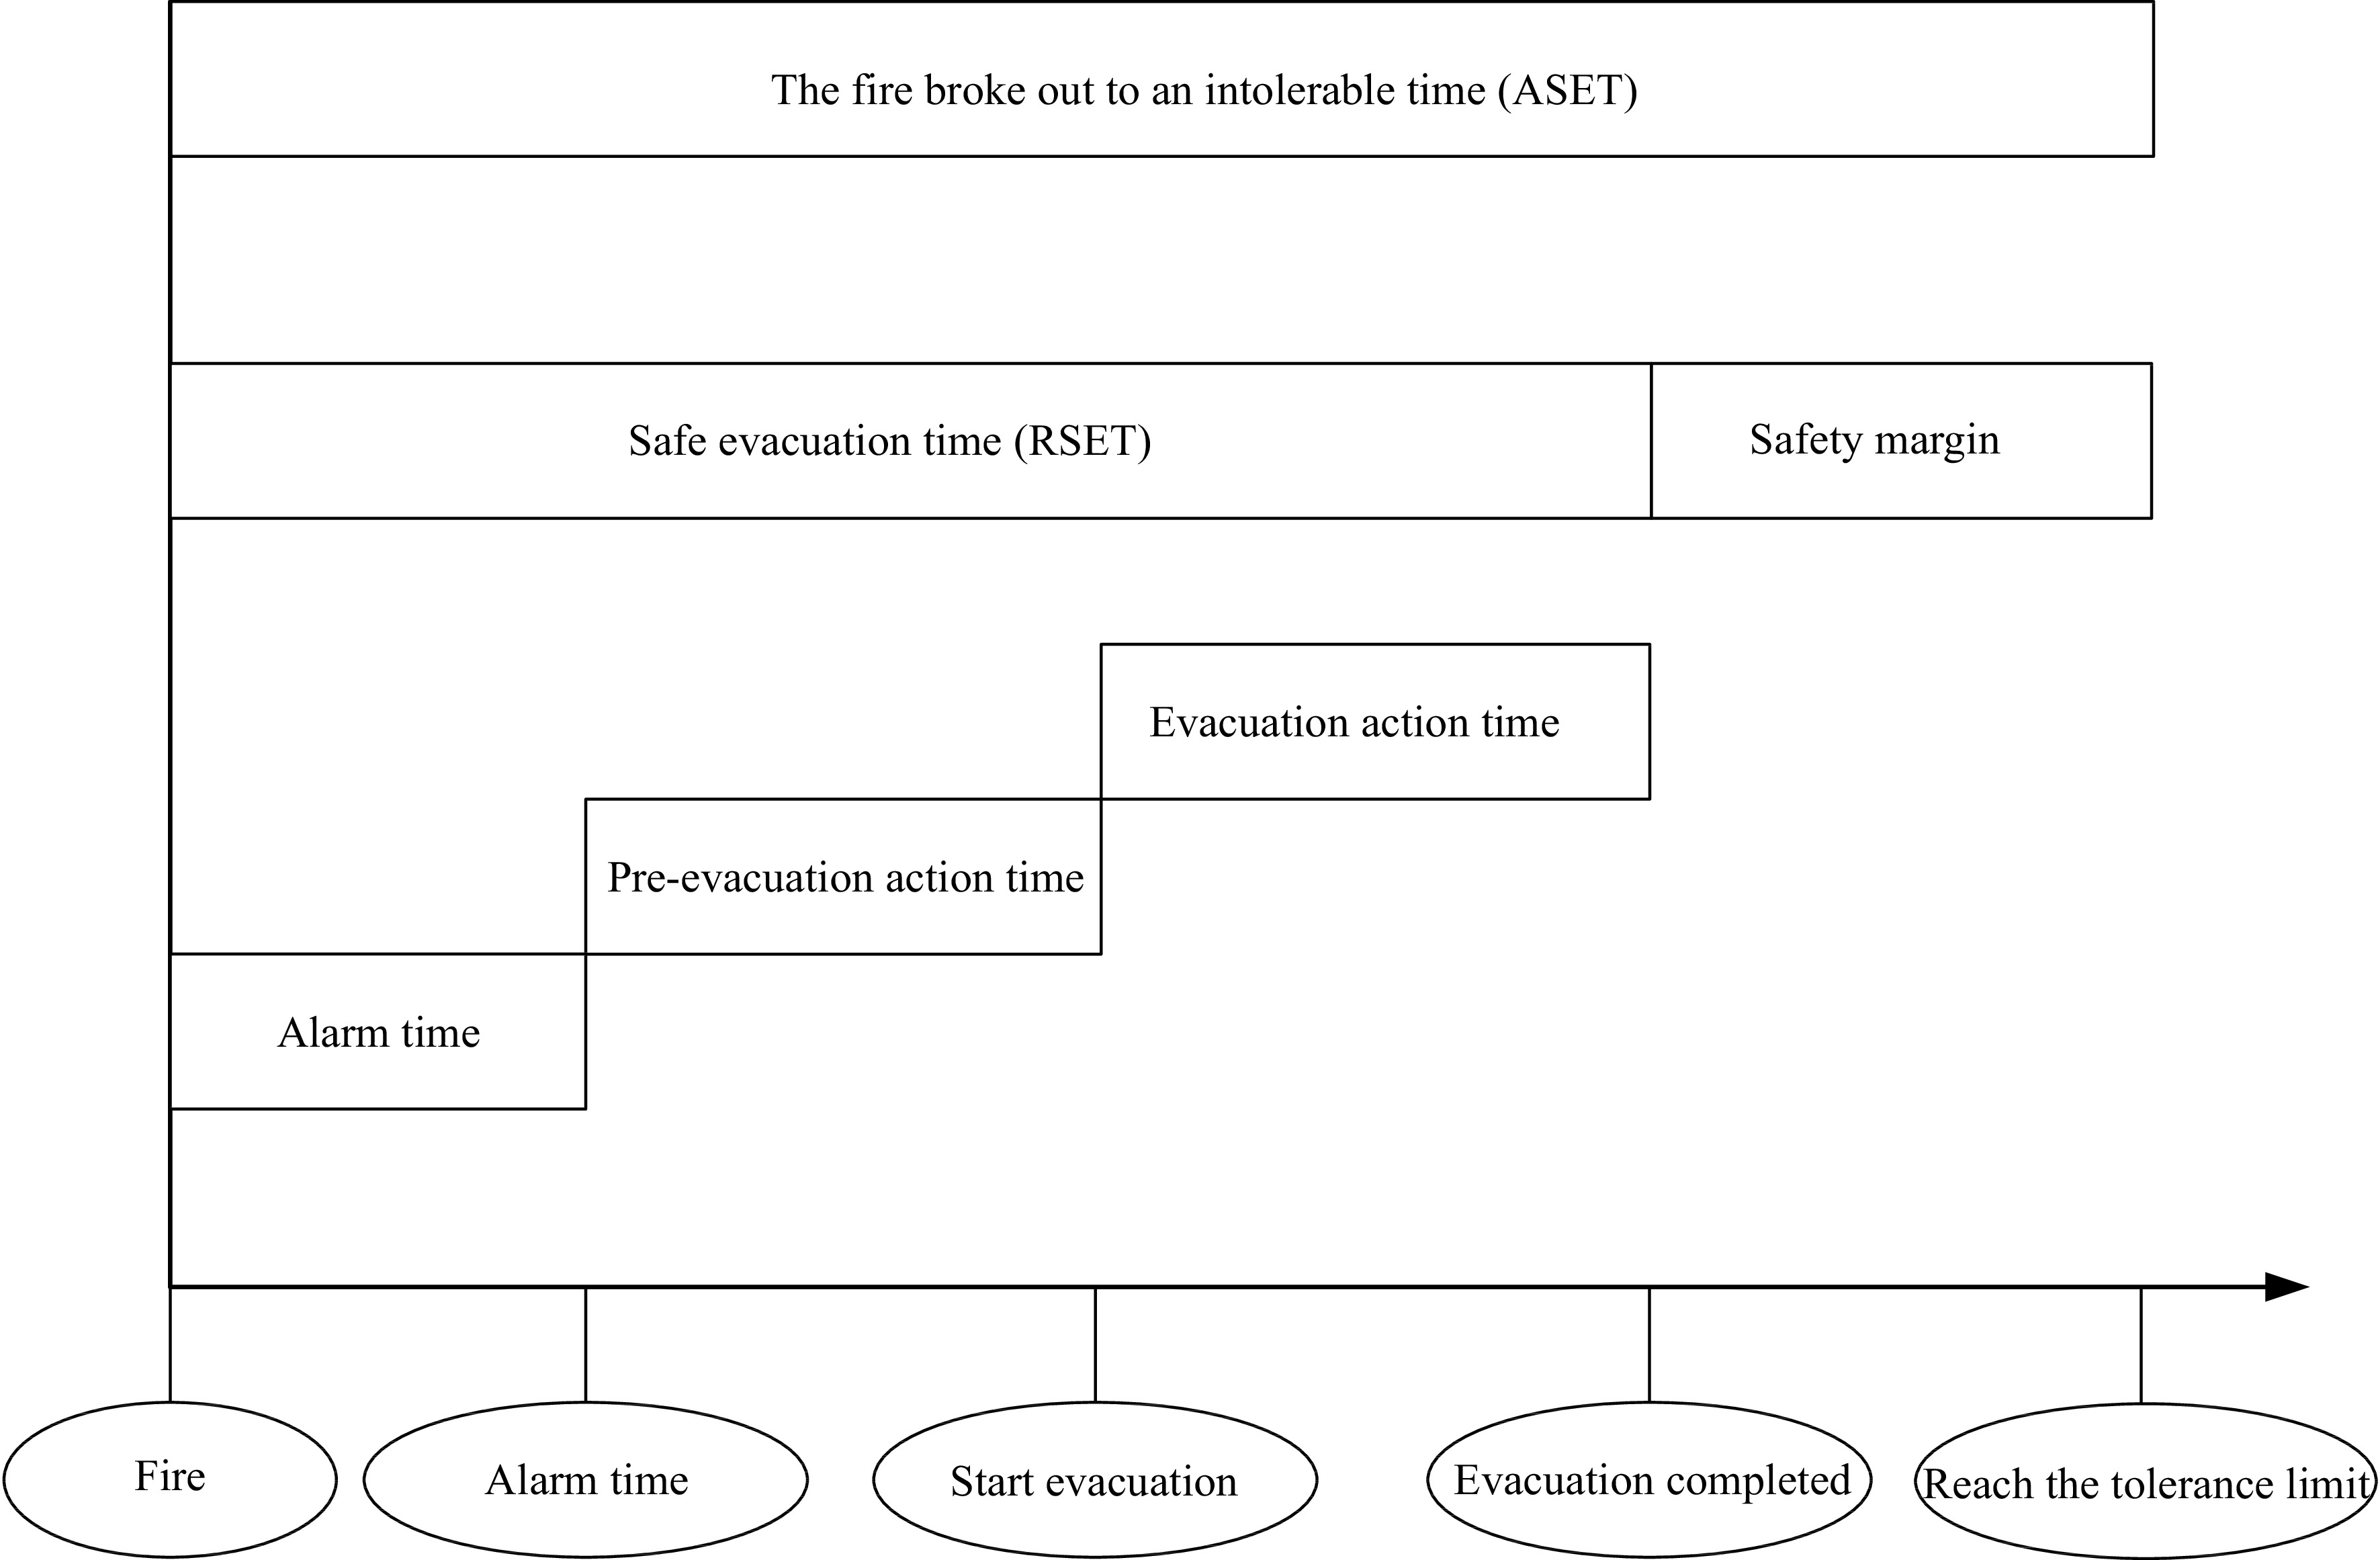
Figure 4.
Fire evacuation time diagram.
-
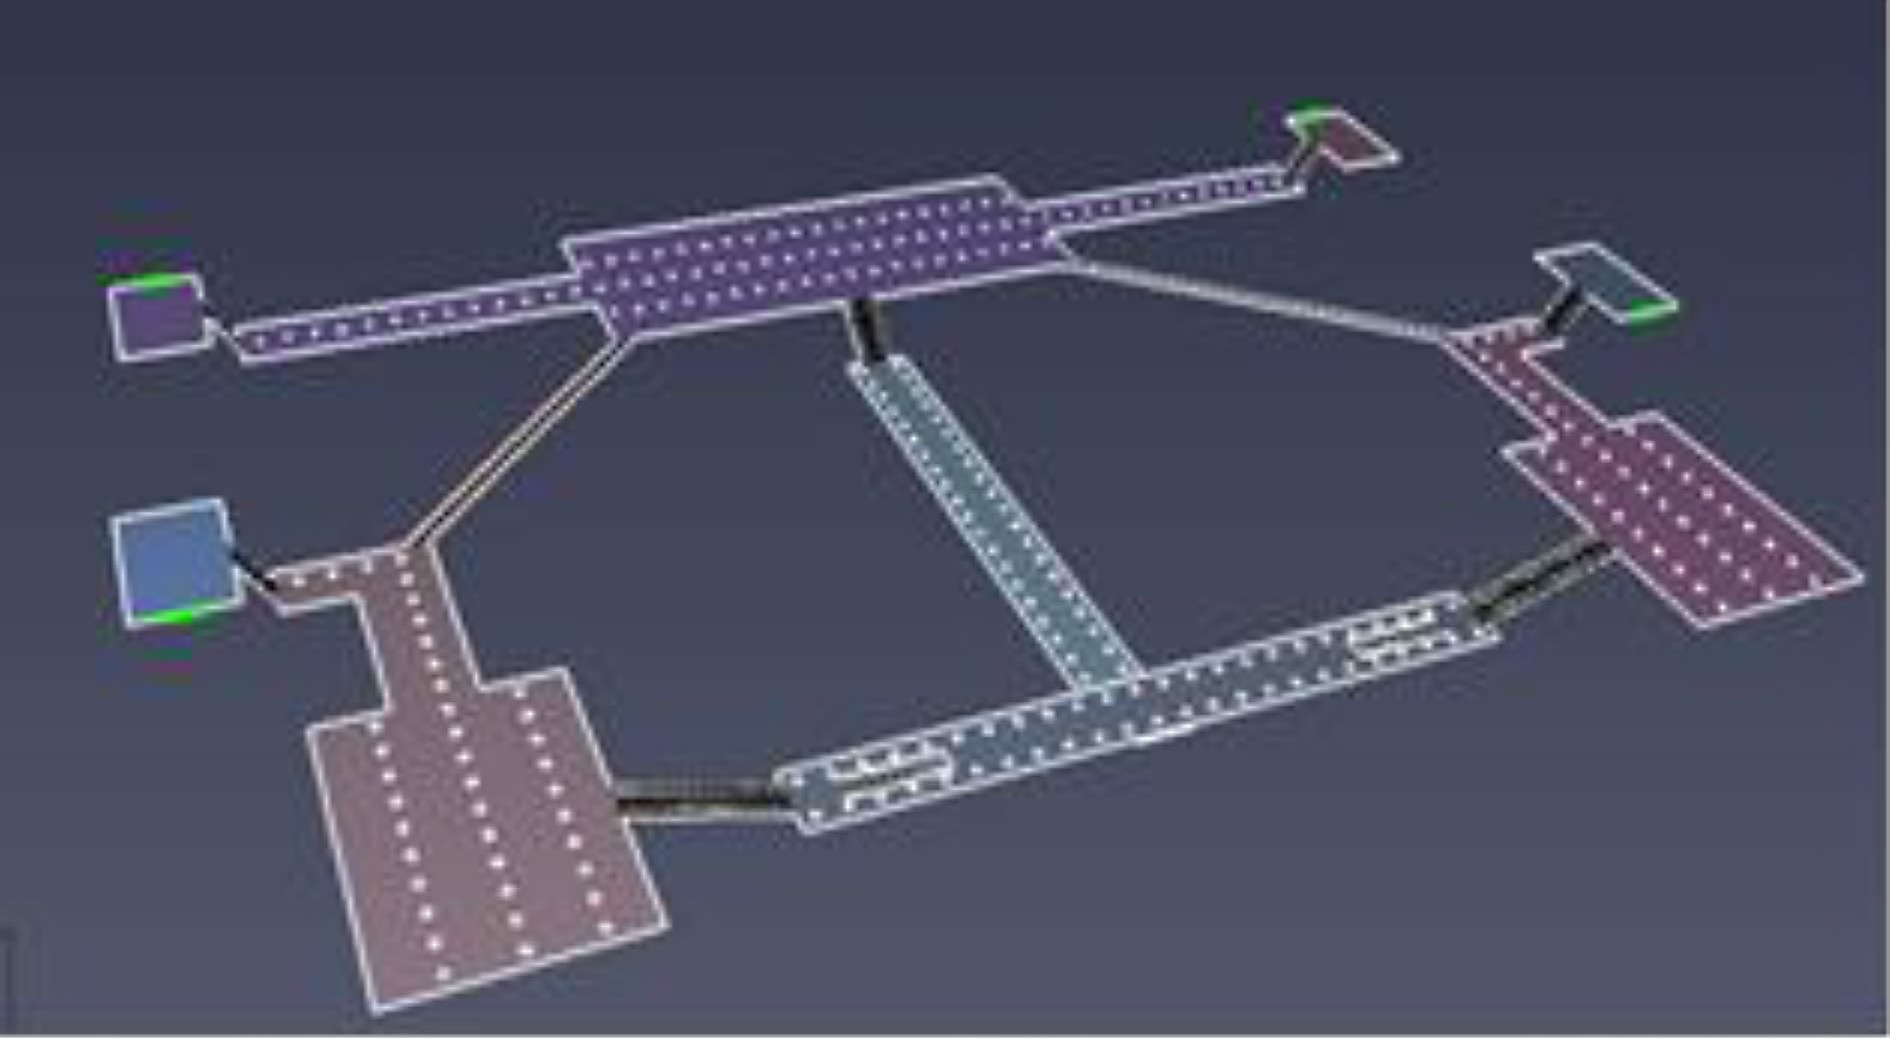
Figure 5.
Transfer station construction model diagram.
-
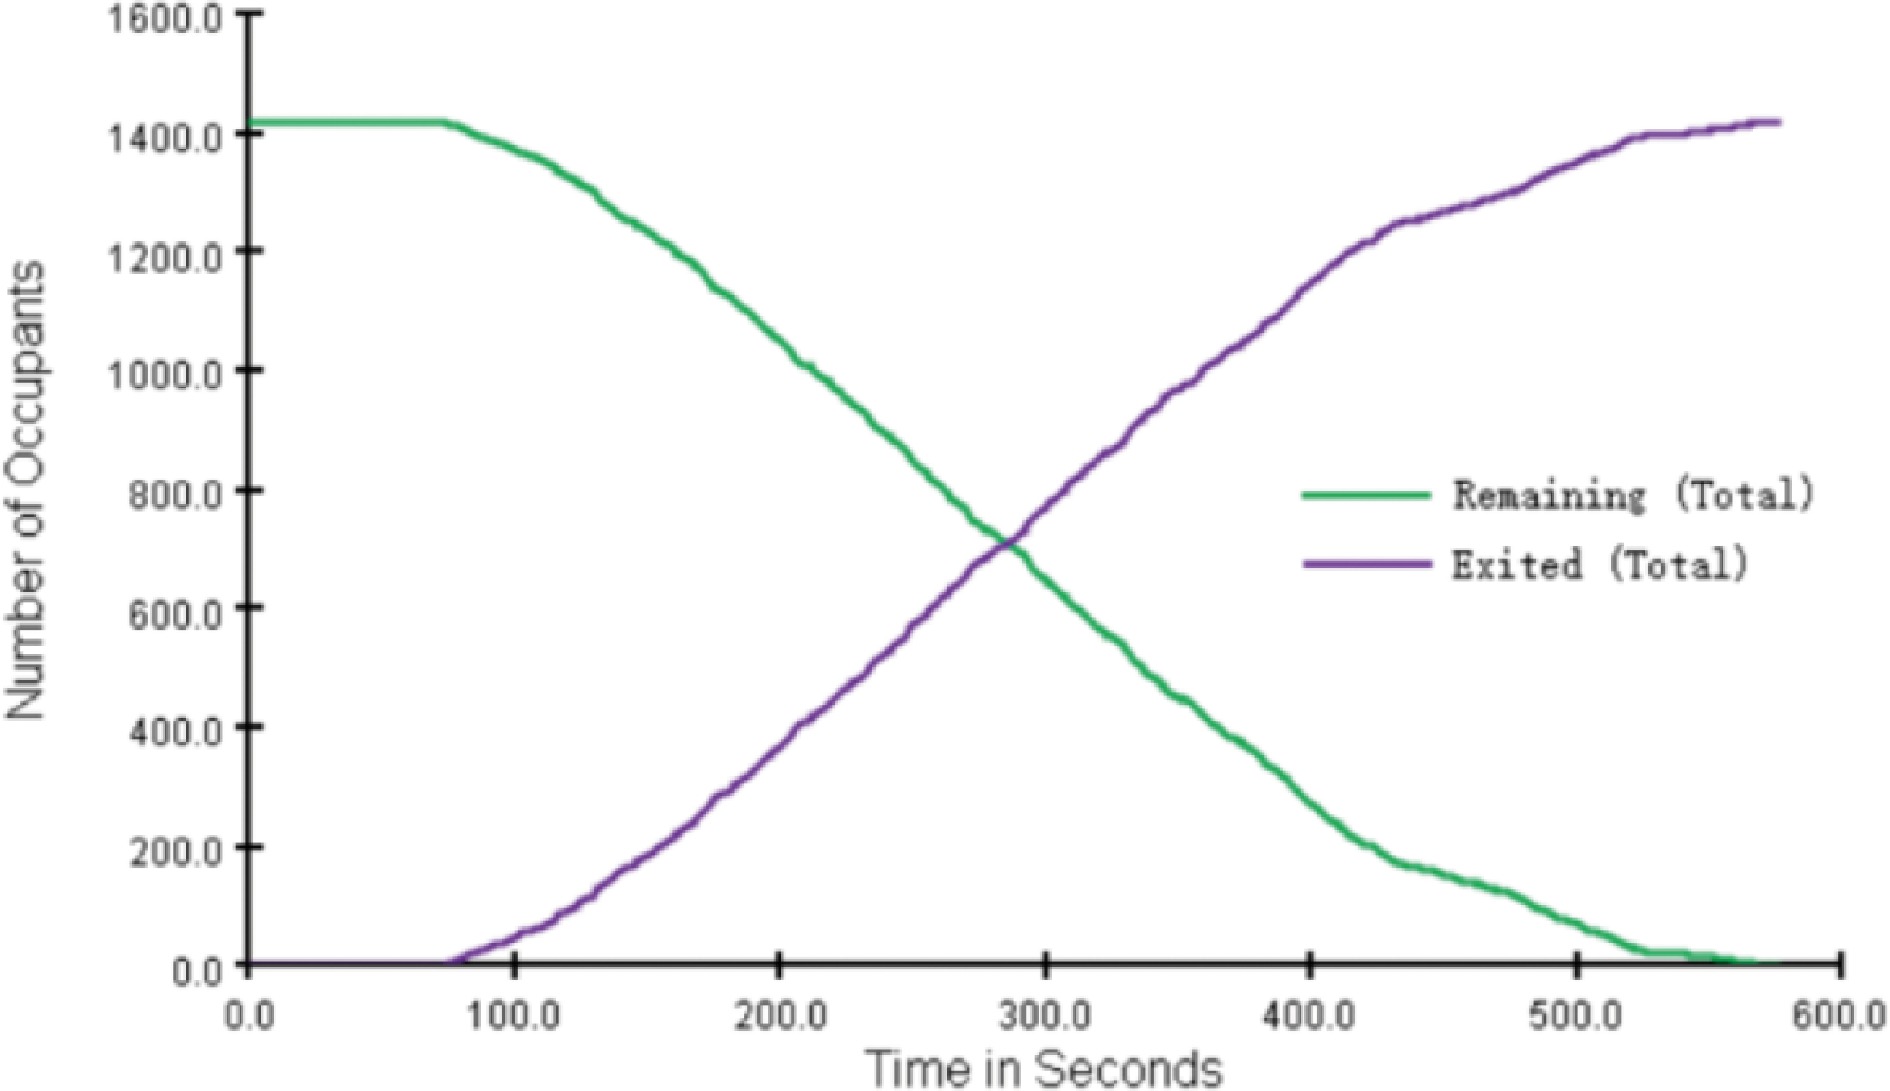
Figure 6.
Dynamic change curve of population.
-
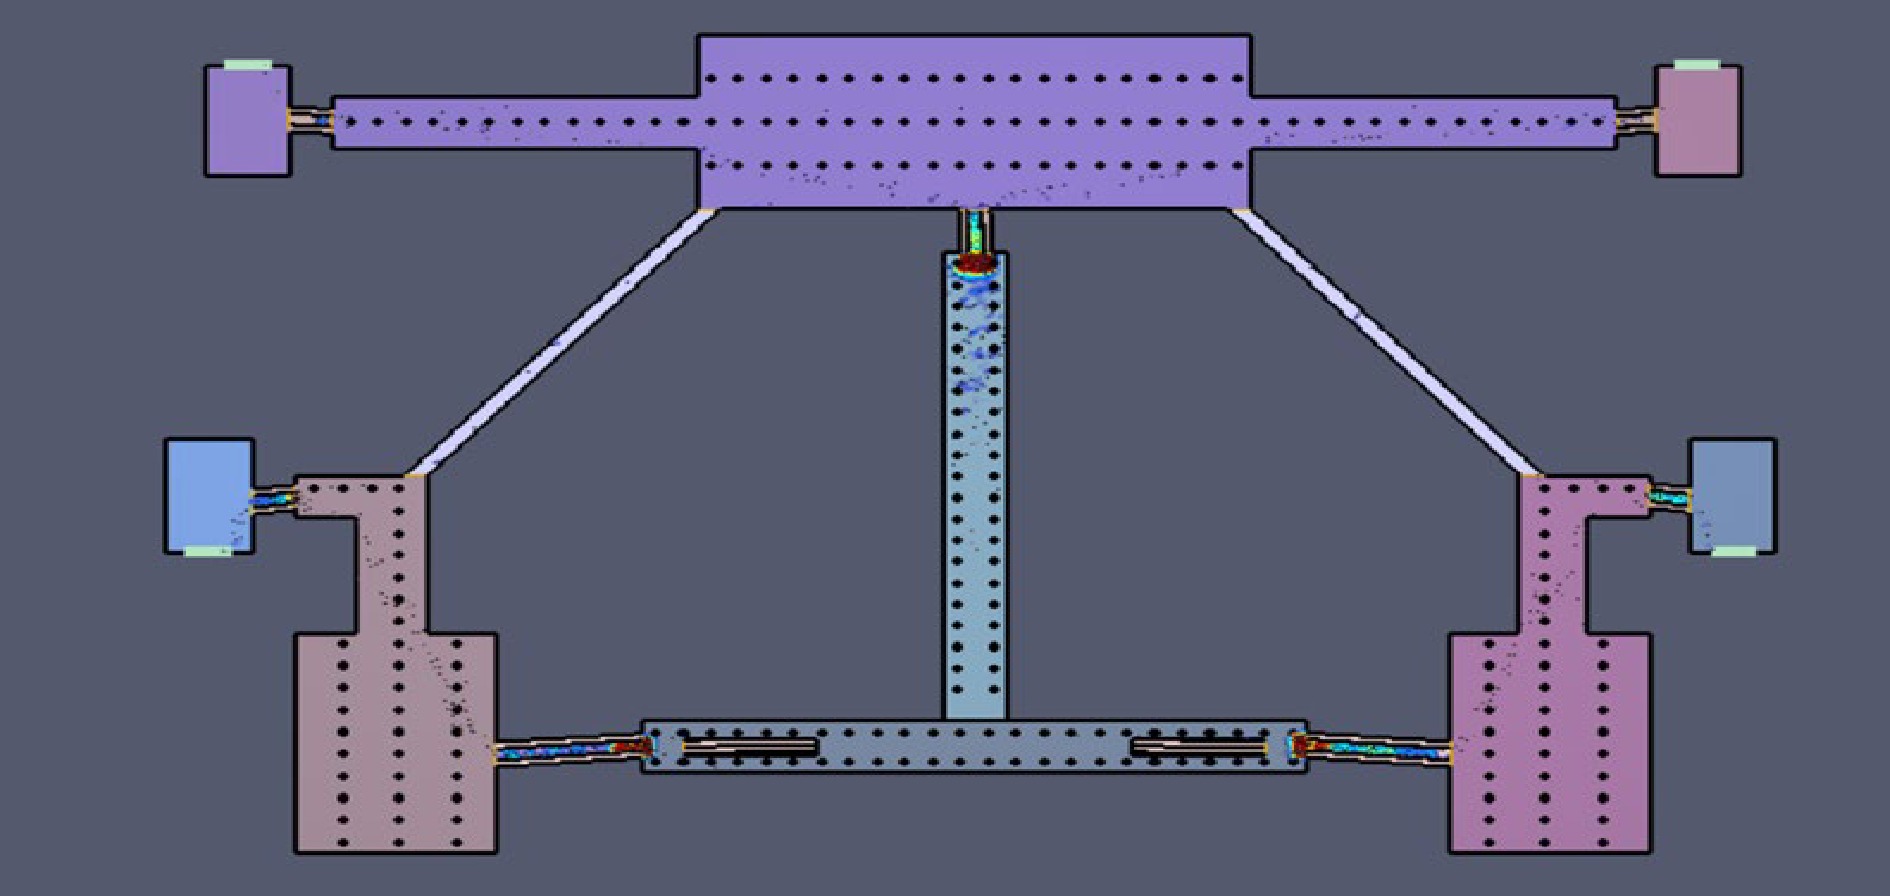
Figure 7.
Distribution map of crowd density at initial evacuation stage.
-
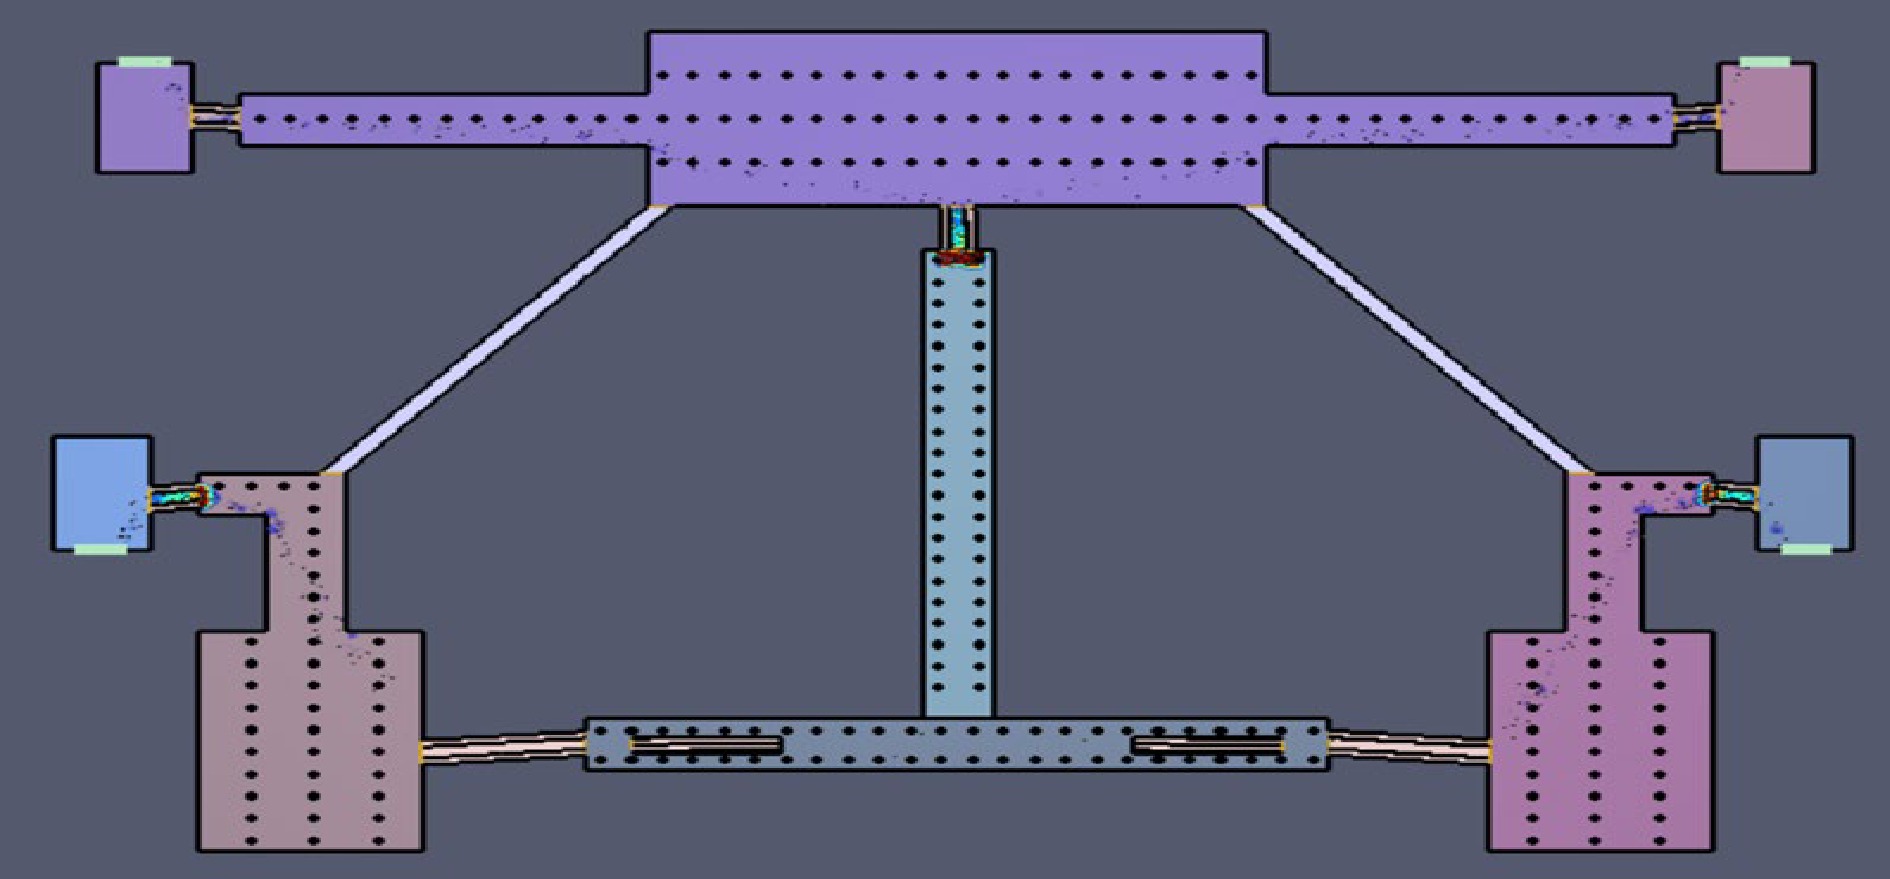
Figure 8.
Distribution map of crowd density at the end of the evacuation stage.
-
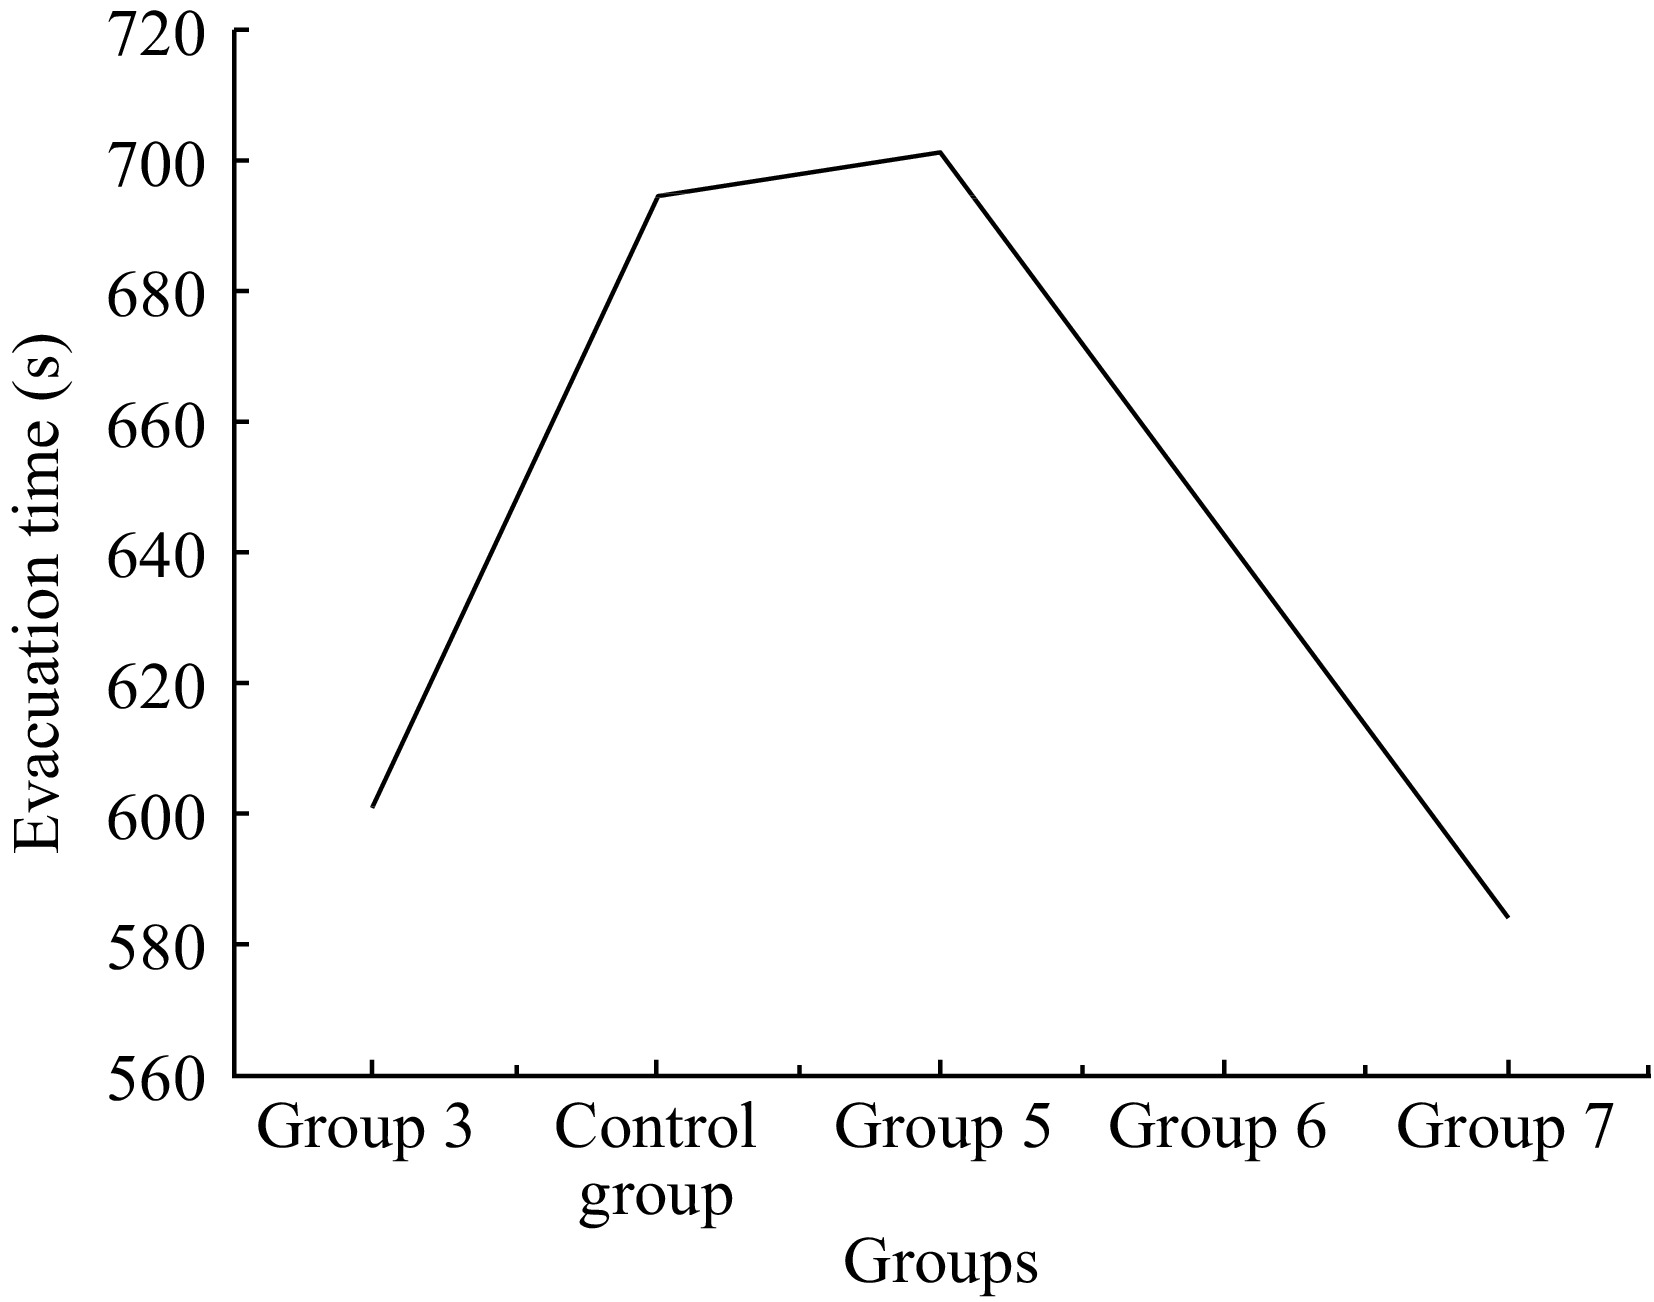
Figure 9.
Evacuation time changes with preference for stairs and escalators.
-
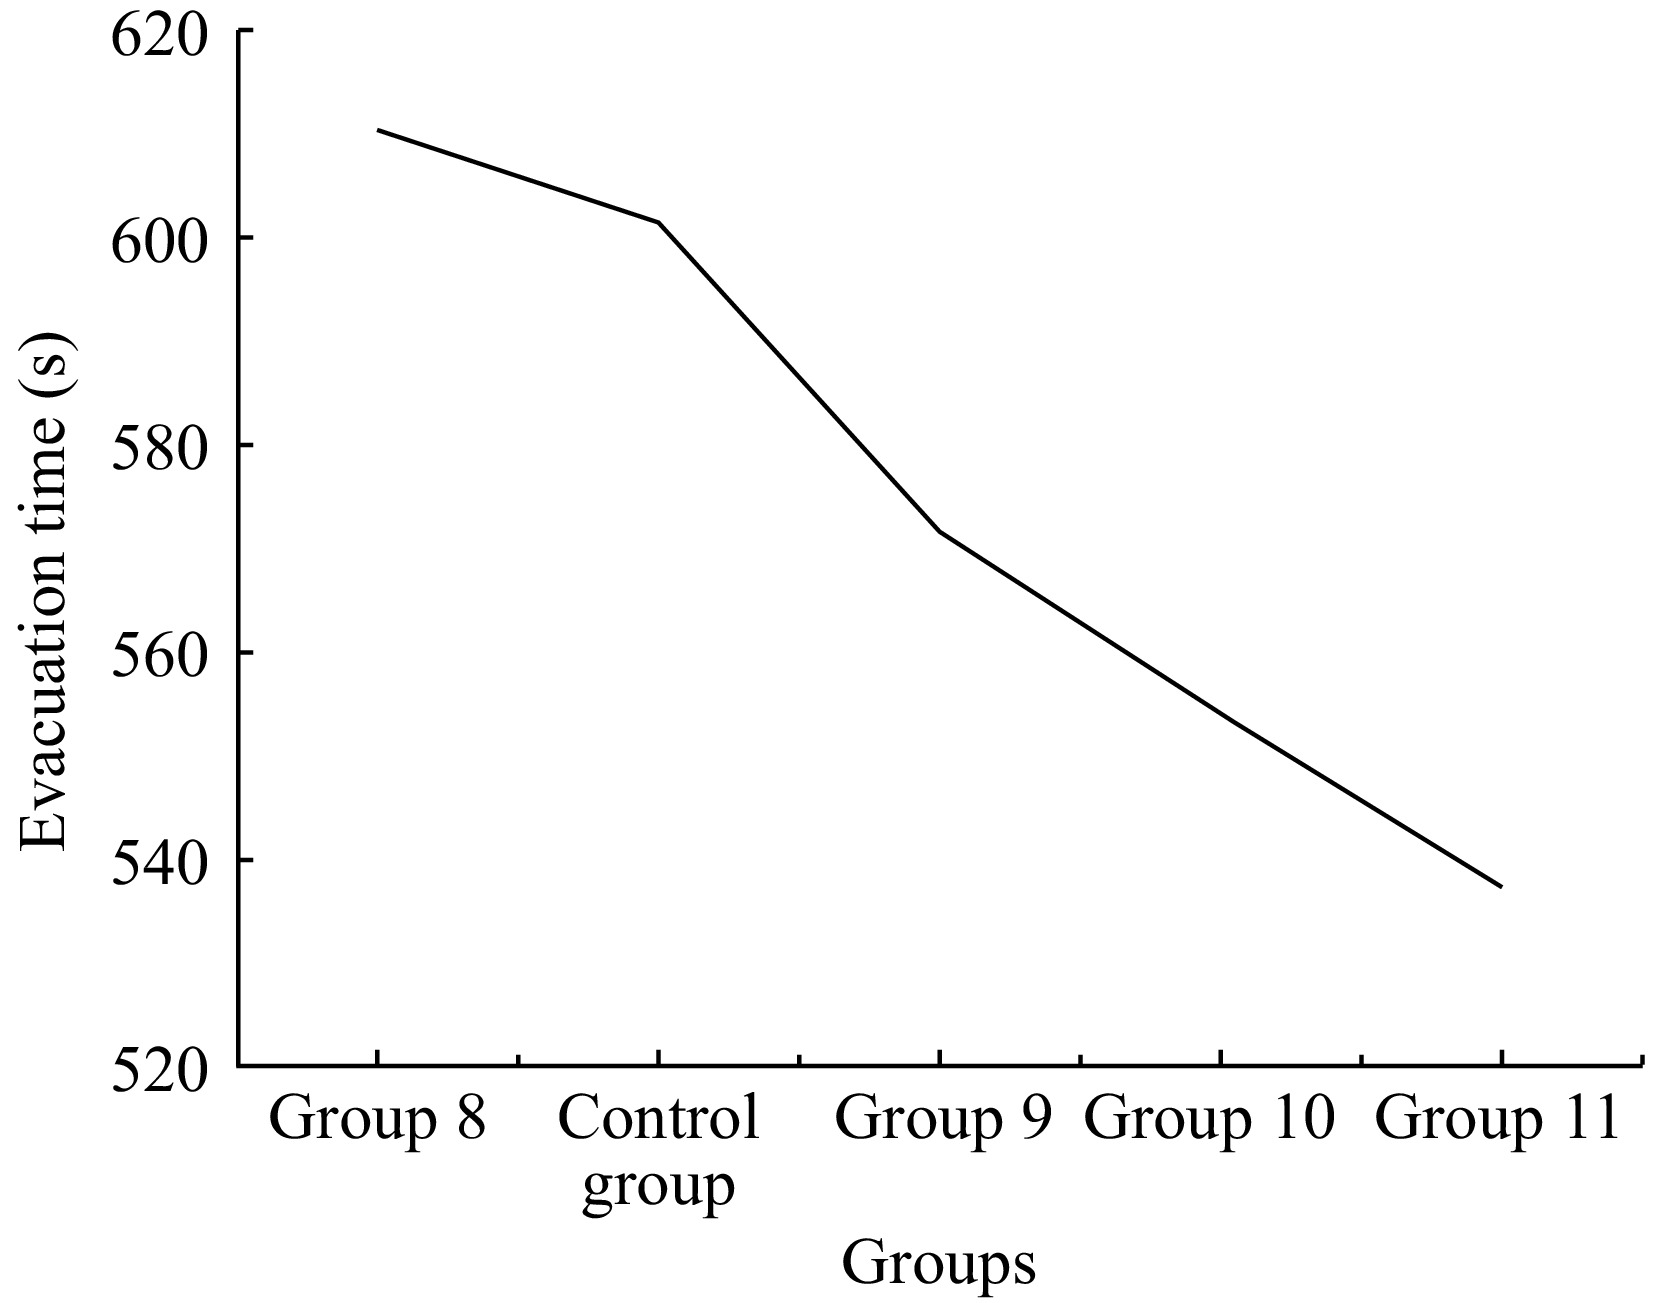
Figure 10.
Evacuation time changes with preference for stairs and escalators.
-
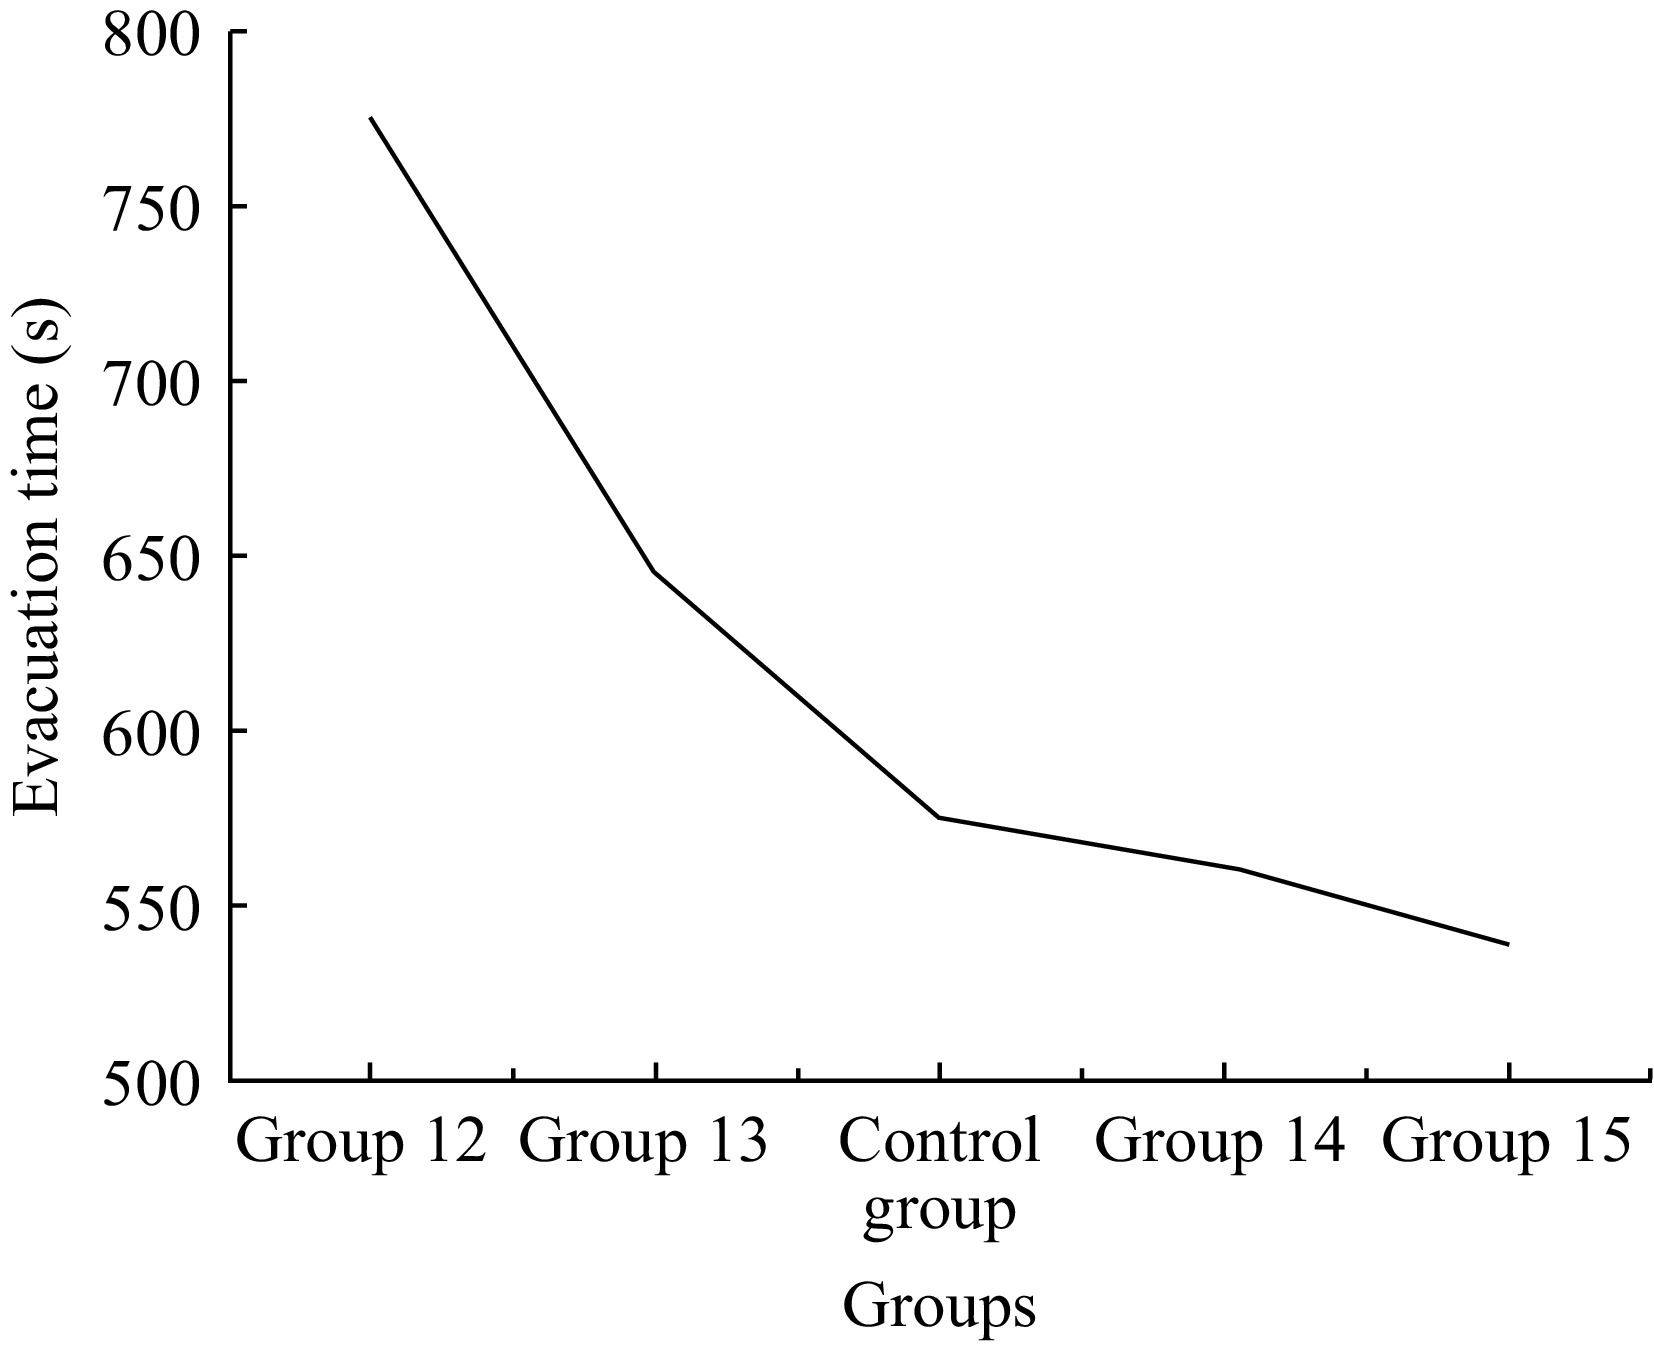
Figure 11.
Evacuation time vs. stairs width change diagram.
-
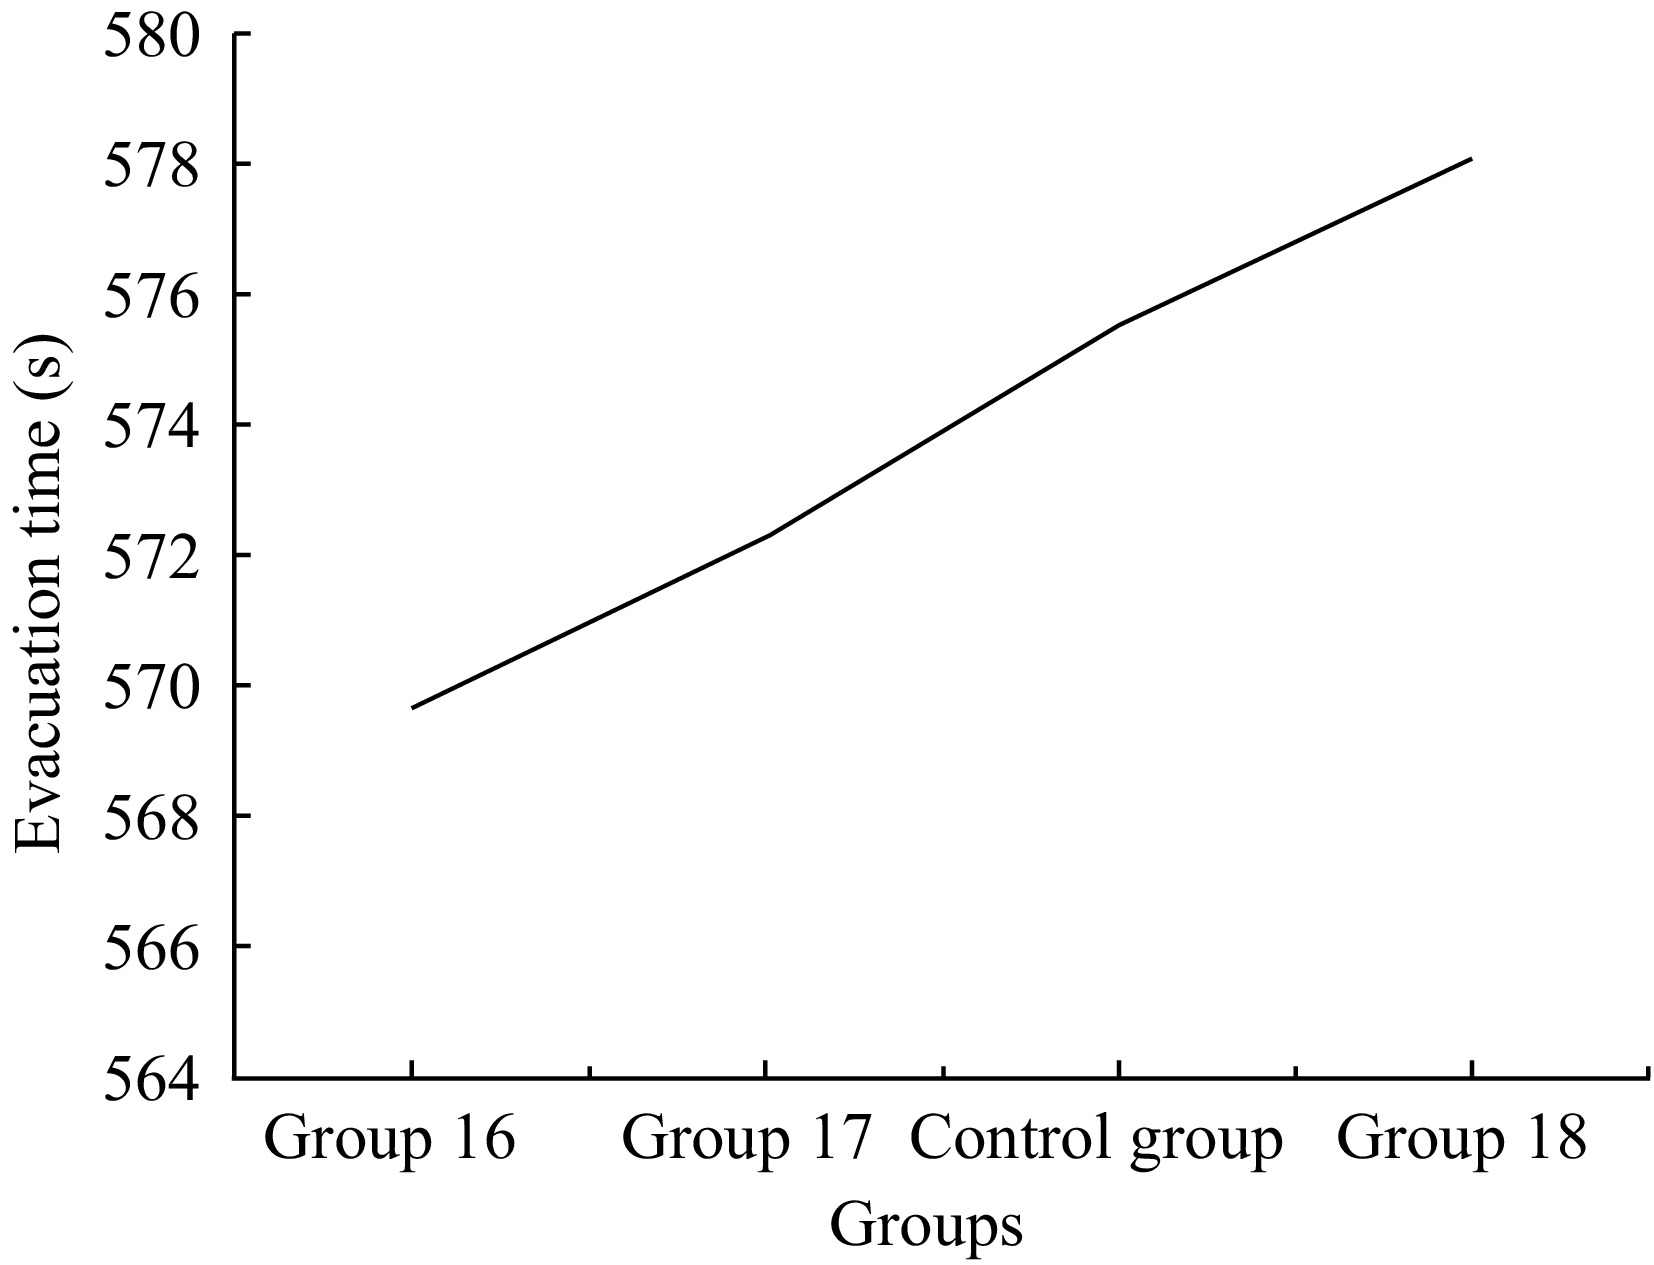
Figure 12.
Evacuation time vs. exit familiarity change diagram.
-
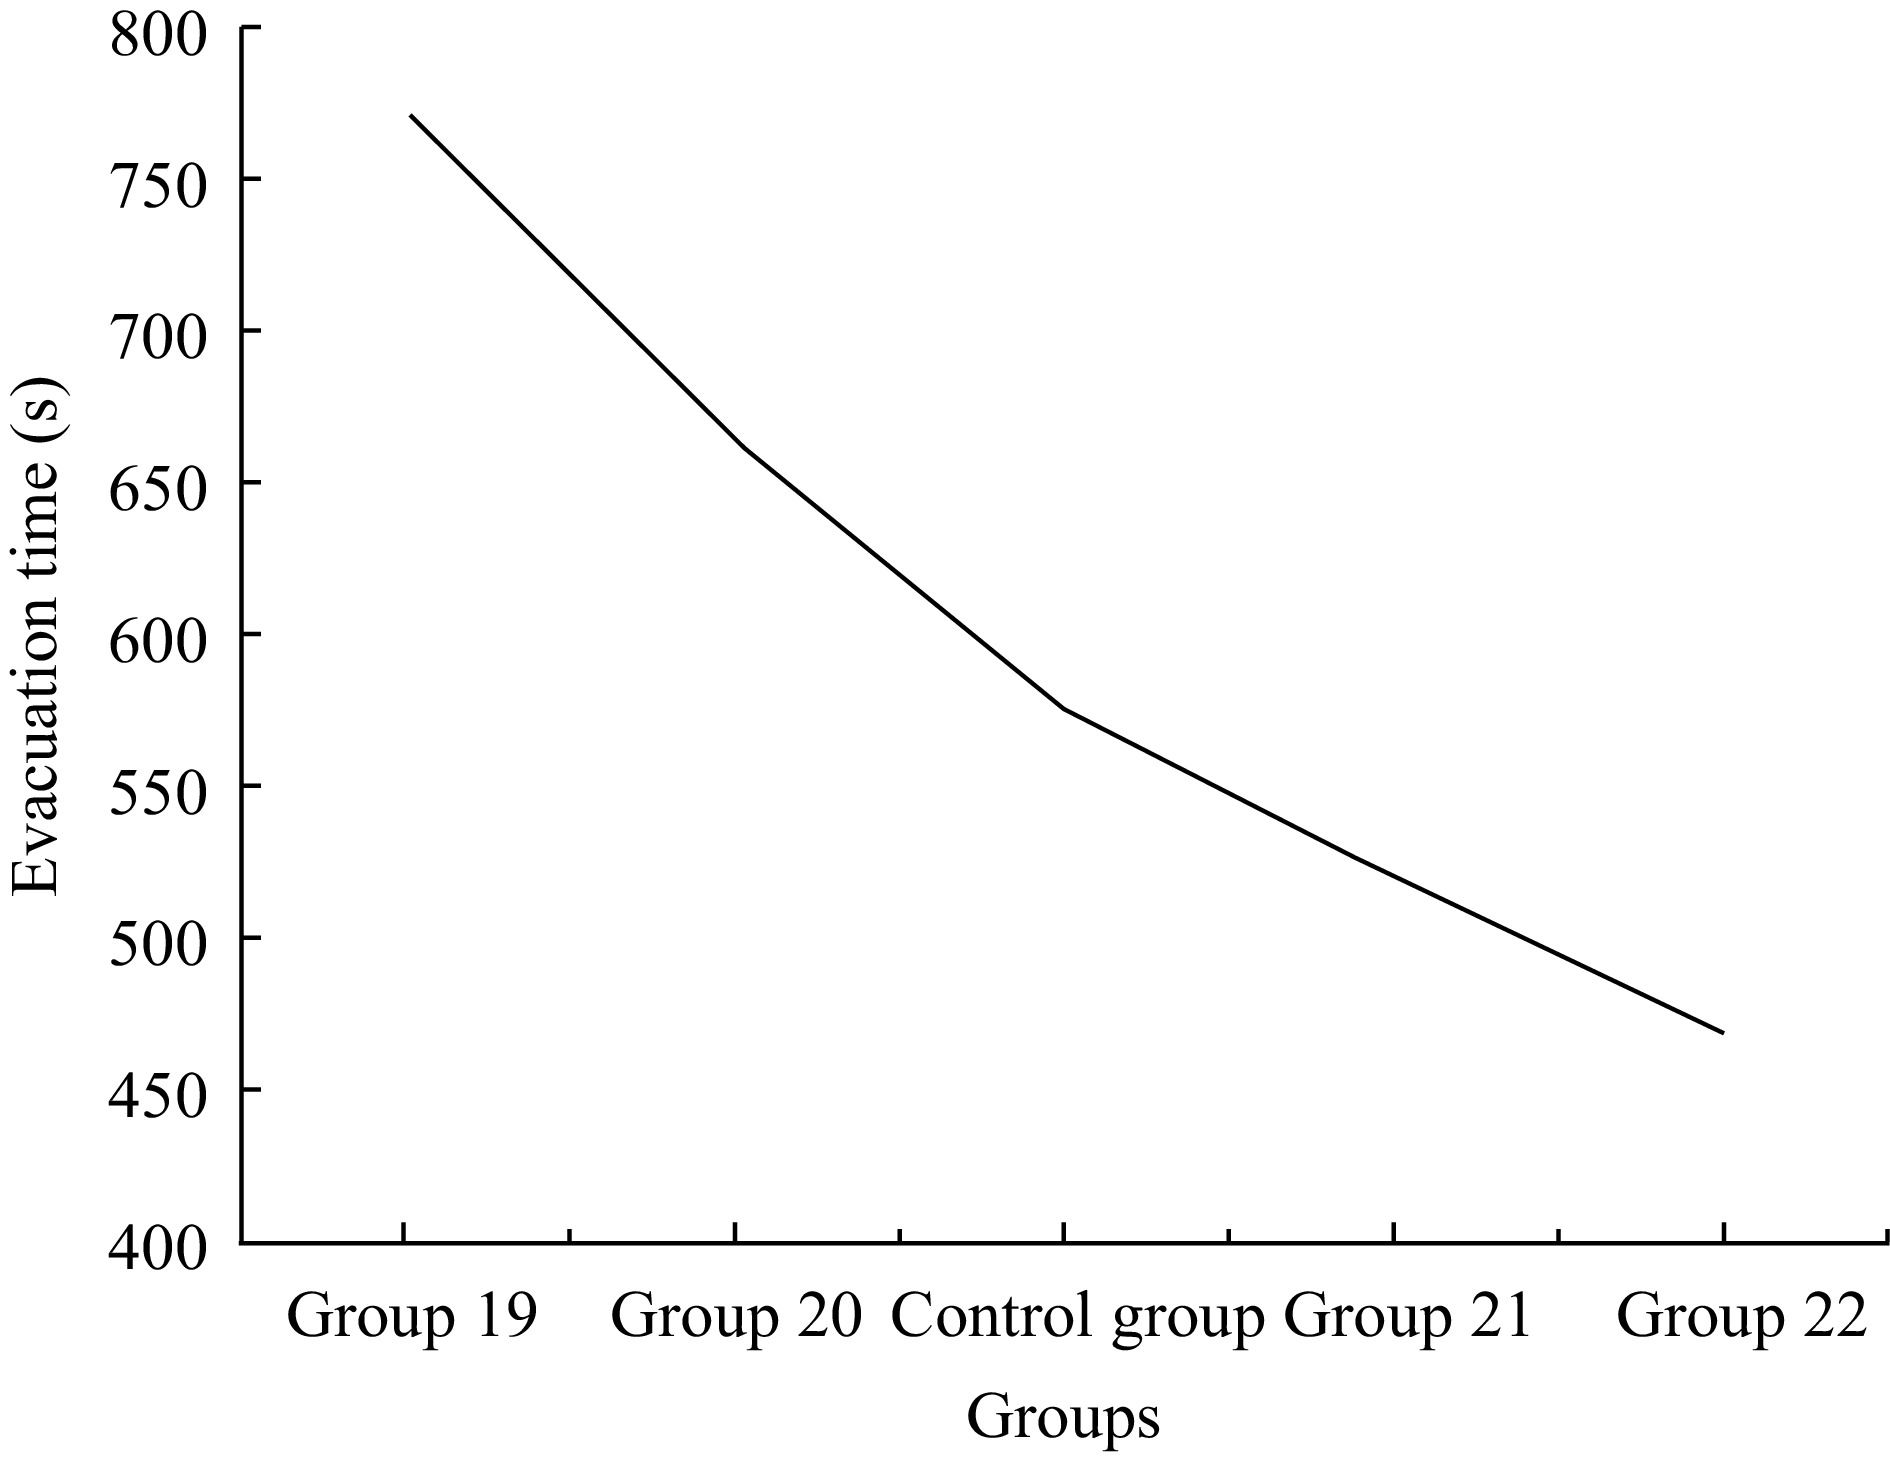
Figure 13.
Evacuation time vs. velocity change diagram.
-
Percentiles 1 5 10 50 90 95 99 Male shoulder width ( mm ) 330 344 351 375 397 403 415 Female shoulder width ( mm ) 304 320 328 351 371 377 387 Table 1.
Chinese adult shoulder width data
-
Group Escalator used or not Evacuation time (s) Group 1 Yes 569.2 Control group No 575.53 Table 2.
Experimental results of using escalators.
-
Group Escalator speed (m/s) Evacuation time (s) Group 2 0.65 562.2 Control group 0.5 569.2 Table 3.
Experimental results of using escalators.
-
Group Stairmen (%) Escalator walkers (%) Escalator standers (%) Evacuation time (s) Group 3 20 40 40 601.3 Control group 30 35 35 694.5 Group 5 40 30 30 701.1 Group 6 50 25 25 641.5 Group 7 60 20 20 584.6 Table 4.
Experimental results of preference for stairs and escalators.
-
Group Stairmen (%) Escalator walkers (%) Escalator standers (%) Evacuation time (s) Group 8 20 30 50 610.3 Control group 20 40 40 601.3 Group 9 20 50 30 571.6 Group 10 20 60 20 554 Group 11 20 70 10 537.3 Table 5.
Experimental results of preference for stairs and escalators.
-
Group Stair width (m) Evacuation time (s) Group 12 1.6 775.7 Group 13 2.1 644.3 Control group 2.6 575.53 Group 14 3.1 561.3 Group 15 3.6 539.3 Table 6.
Experimental results of stair width.
-
Group Familiar with exit evacuation (%) Any exit evacuation (%) Evacuation time (s) Group 16 10 90 569.7 Group 17 20 80 572.3 Control group 30 70 575.53 Group 18 40 60 578.1 Table 7.
Export familiarity experimental results.
-
Group Adult male
(m/s)Adult female
(m/s)Elderly and children
(m/s)Evacuation time
(s)Group 19 1.15 0.78 0.56 771.6 Group 20 1.25 0.88 0.66 663 Control group 1.35 0.98 0.76 575.53 Group 21 1.45 1.08 0.86 519.8 Group 22 1.55 1.18 0.96 468.9 Table 8.
Experimental results of motion speed.
Figures
(13)
Tables
(8)