-
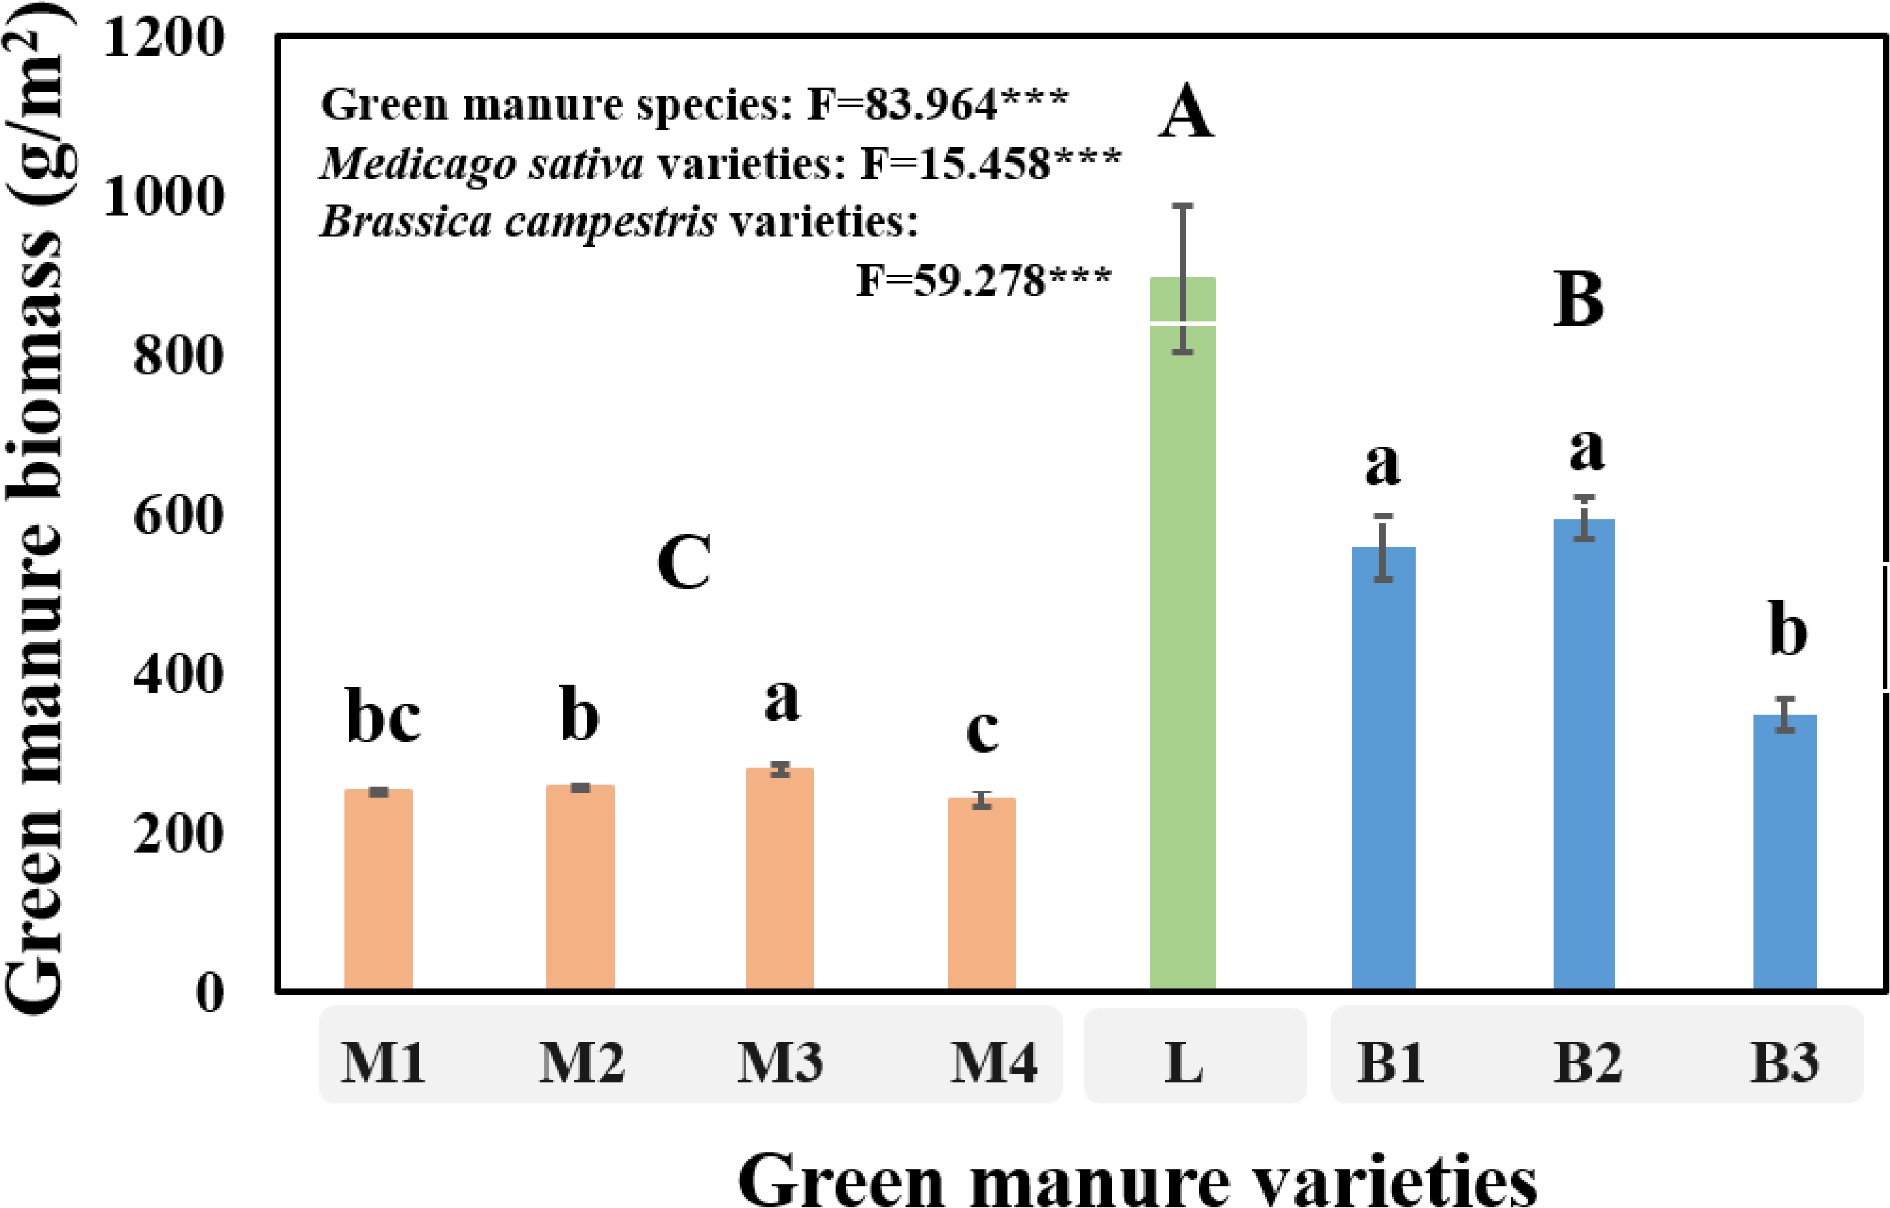
Figure 1.
The green manure biomass of different varieties cultivation at harvest in saline alkali soil field experiment. 'M1, M2, M3 and M4' represent Aurora, Sanditi, Eureka+, Sardi, respectively, which all belong to Medicago sativa. 'L' refers to Lolium multiflorum. 'B1, B2 and B3' represent Huayouza 82, Huayouza 158, Huayouza 62, respectively, which all belong to Brassica campestris. One-way analysis of variance (ANOVA) was used to assess the differences among treatments. Bars represent the mean values of three replicates ± SD. Values that do not share the same lower case letter are significantly different (P < 0.05) among green manure varieties. Values that do not share the same uppercase letter are significantly different (P < 0.05) at different green manure species (Medicago sativa, Lolium multiflorum, Brassica campestris). *** refers to P < 0.001.
-
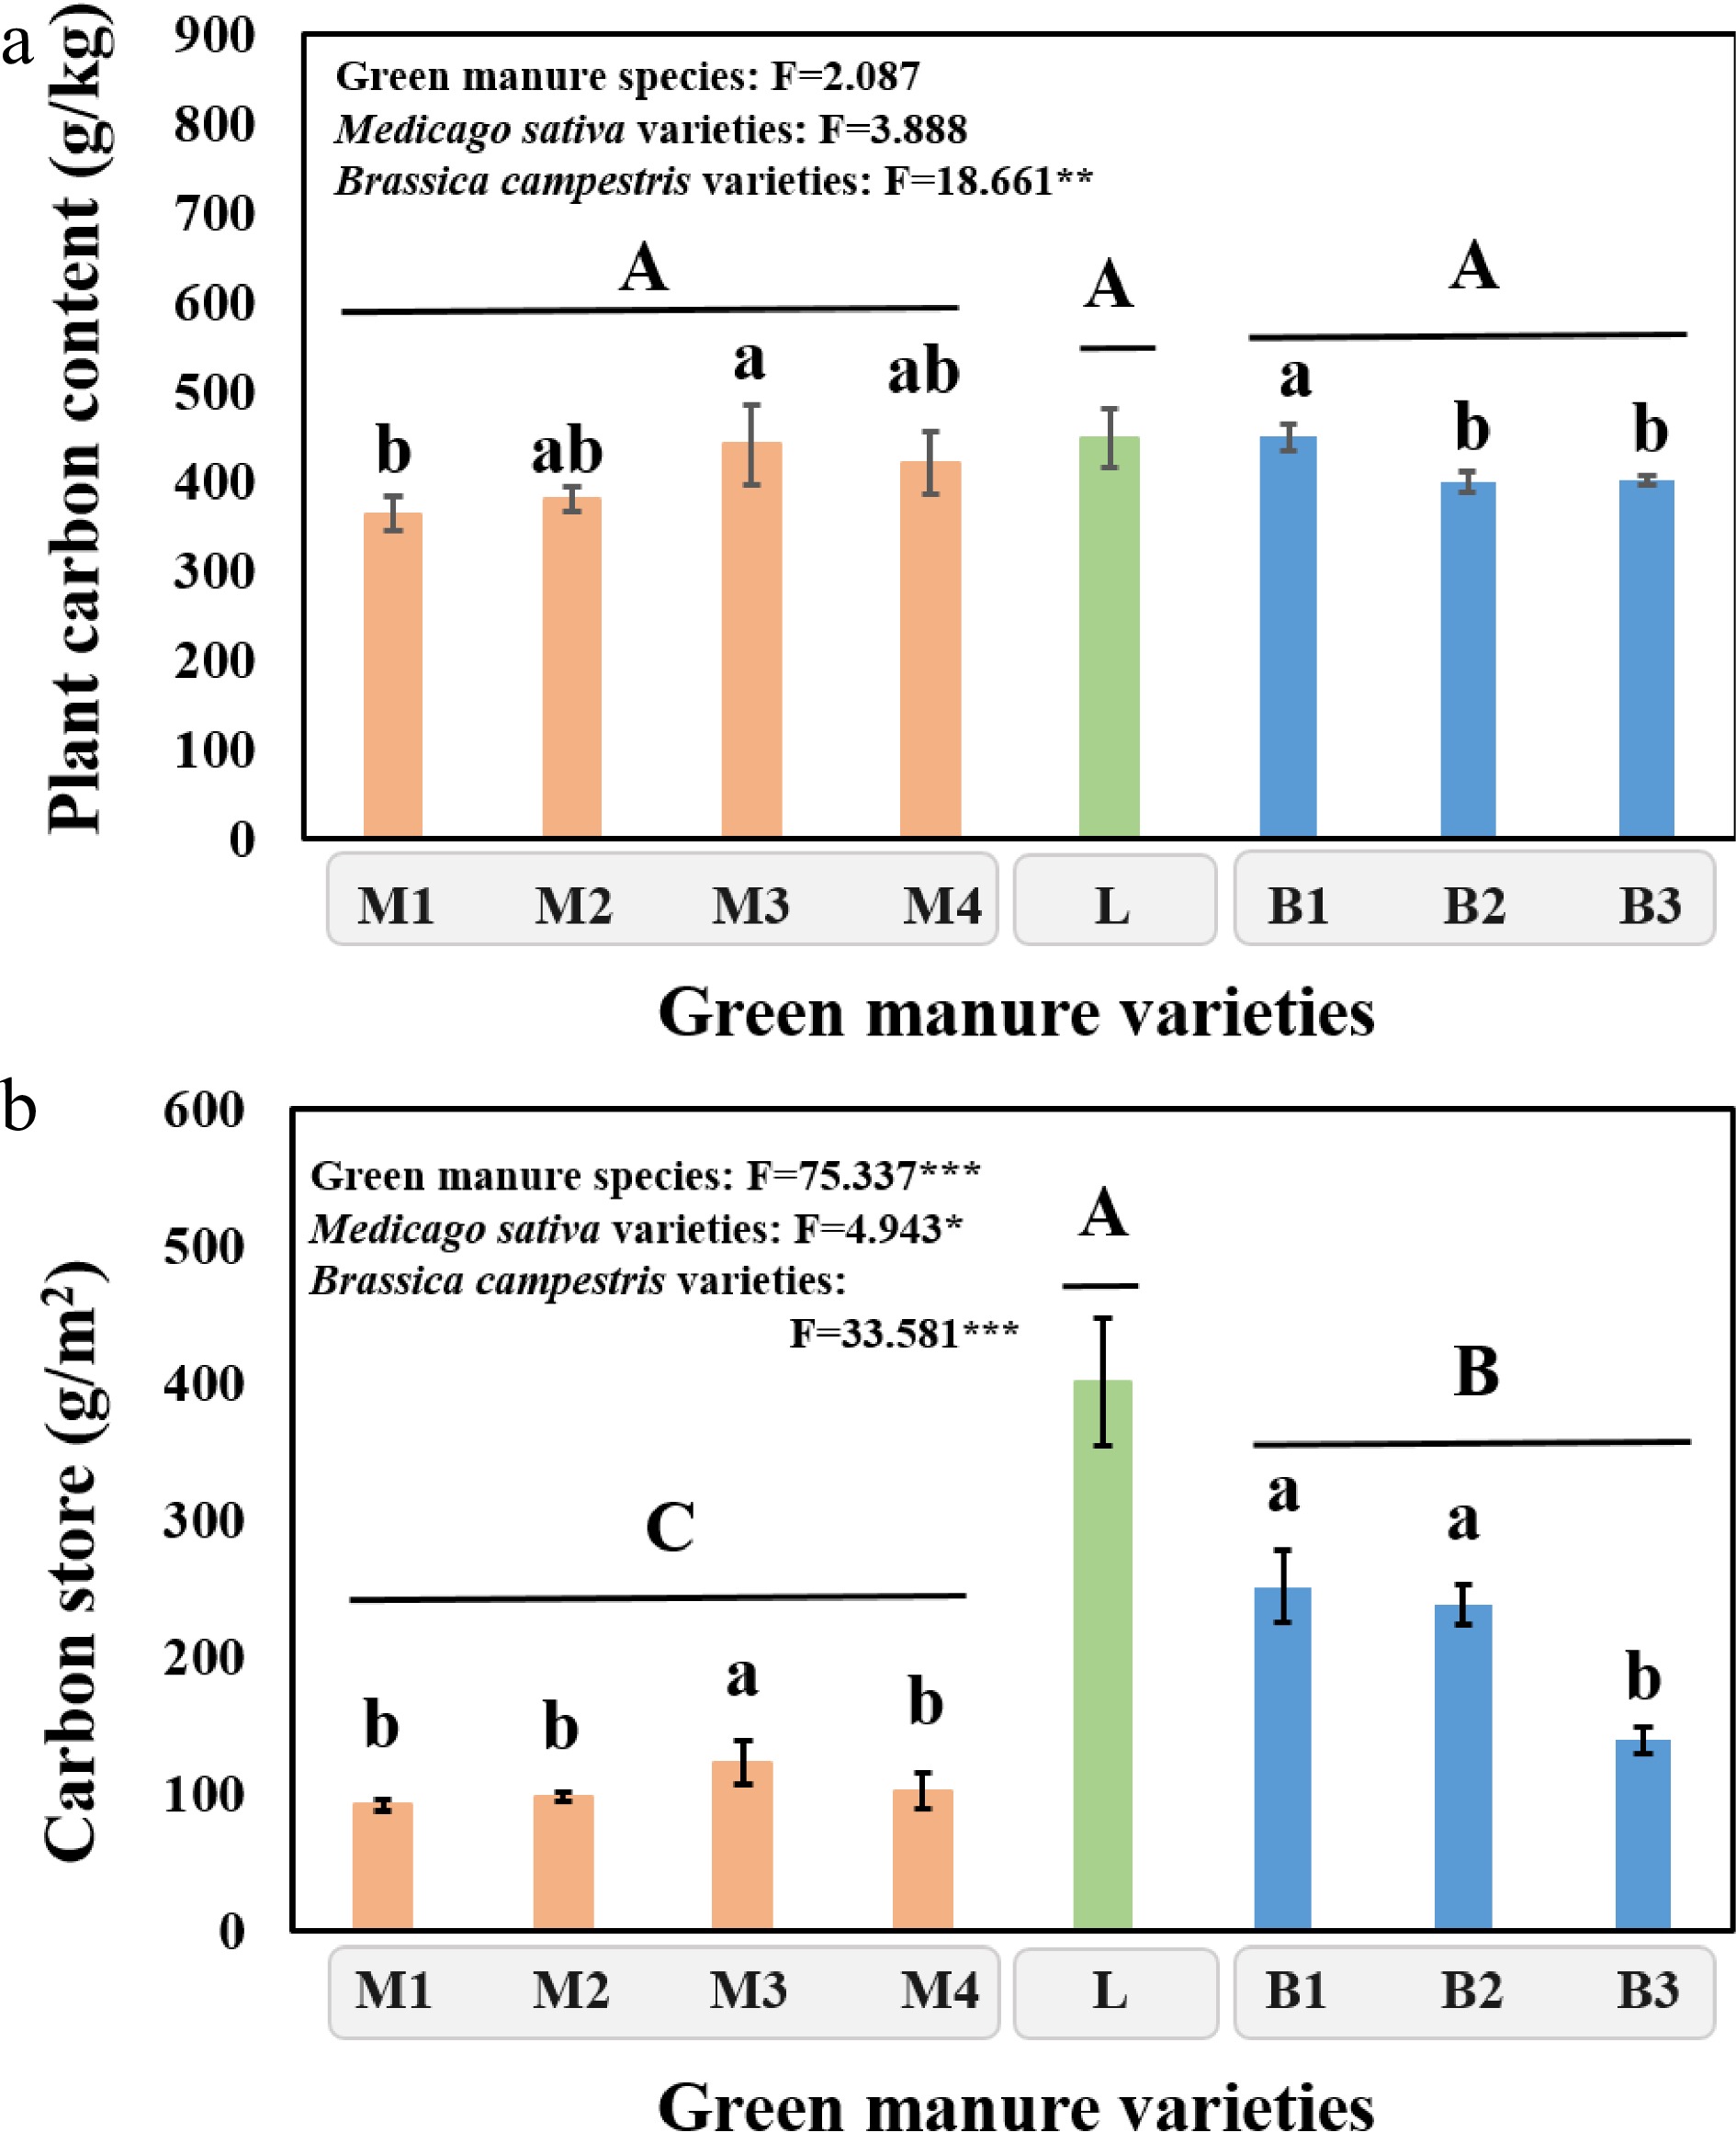
Figure 2.
(a) Carbon content and (b) carbon store of different varieties cultivated at harvest in saline alkali soil field experiment. 'M1, M2, M3 and M4' represent Aurora, Sanditi, Eureka+, Sardi, respectively, which all belong to Medicago sativa. 'L' refers to Lolium multiflorum. 'B1, B2 and B3' represent Huayouza 82, Huayouza 158, Huayouza 62, respectively, which all belong to Brassica campestris. One-way analysis of variance (ANOVA) was used to assess the differences among treatments. Bars represent the mean values of three replicates ± SD. Values that do not share the same lower case letter are significantly different (P < 0.05) among green manure varieties. Values that do not share the same uppercase letter are significantly different (P < 0.05) at different green manure species (Medicago sativa, Lolium multiflorum, Brassica campestris). * refers to P < 0.05; ** refers to P < 0.01; *** refers to P < 0.001.
-

Figure 3.
Soil fertility index of different treatment that returning to the field in saline alkali soil experiment. One-way analysis of variance (ANOVA) was used to assess the differences among treatments. Bars represent the mean values of three replicates ± SD. Values that do not share the same lower case letter are significantly different (P < 0.05) among green manure varieties. Values that do not share the same uppercase letter are significantly different (P < 0.05) at different green manure species (Medicago sativa, Lolium multiflorum, Brassica campestris). ** refers to P < 0.01; *** refers to P < 0.001.
-
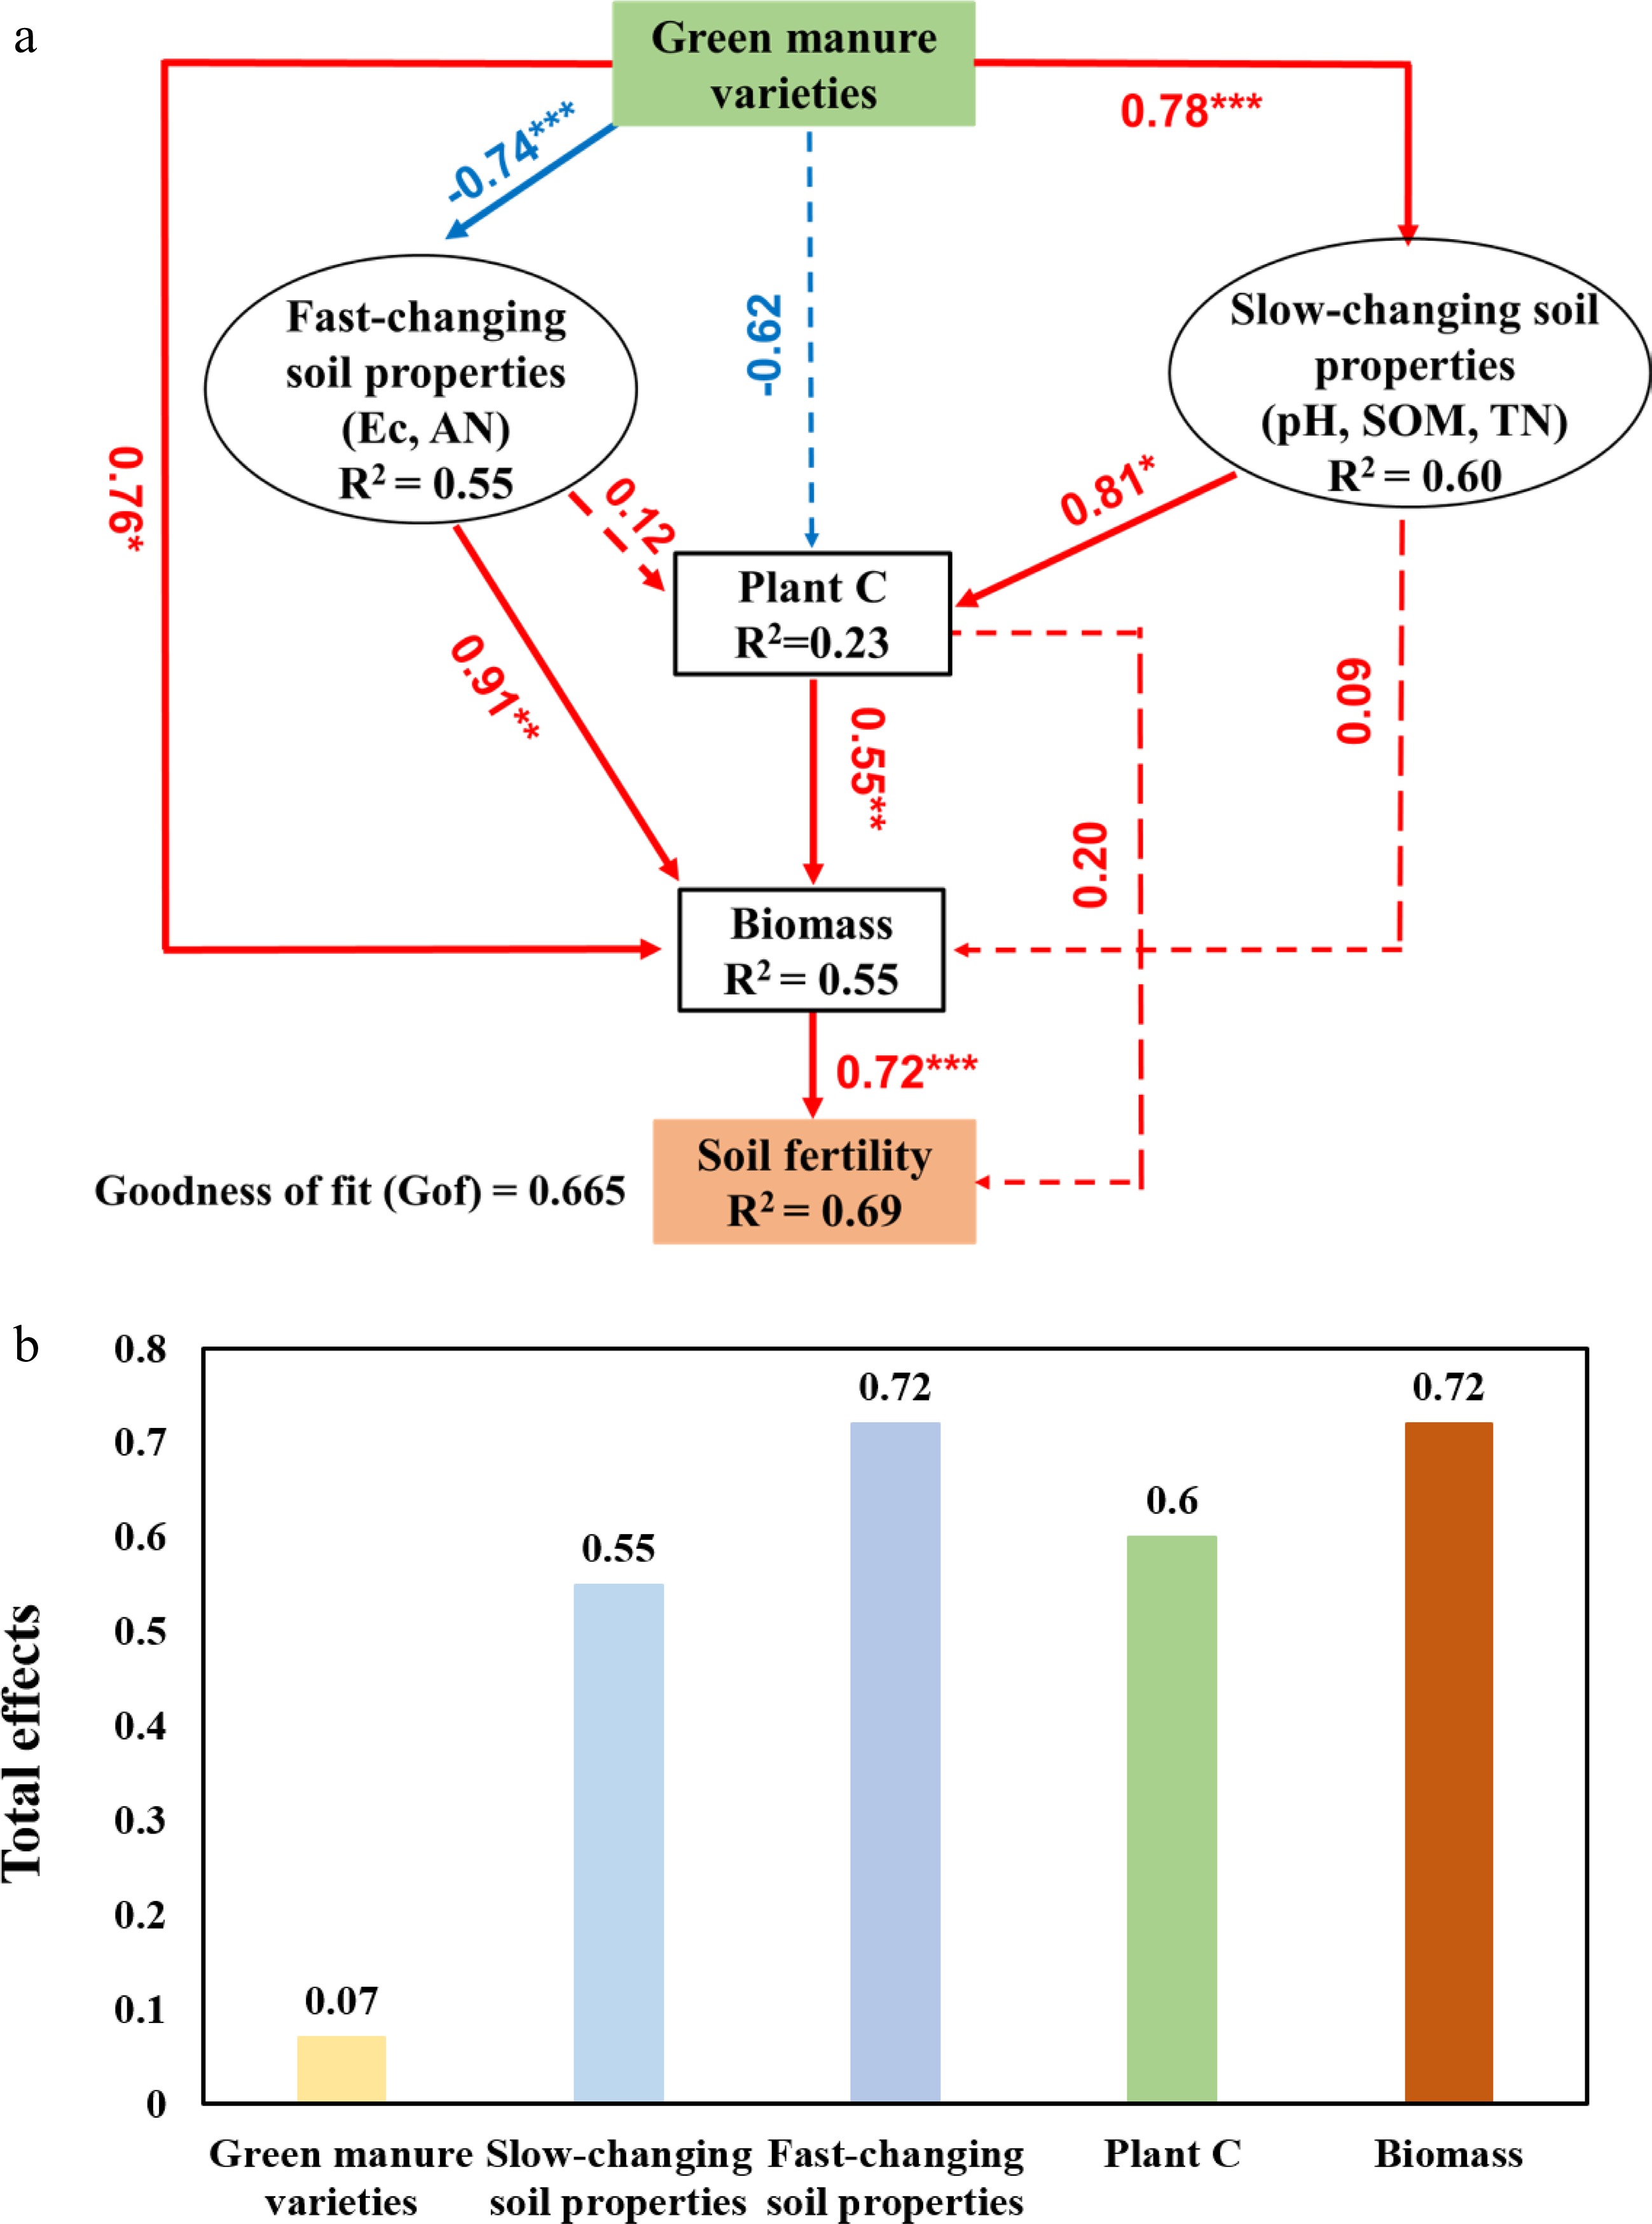
Figure 4.
Cascading relationships of soil fertility with green manure and soil physicochemical properties. (a) Partial least squares path modelling (PLS-PM) disentangling major pathways of the influences of green manure varieties, soil physicochemical properties, plant C, green manure biomass on soil fertility. Red and blue arrows indicate positive and negative flows of causality, respectively. Solid and dashed lines indicate significant (*, P < 0.05; **, P < 0.01; ***, P < 0.001) and nonsignificant (P > 0.05) levels, respectively. Values on arrows indicate significant standardized path coefficients. R2 indicates the variance of dependent variable explained by the model. (b) Total effects of soil fertility in the PLSPM models for green manure varieties, fast-changing soil properties, slow-changing soil properties, plant C, and green manure biomass.
-
Green manure cultivation Treatment pH EC
(us·cm−1)Soil organic matter
(g·kg−1)Total N
(g·kg−1)Available N
(mg·kg−1)No-cultivation CK 9.04 ± 0.16abc 496.33 ± 19.50b 5.27 ± 0.14bc 0.58 ± 0.05abc 38.76 ± 2.03bc Medicago sativa M1 8.50 ± 0.13f 429.00 ± 26.21cd 4.41 ± 0.78c 0.58 ± 0.01ab 51.58 ± 2.66a M2 8.72 ± 0.02e 470.33 ± 13.32bc 5.11 ± 0.42bc 0.54 ± 0.01cd 49.43 ± 4.35a M3 8.89 ± 0.03d 356.67 ± 6.43ef 5.63 ± 0.66a 0.54 ± 0.02bcd 41.89 ± 4.57b M4 8.93 ± 0.03cd 391.00 ± 4.36de 4.33 ± 0.24c 0.53 ± 0.02d 50.27 ± 1.61a Lolium multiflorum L 8.69 ± 0.04e 567.67 ± 52.88a 5.33 ± 0.46bc 0.60 ± 0.01a 53.68 ± 3.79a Brassica campestris B1 9.02 ± 0.04bc 363.00 ± 26.91ef 5.13 ± 0.11bc 0.51 ± 0.01de 37.53 ± 3.16bc B2 9.11 ± 0.02ab 330.67 ± 12.66f 5.07 ± 1.32bc 0.51 ± 0.02de 38.87 ± 2.33bc B3 9.17 ± 0.01a 328.00 ± 28.69f 6.00 ± 0.21a 0.49 ± 0.01e 34.97 ± 5.50c CK: no cultivation. 'M1, M2, M3 and M4' represent Aurora, Sanditi, Eureka+, Sardi, respectively, which all belong to Medicago sativa. 'L' refers to Lolium multiflorum. 'B1, B2 and B3' represent Huayouza 82, Huayouza 158, Huayouza 62, respectively, which all belong to Brassica campestris. Data are the mean values of three replicates. Numbers followed by '±' are the standard deviations (SDs). Within a column, values that do not share the same letter are significantly different (P < 0.05). Table 1.
Soil properties measured under different treatment at green manure harvest in saline alkali soil field experiment.
-
Green manure return Treatment pH EC
(us·cm−1)Soil organic matter
(g·kg−1)Total N
(g·kg−1)Available N
(mg·kg−1)No-returning CK 9.00 ± 0.14ab 591.00 ± 56.45bcd 5.84 ± 0.74b 0.52 ± 0.01c 39.80 ± 1.88d Medicago sativa M1 8.89 ± 0.07bc 536.33 ± 32.59d 7.92 ± 1.24a 0.60 ± 0.01b 41.99 ± 4.37cd M2 9.11 ± 0.03a 407.33 ± 43.25e 8.55 ± 0.80a 0.54 ± 0.05c 45.70 ± 4.68bcd M3 9.00 ± 0.02ab 438.33 ± 49.08e 8.36 ± 0.59a 0.60 ± 0.02b 47.24 ± 4.26bcd M4 8.82 ± 0.02c 549.67 ± 15.28cd 7.76 ± 0.55a 0.63 ± 0.02b 51.96 ± 1.87b Lolium multiflorum L 8.31 ± 0.12e 519.00 ± 14.53d 7.72 ± 0.88a 0.71 ± 0.02a 62.58 ± 5.98a Brassica campestris B1 8.58 ± 0.05d 621.67 ± 5.13bc 7.75 ± 0.44a 0.62 ± 0.02b 49.04 ± 8.57bc B2 8.59 ± 0.07d 701.33 ± 71.44a 7.30 ± 0.46a 0.61 ± 0.01b 42.43 ± 3.22cd B3 8.64 ± 0.01d 627.67 ± 35.53b 7.61 ± 0.28a 0.68 ± 0.03a 48.57 ± 3.73bcd CK: no cultivation. 'M1, M2, M3 and M4' represent Aurora, Sanditi, Eureka+, Sardi, respectively, which all belong to Medicago sativa. 'L' refers to Lolium multiflorum. 'B1, B2 and B3' represent Huayouza 82, Huayouza 158, Huayouza 62, respectively, which all belong to Brassica campestris. Data are the mean values of three replicates. Numbers followed by '±' are the standard deviations (SDs). Within a column, values that do not share the same letter are significantly different (P < 0.05). Table 2.
Soil properties measured under different treatment after green manure return to saline alkali soil field for 30 d.
-
pH (H2O) EC
(us·cm−1)Soil organic matter
(SOM, g·kg−1)Total nitrogen
(TN, g·kg−1)Available nitrogen
(AN, mg·kg−1)Scoring curve# a a b b b Turning point U 9 1,500 15 1.2 120 L 6.0 100 5 0.5 30 O1 6.5 300 O2 8 400 weight 0.25 0.23 0.07 0.23 0.22 'a' Refers to the 'optimum' curve equation; 'b' refers to the 'more is better' curve equation. Table 3.
Scoring function values and weights assigned to selected soil fertility parameters.
Figures
(4)
Tables
(3)