-
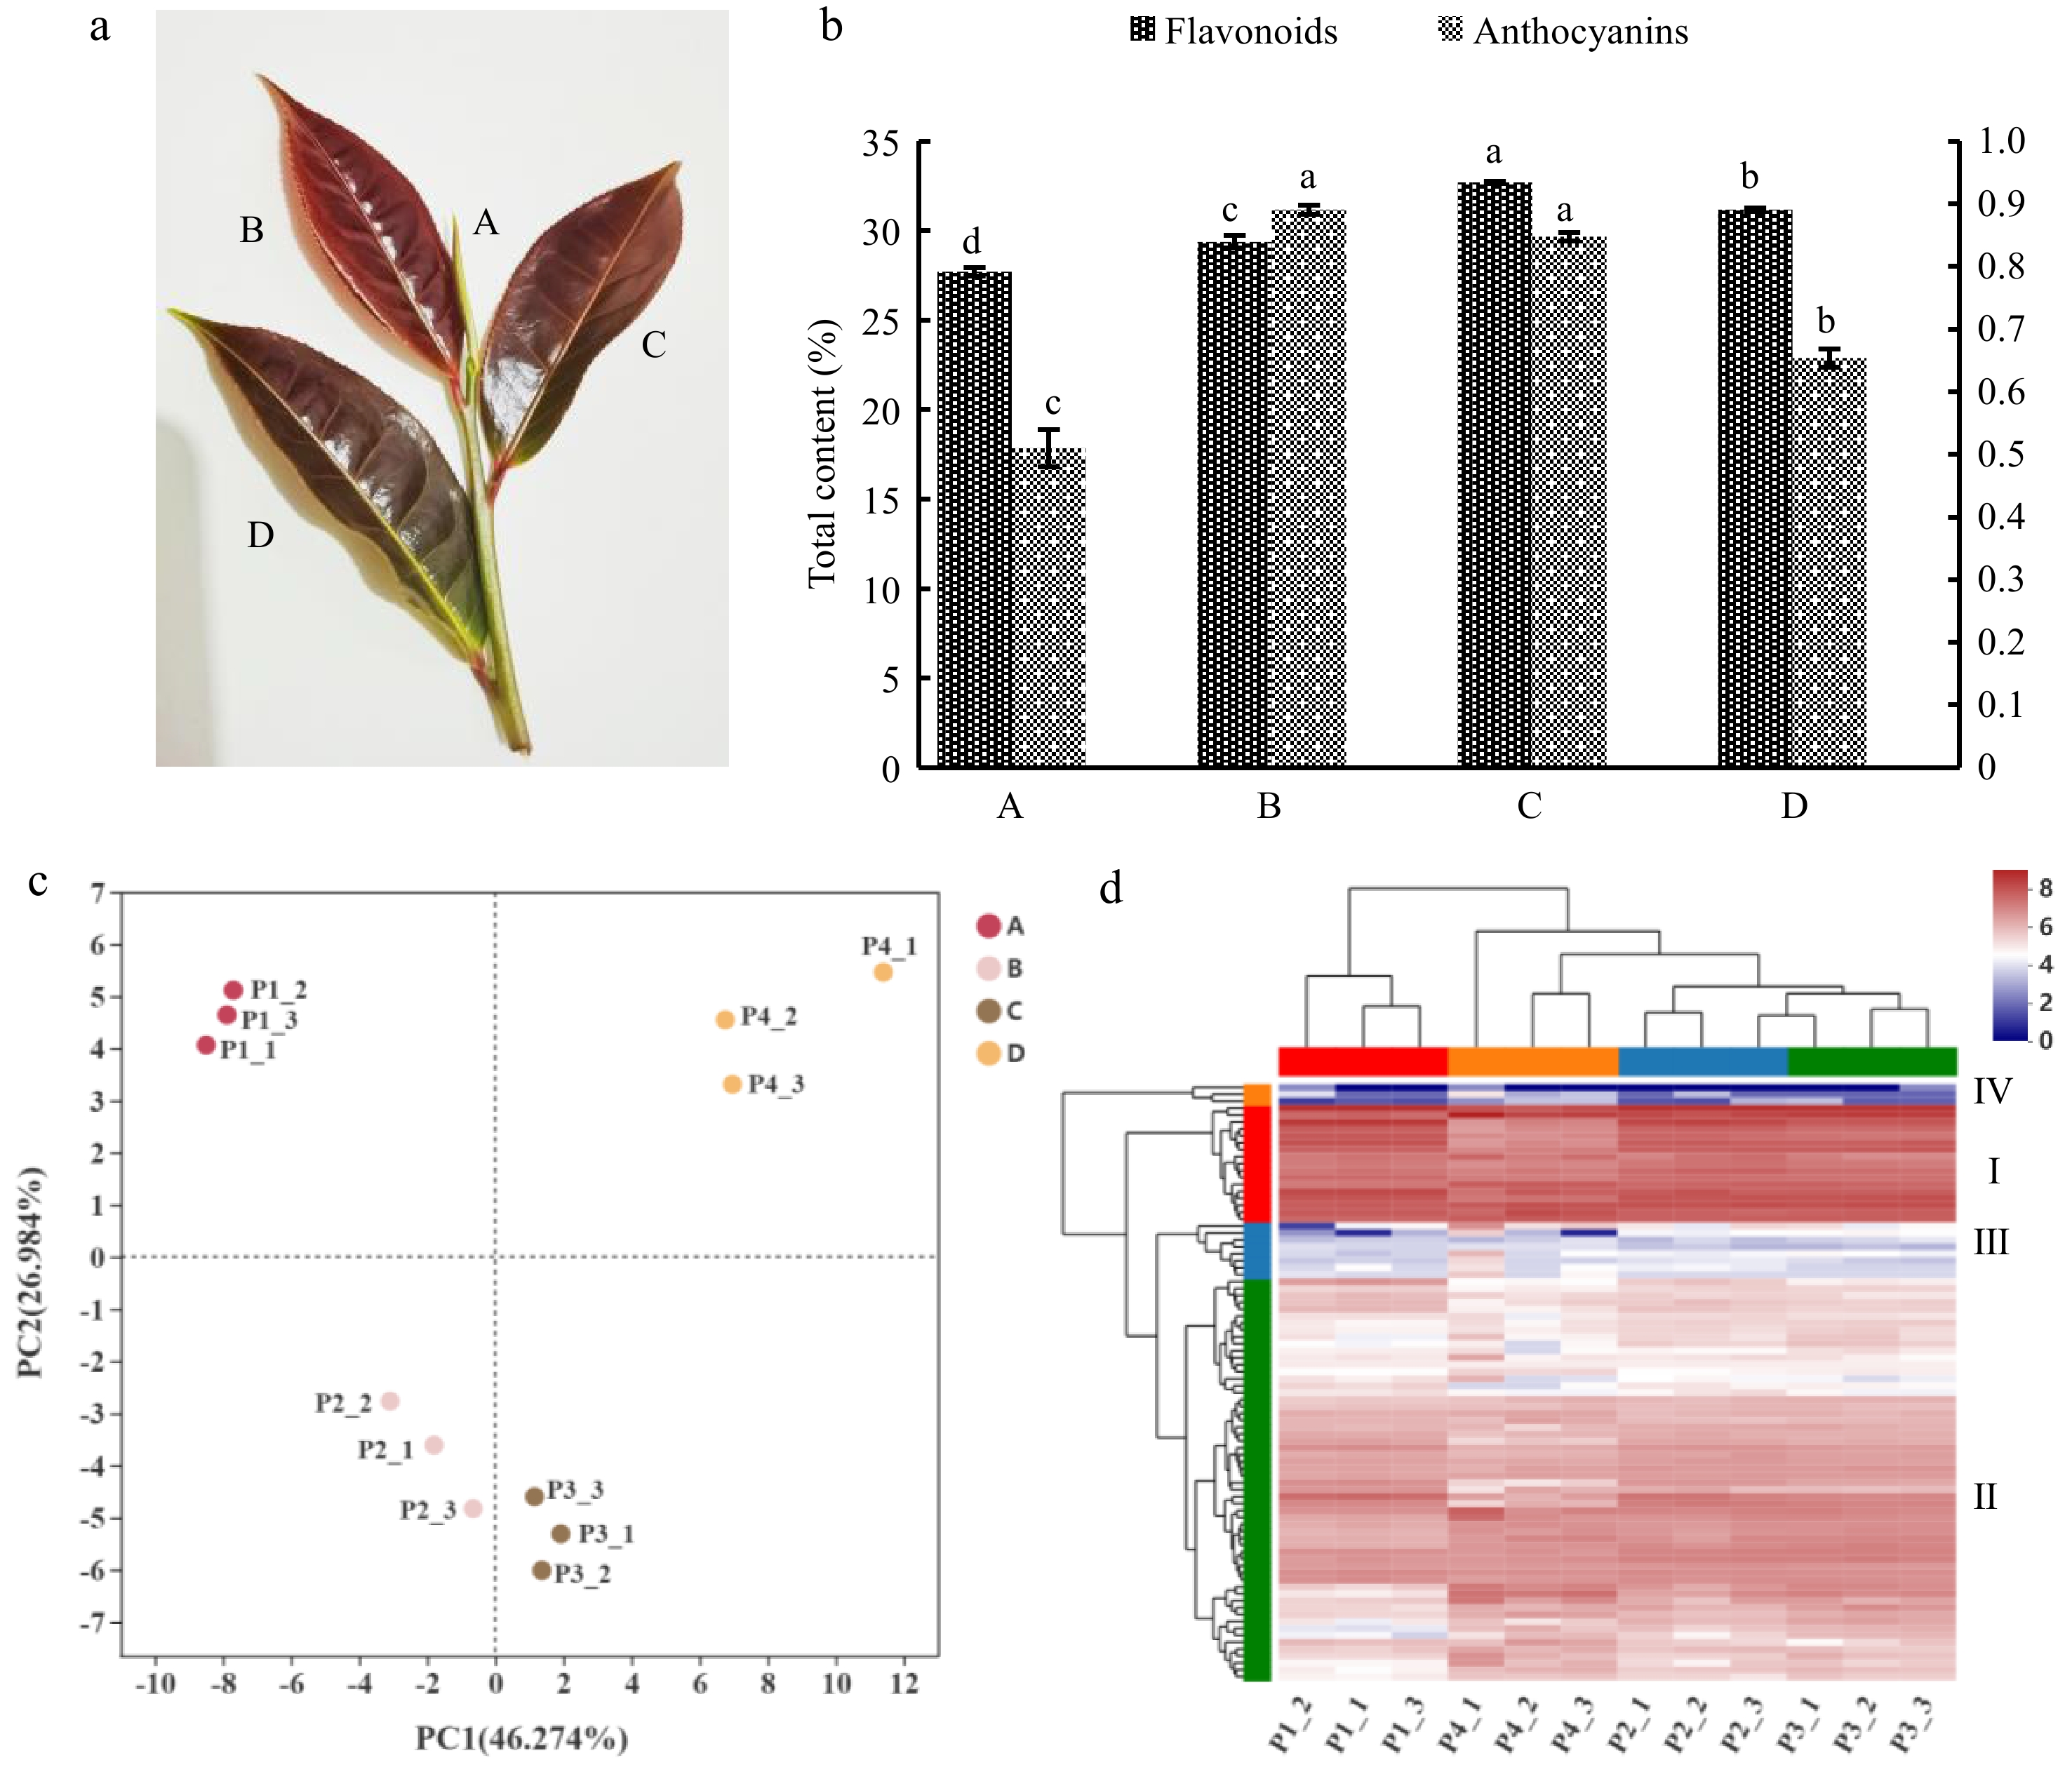
Figure 1.
(a) Tender shoots of 'P113'. The capital letters A, B, C and D represent bud, first leaf, second leaf and third leaf in (a) respectively. (b) Accumulation changes in total flavonoids and anthocyanins contents during tender shoots developmental and the content of anthocyanins was determined at FW state, and the flavonoids were determined at DW state. The left y-axis represents the total flavonoids content, and the right y-axis represents the total anthocyanins content. Error bars represent the mean ± SD and lowercase letters a, b, c and d represent significant difference, p < 5%. (c) Principal component analysis (PCA). (c) The distance between points can indicate the similarity within and between samples, the closer the distance, the greater the sample similarity, and the farther the distance, the smaller the sample similarity. (d) Clustering heatmap tree of total flavonoid metabolites of P113 in different tissues. Each row represents a metabolite and each column represents a sample, different colors in the leftmost column represent different clusters: Cluster I in red, Cluster II in green, Cluster III in blue and Cluster IV in orange. And different colors in the top row represent different sample groups: Group A in red, Group B in blue, Group C in green and Group D in orange. Different colors in the cluster heat map represent different contents, red and blue represent higher or lower metabolite contents respectively.
-
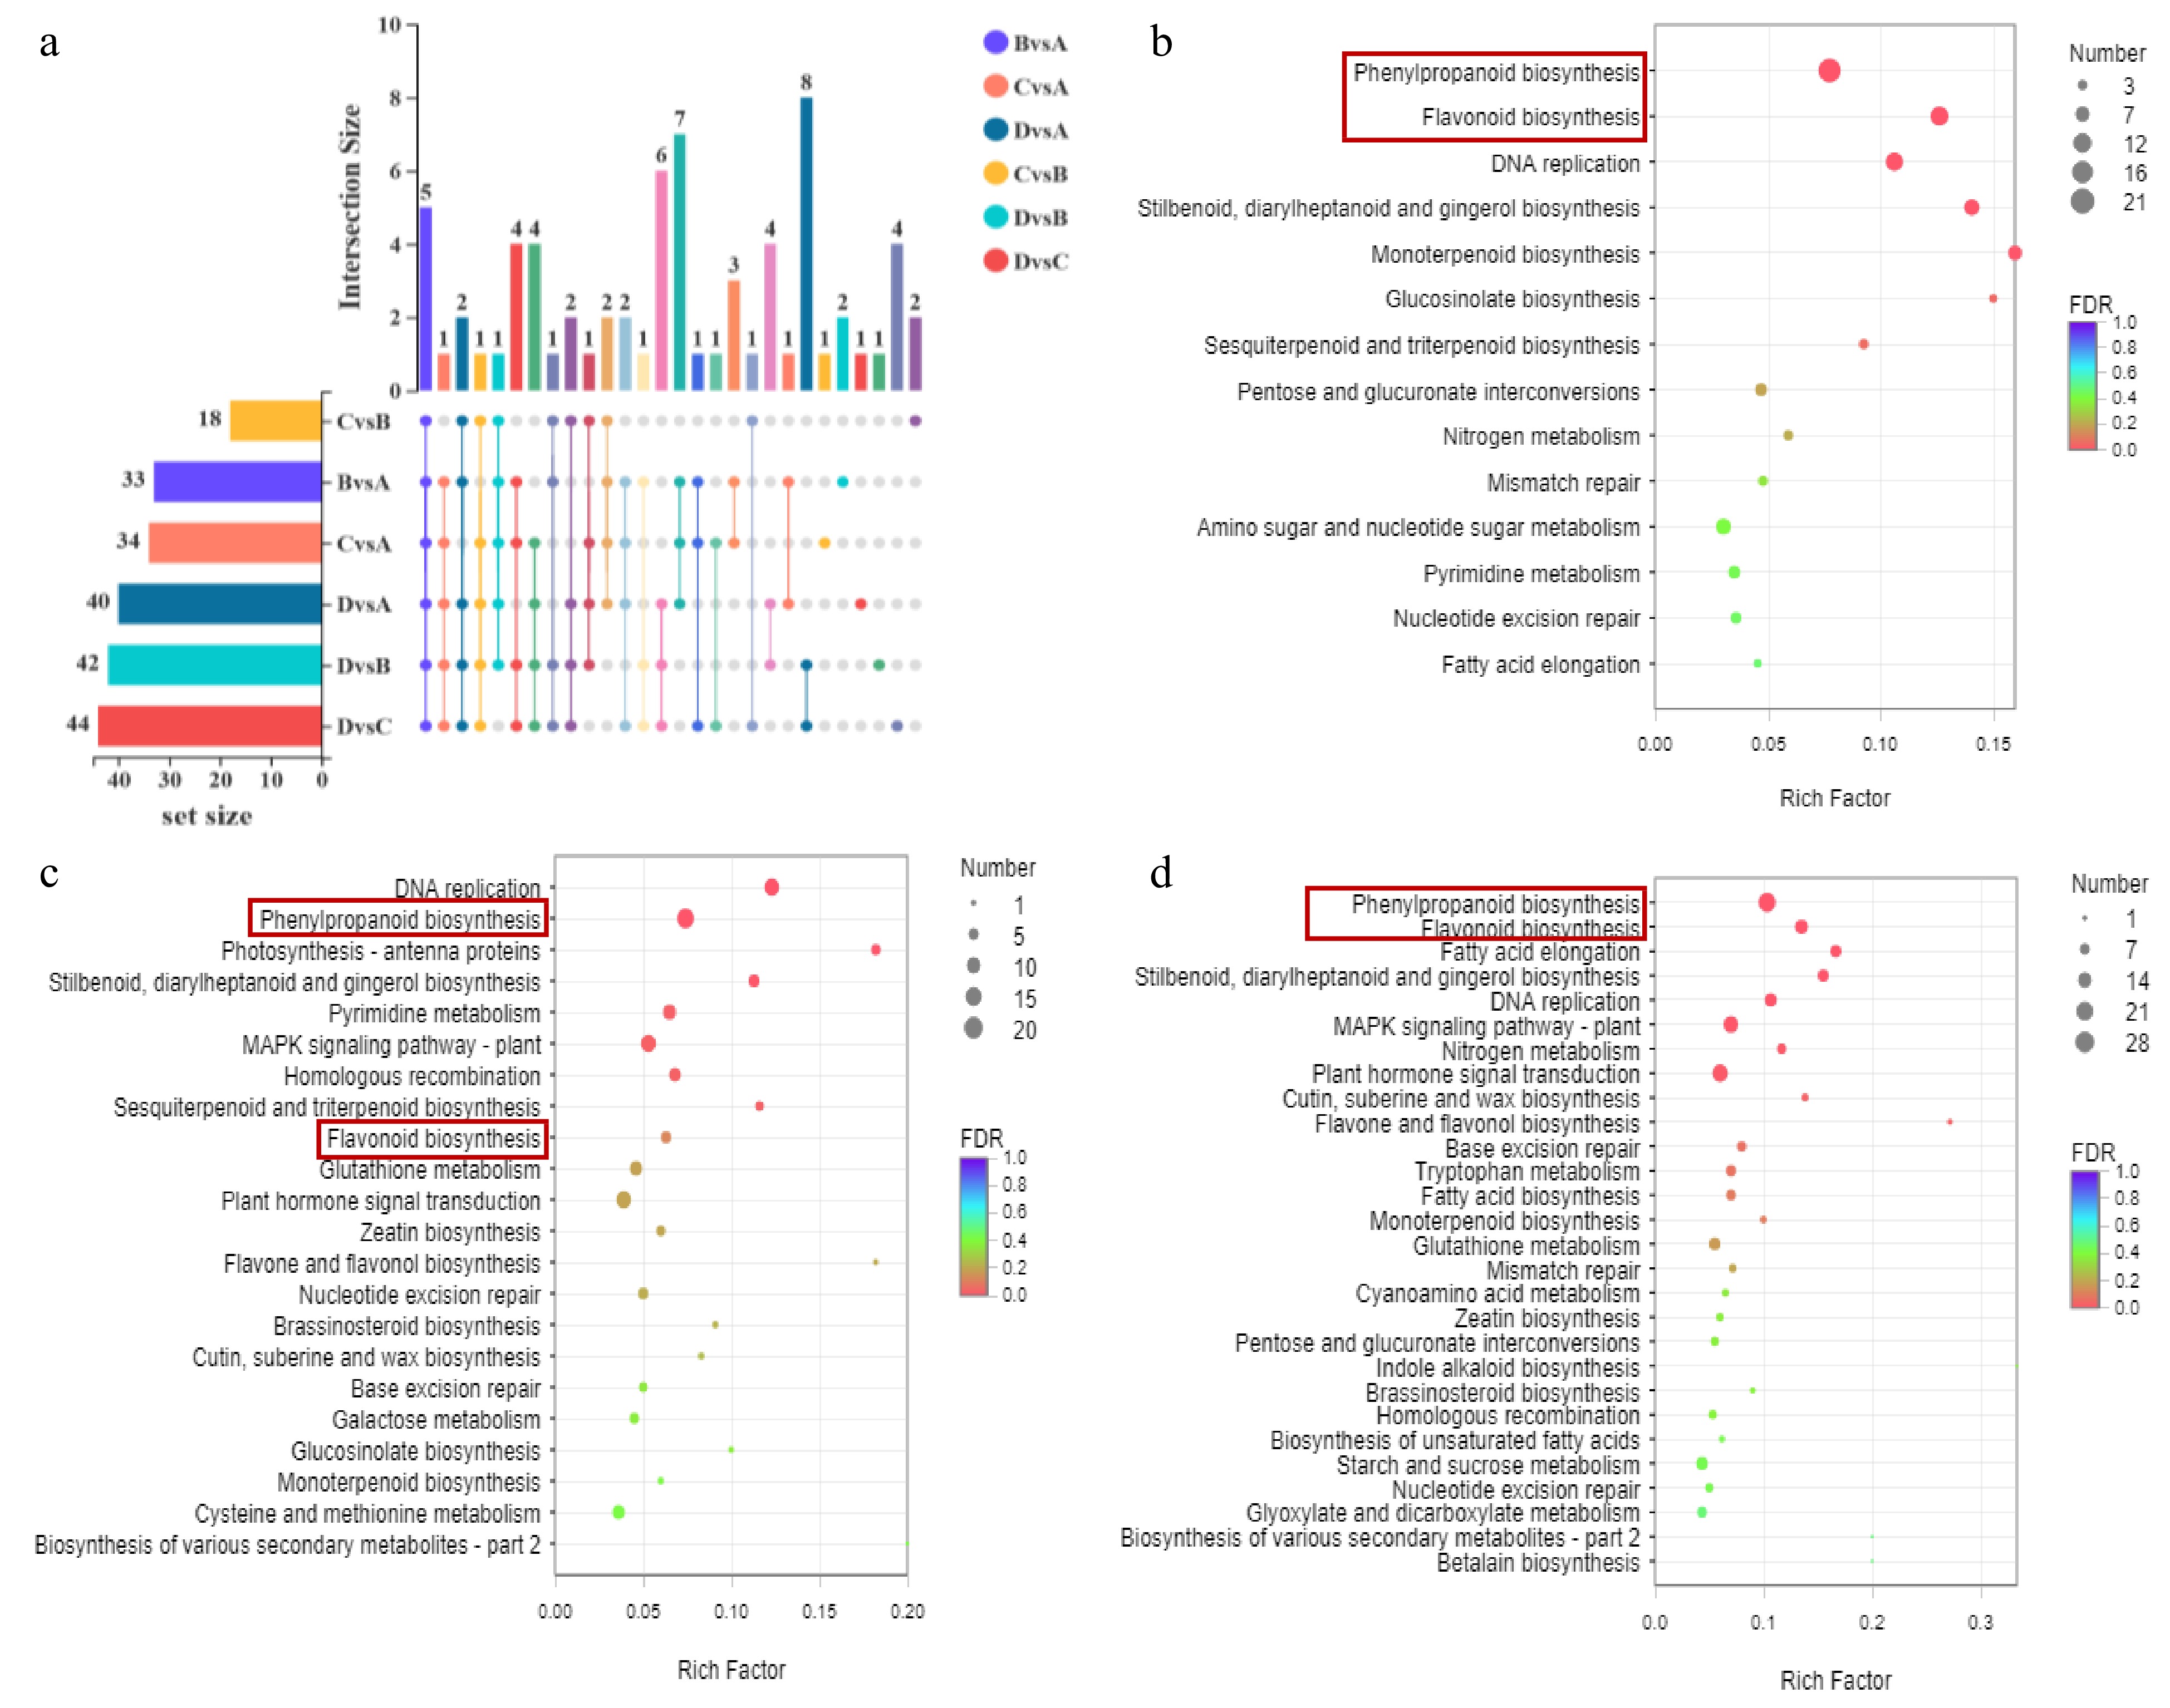
Figure 2.
(a) Up-set venn of significantly different metabolites between different comparison groups. The set size in the lower left corner is the statistics of the number of elements of each set. The histogram on the right is the statistical result of the number of elements after taking the intersection of various sets. The single point below represents the unique elements of a group, and the line between points represents the unique intersection of different groups. KEGG enrichment bubble diagram. Significantly enriched KEGG pathway (P < 0.05) from DEGs in (b) A vs B, (c) B vs C and (d) C vs D.
-
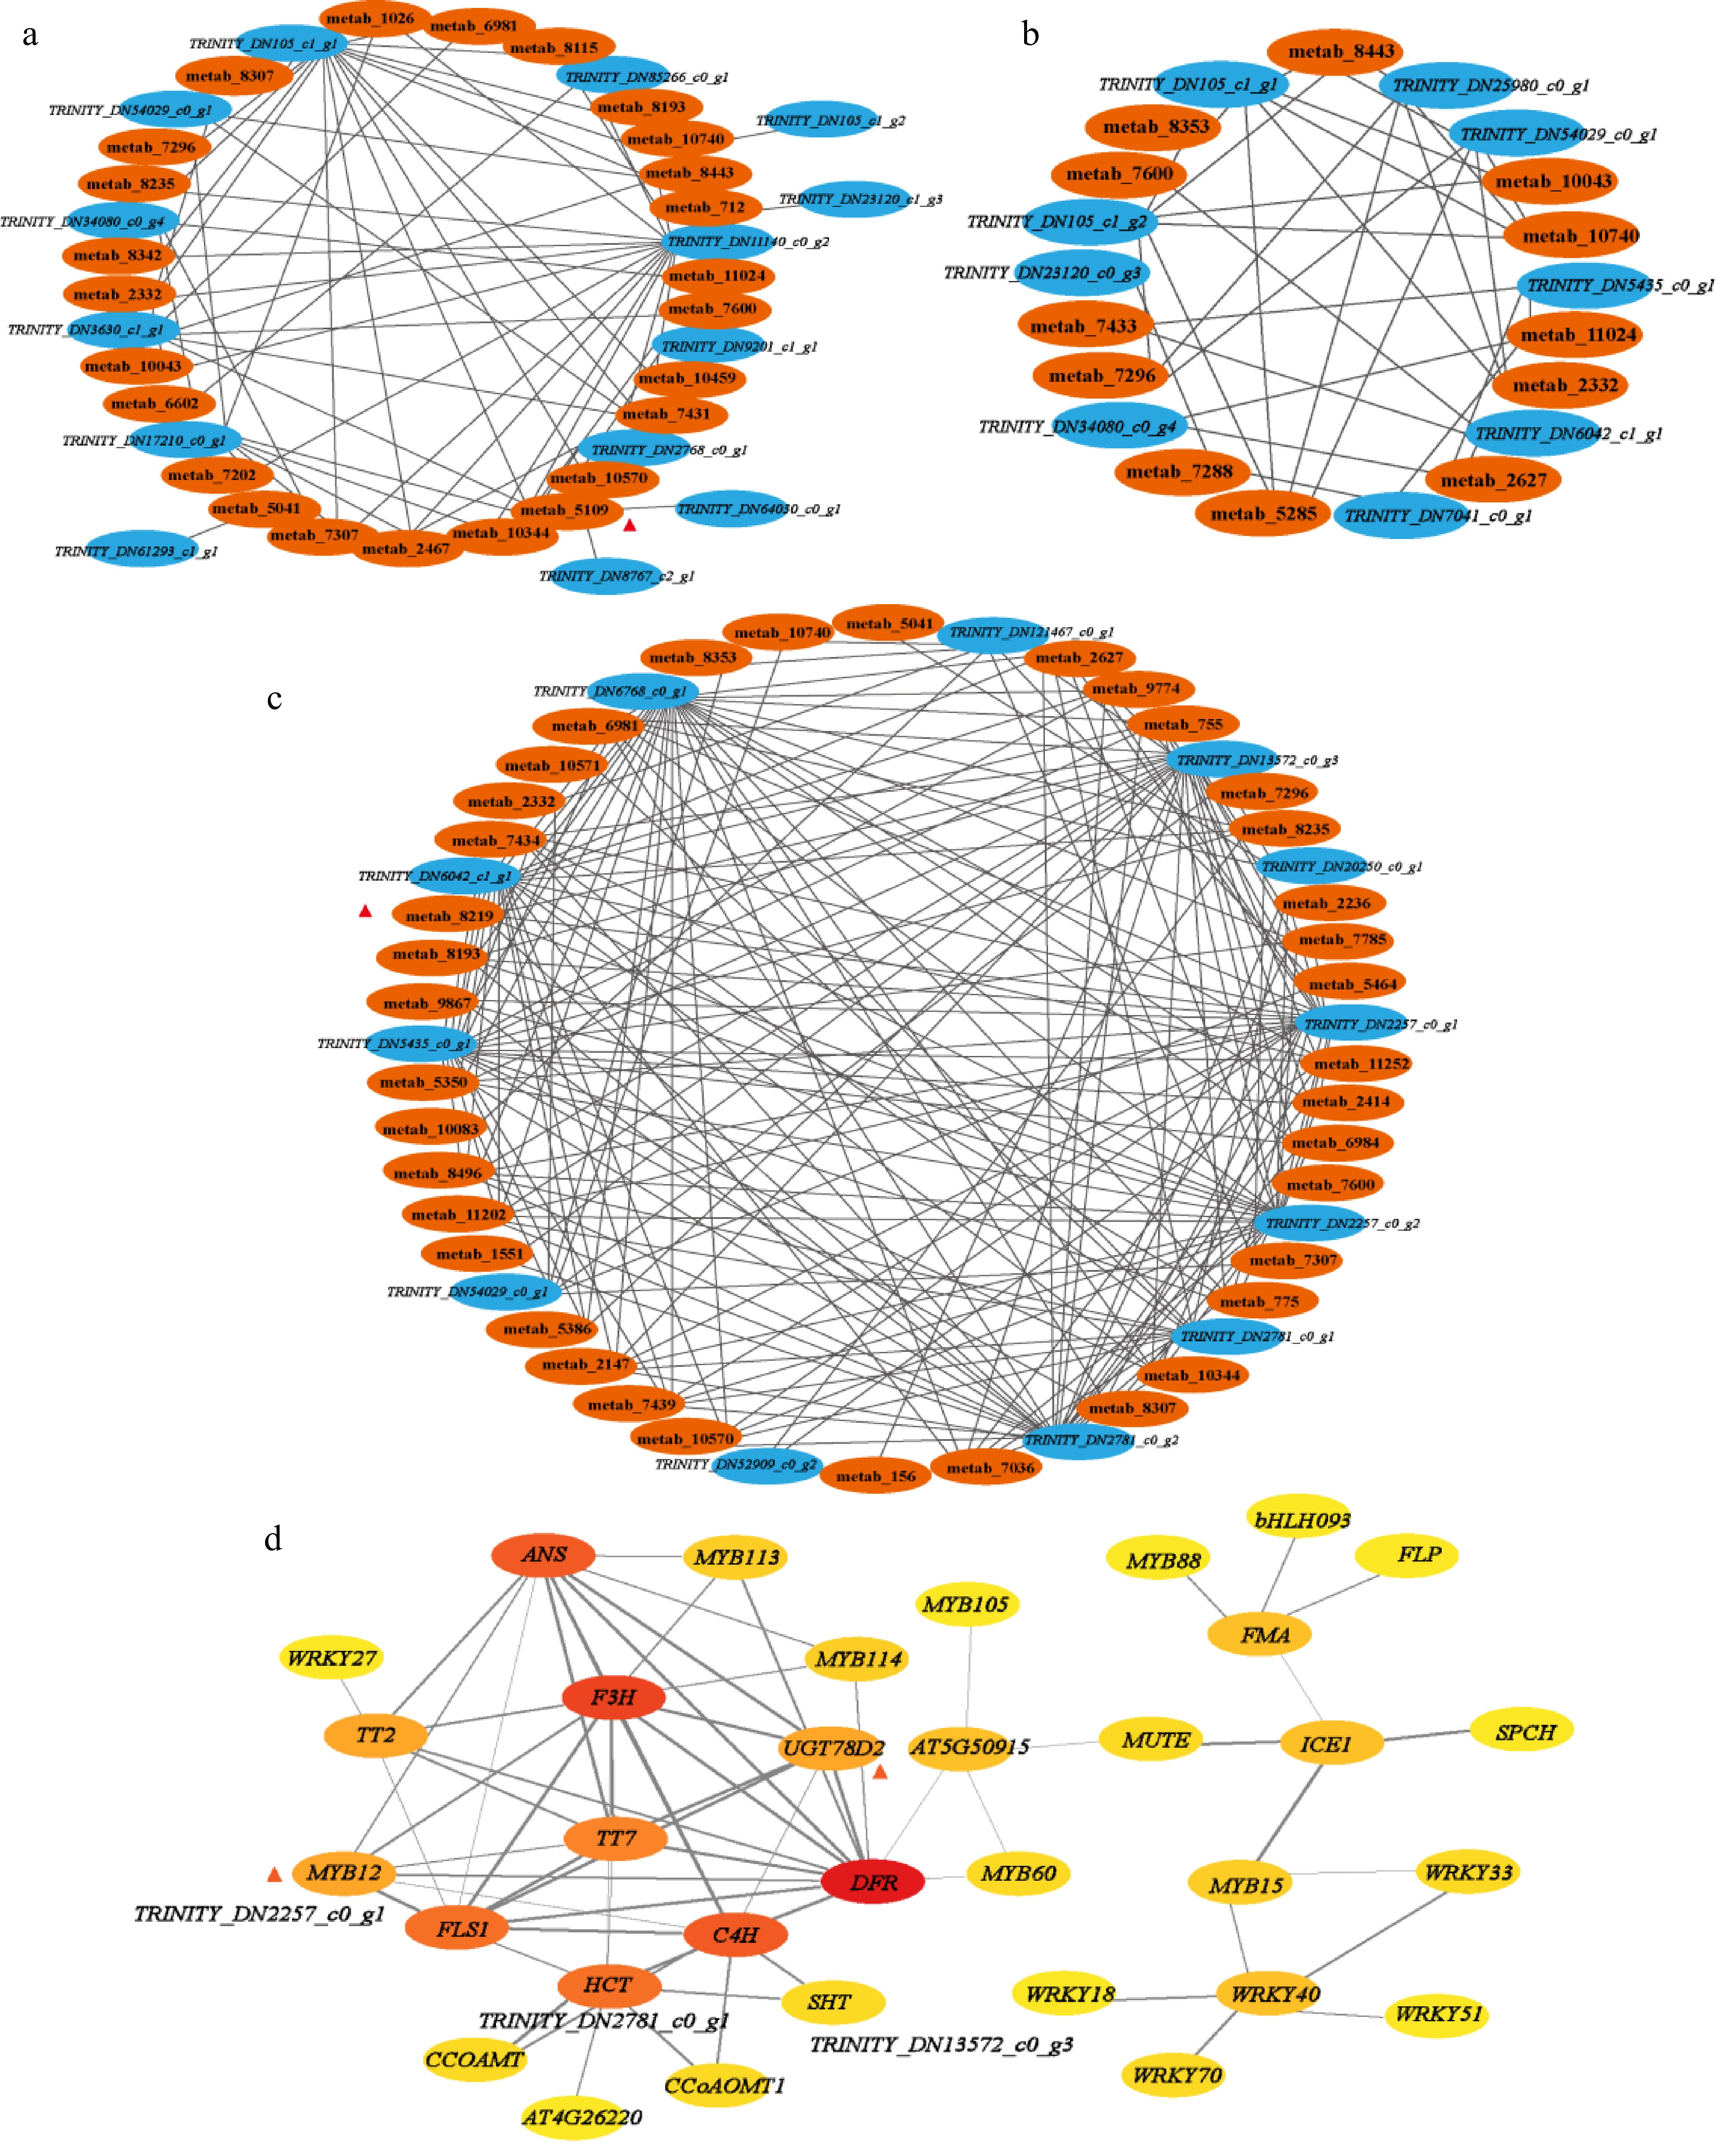
Figure 3.
Connection network of differential accumulation of flavonoids biosynthesis related metabolites and related genes: (a) stage of bud to first leaf, (b) stage of first leaf to second leaf, (c) stage of second leaf to third leaf, R > 0.9. (d) Protein interaction network between different genes. Score > 0.7.
-
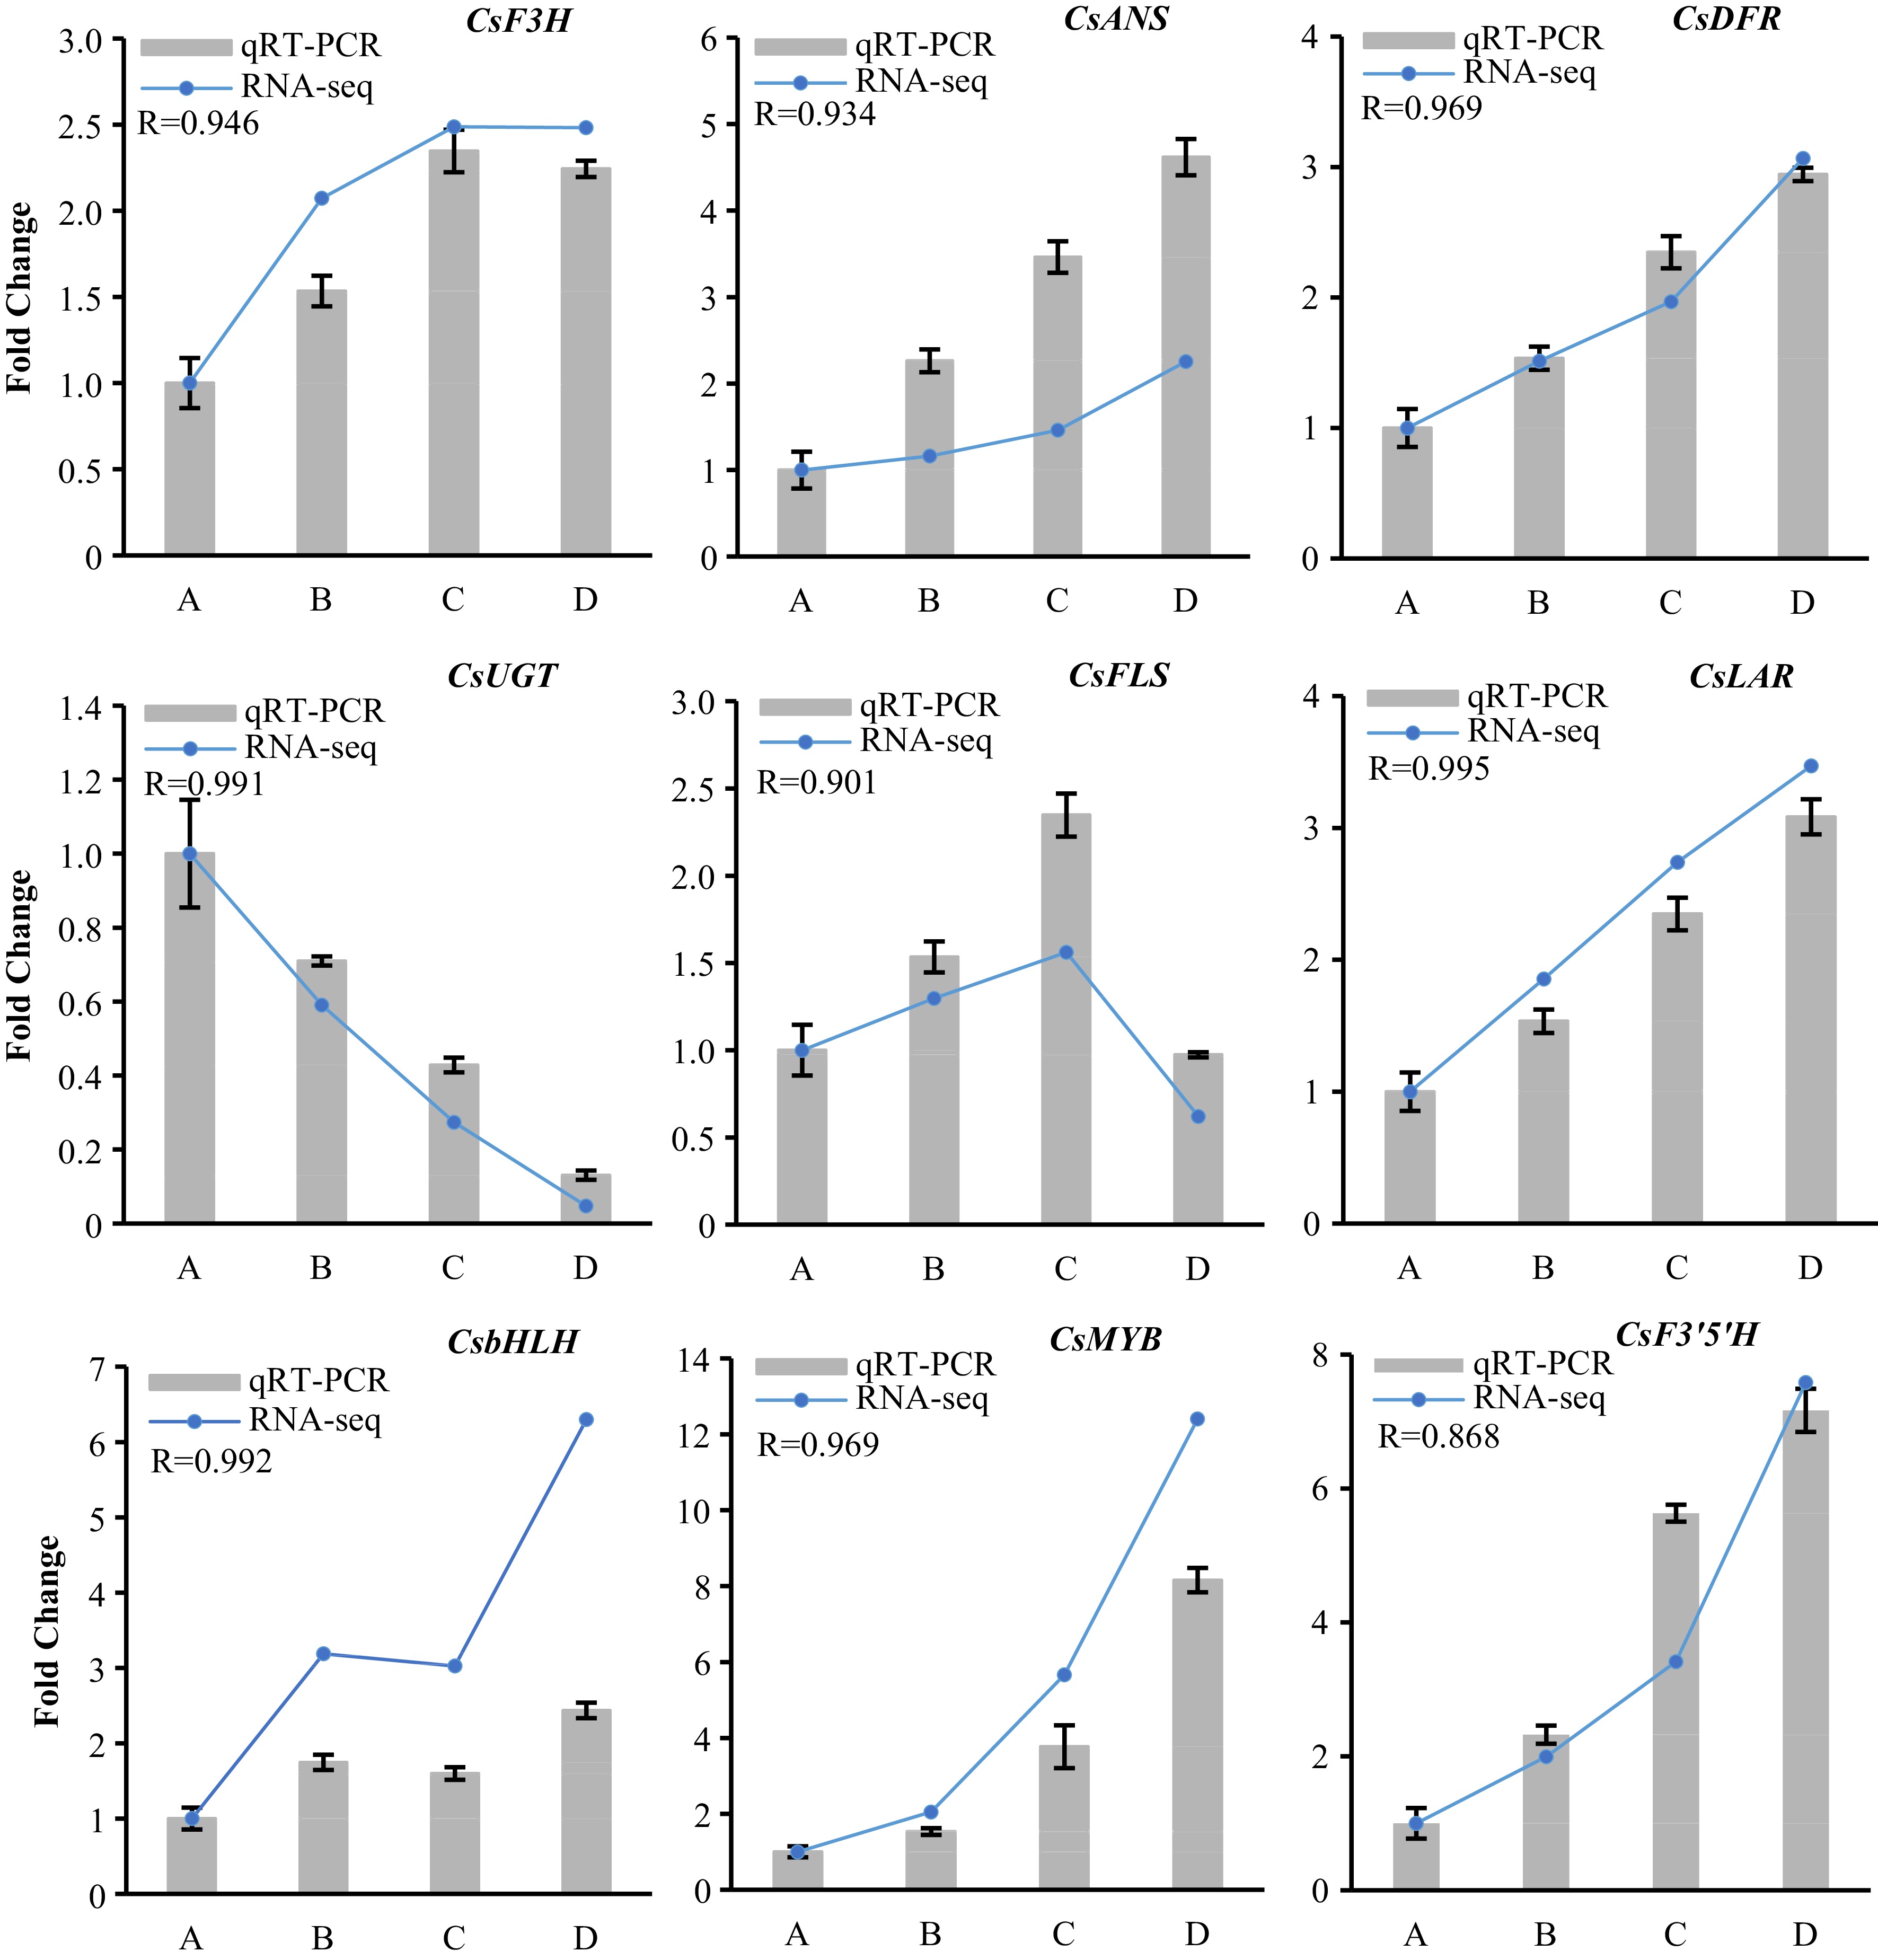
Figure 4.
Quantitative real-time PCR verified the flavonoid-biosynthesis related differentially expressed structure genes and TFs (DEGs) in developing tender shoots of ‘P113’. Relative expression levels of qRT-PCR were calculated using GADPH-actin as a standard. The Pearson correlation coefficient (R) represents correlation between qRT-PCR and RNA-seq of each tested gene in all samples.
Figures
(4)
Tables
(0)