-
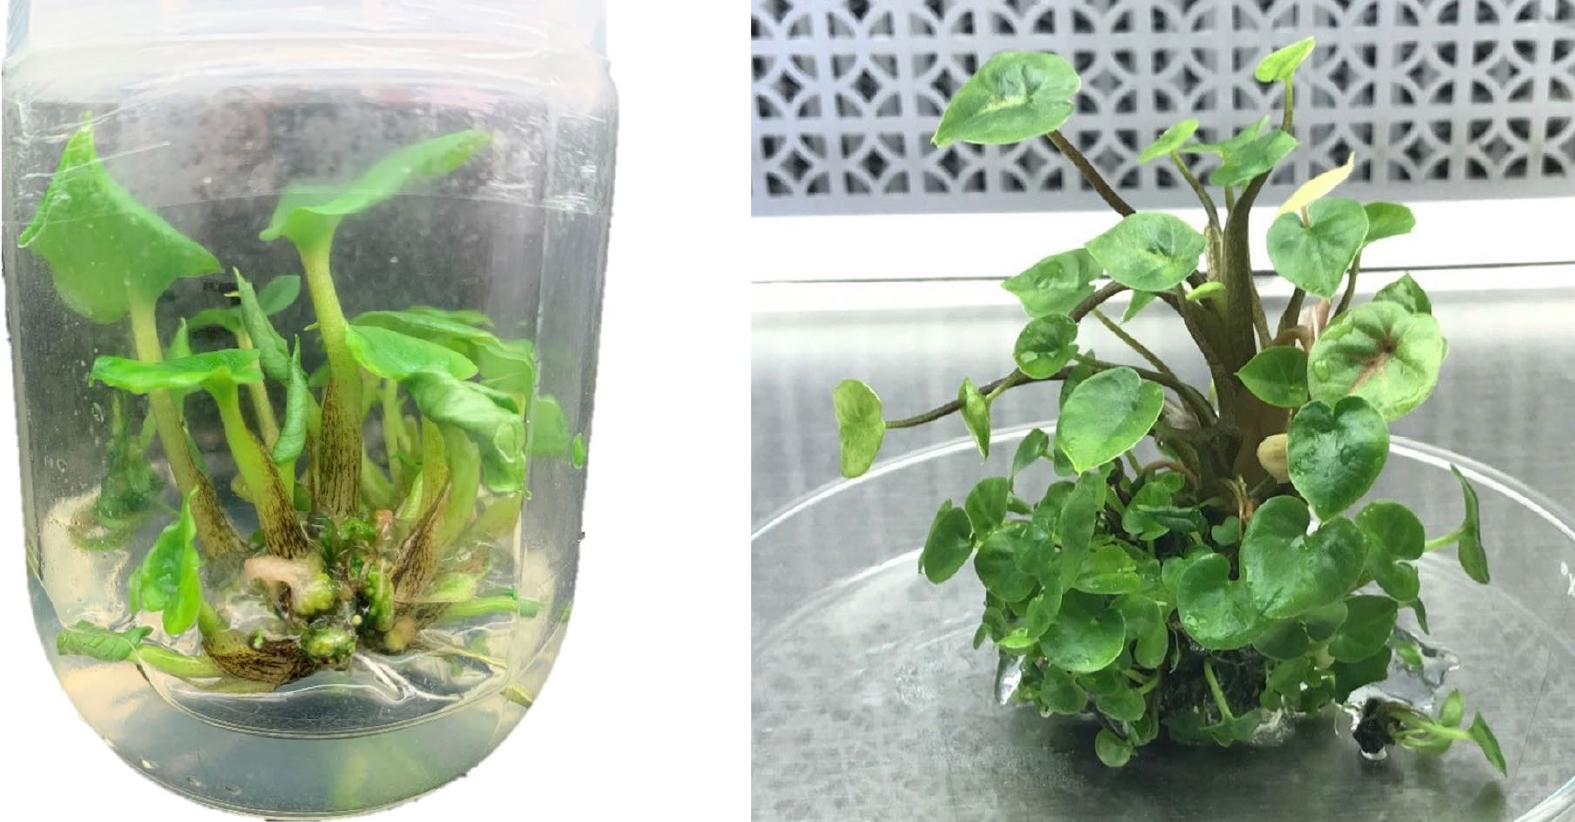
Figure 1.
Caladium micropropagation in baby food jars (6 cm wide and 10 cm tall) (left) and during sub-culturing in a large glass Petri dish (approximately 15 cm diameter) (right). During micropropagation, plantlets were sub-cultured to new multiplication media every 4−6 weeks.
-
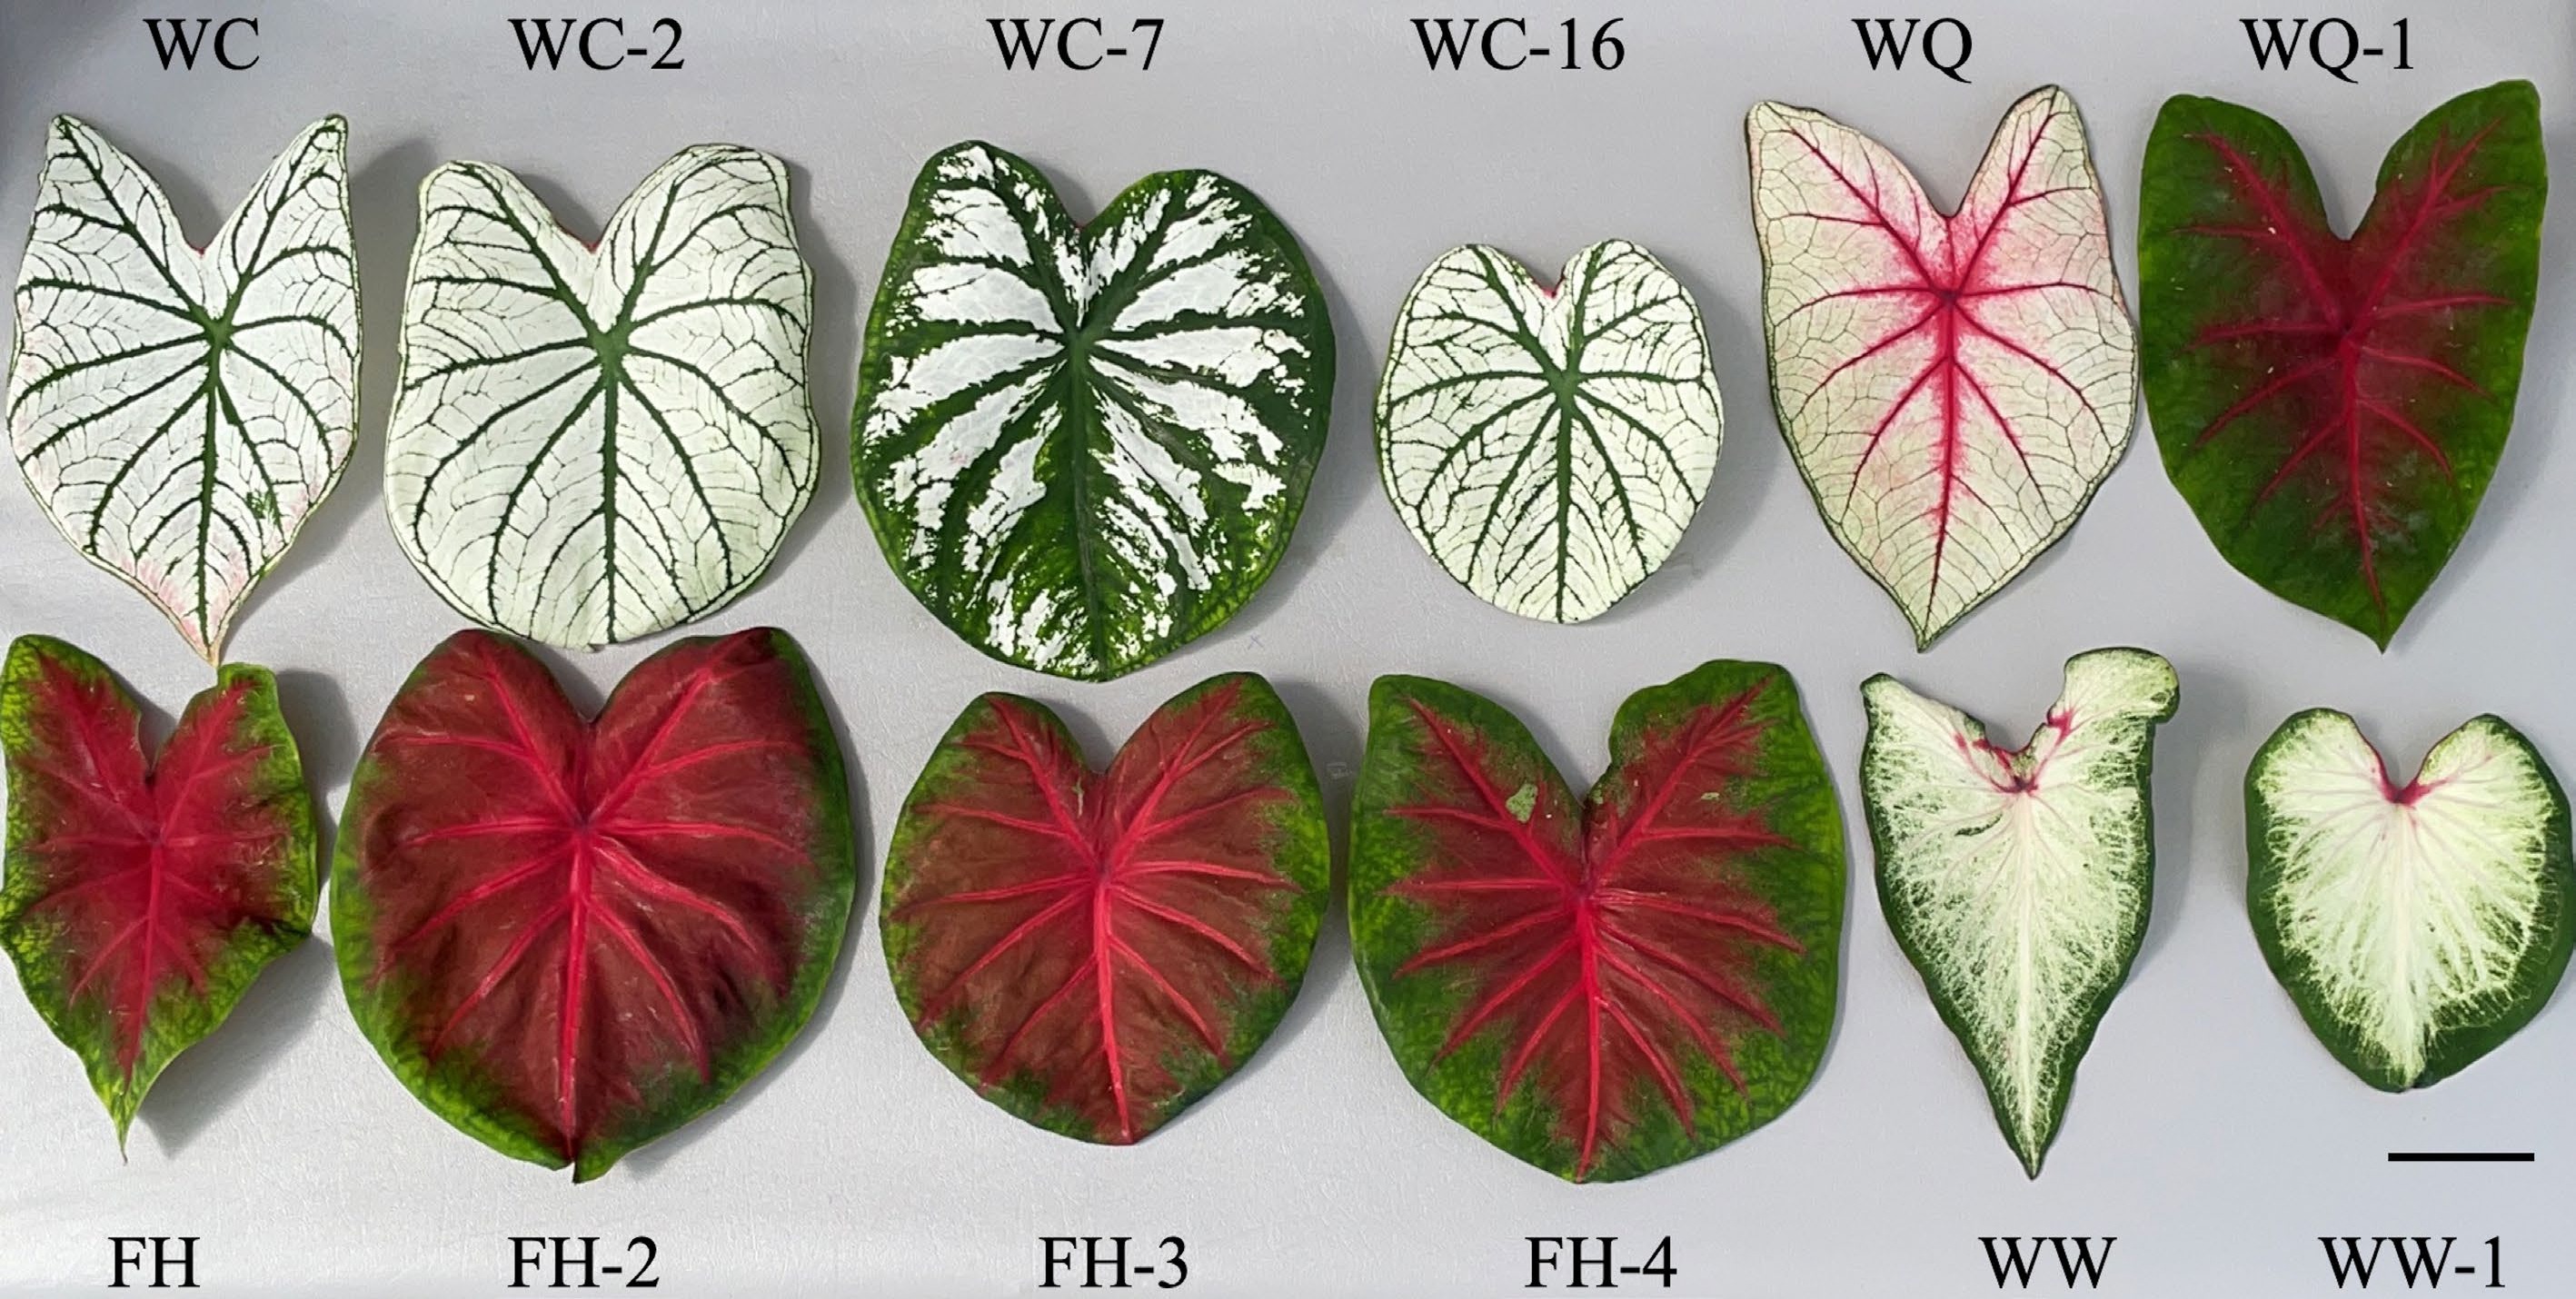
Figure 2.
Typical leaves of caladium somaclonal variants next to their respective wildtypes. Images were taken at time of data collection 17 weeks after planting at the University of Florida/IFAS's Gulf Coast Research and Education Center (U.S.A.). Scale bar (bottom right corner) = 5 cm.
-
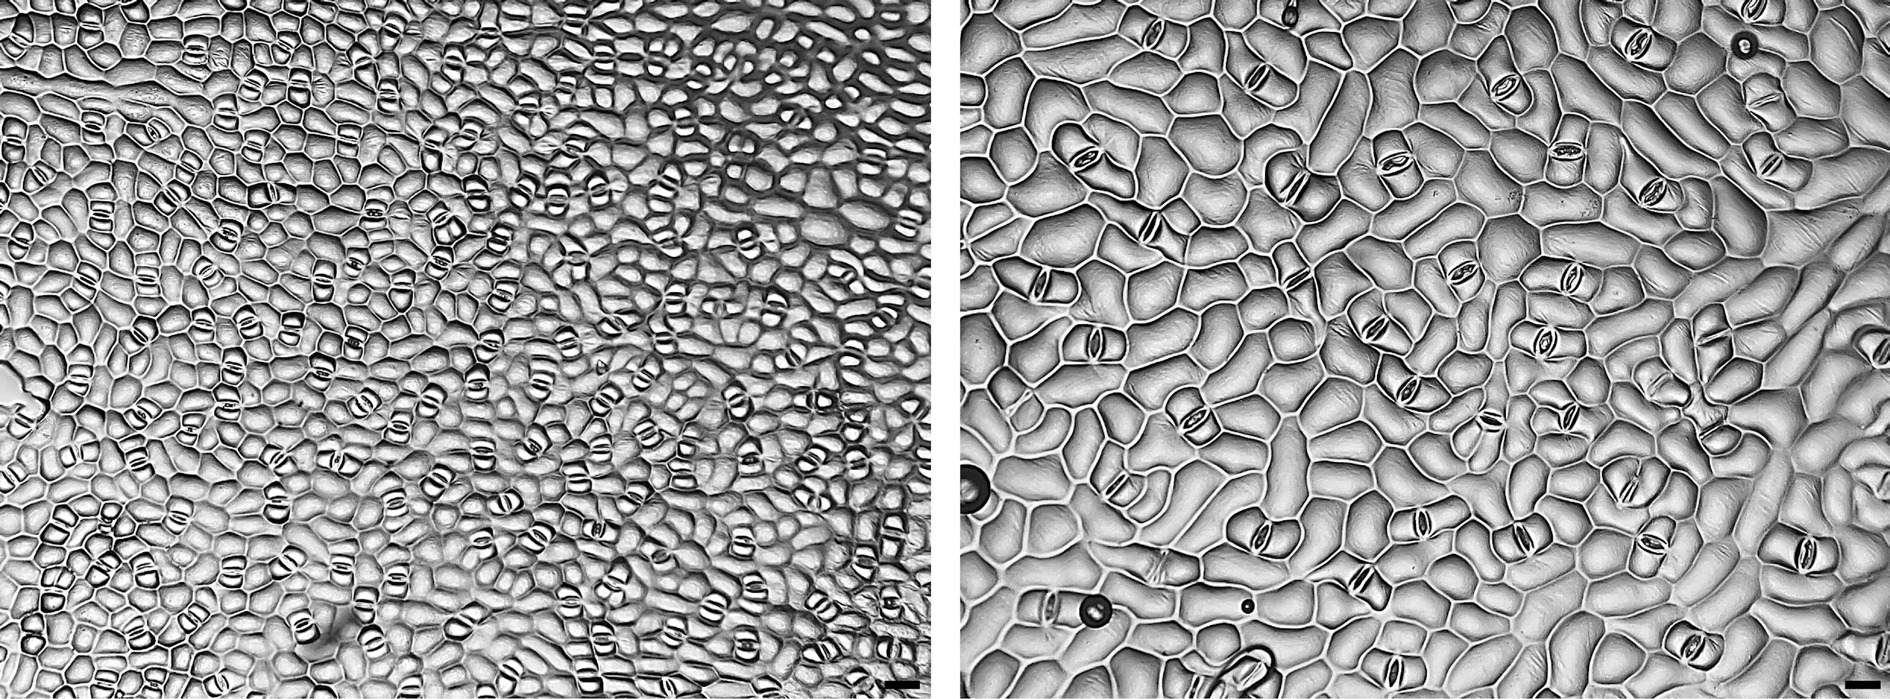
Figure 3.
Micrographs (×100) of stomata imprints from caladiums ‘Freida Hemple’ (diploid wildtype, left) and FH-4 (tetraploid variant, right). Clear nail polish was used to make stomata imprints on the abaxial side of the caladium leaves to be observed under a bright field microscope. Scale bar (bottom right corner) = 50 µm.
-
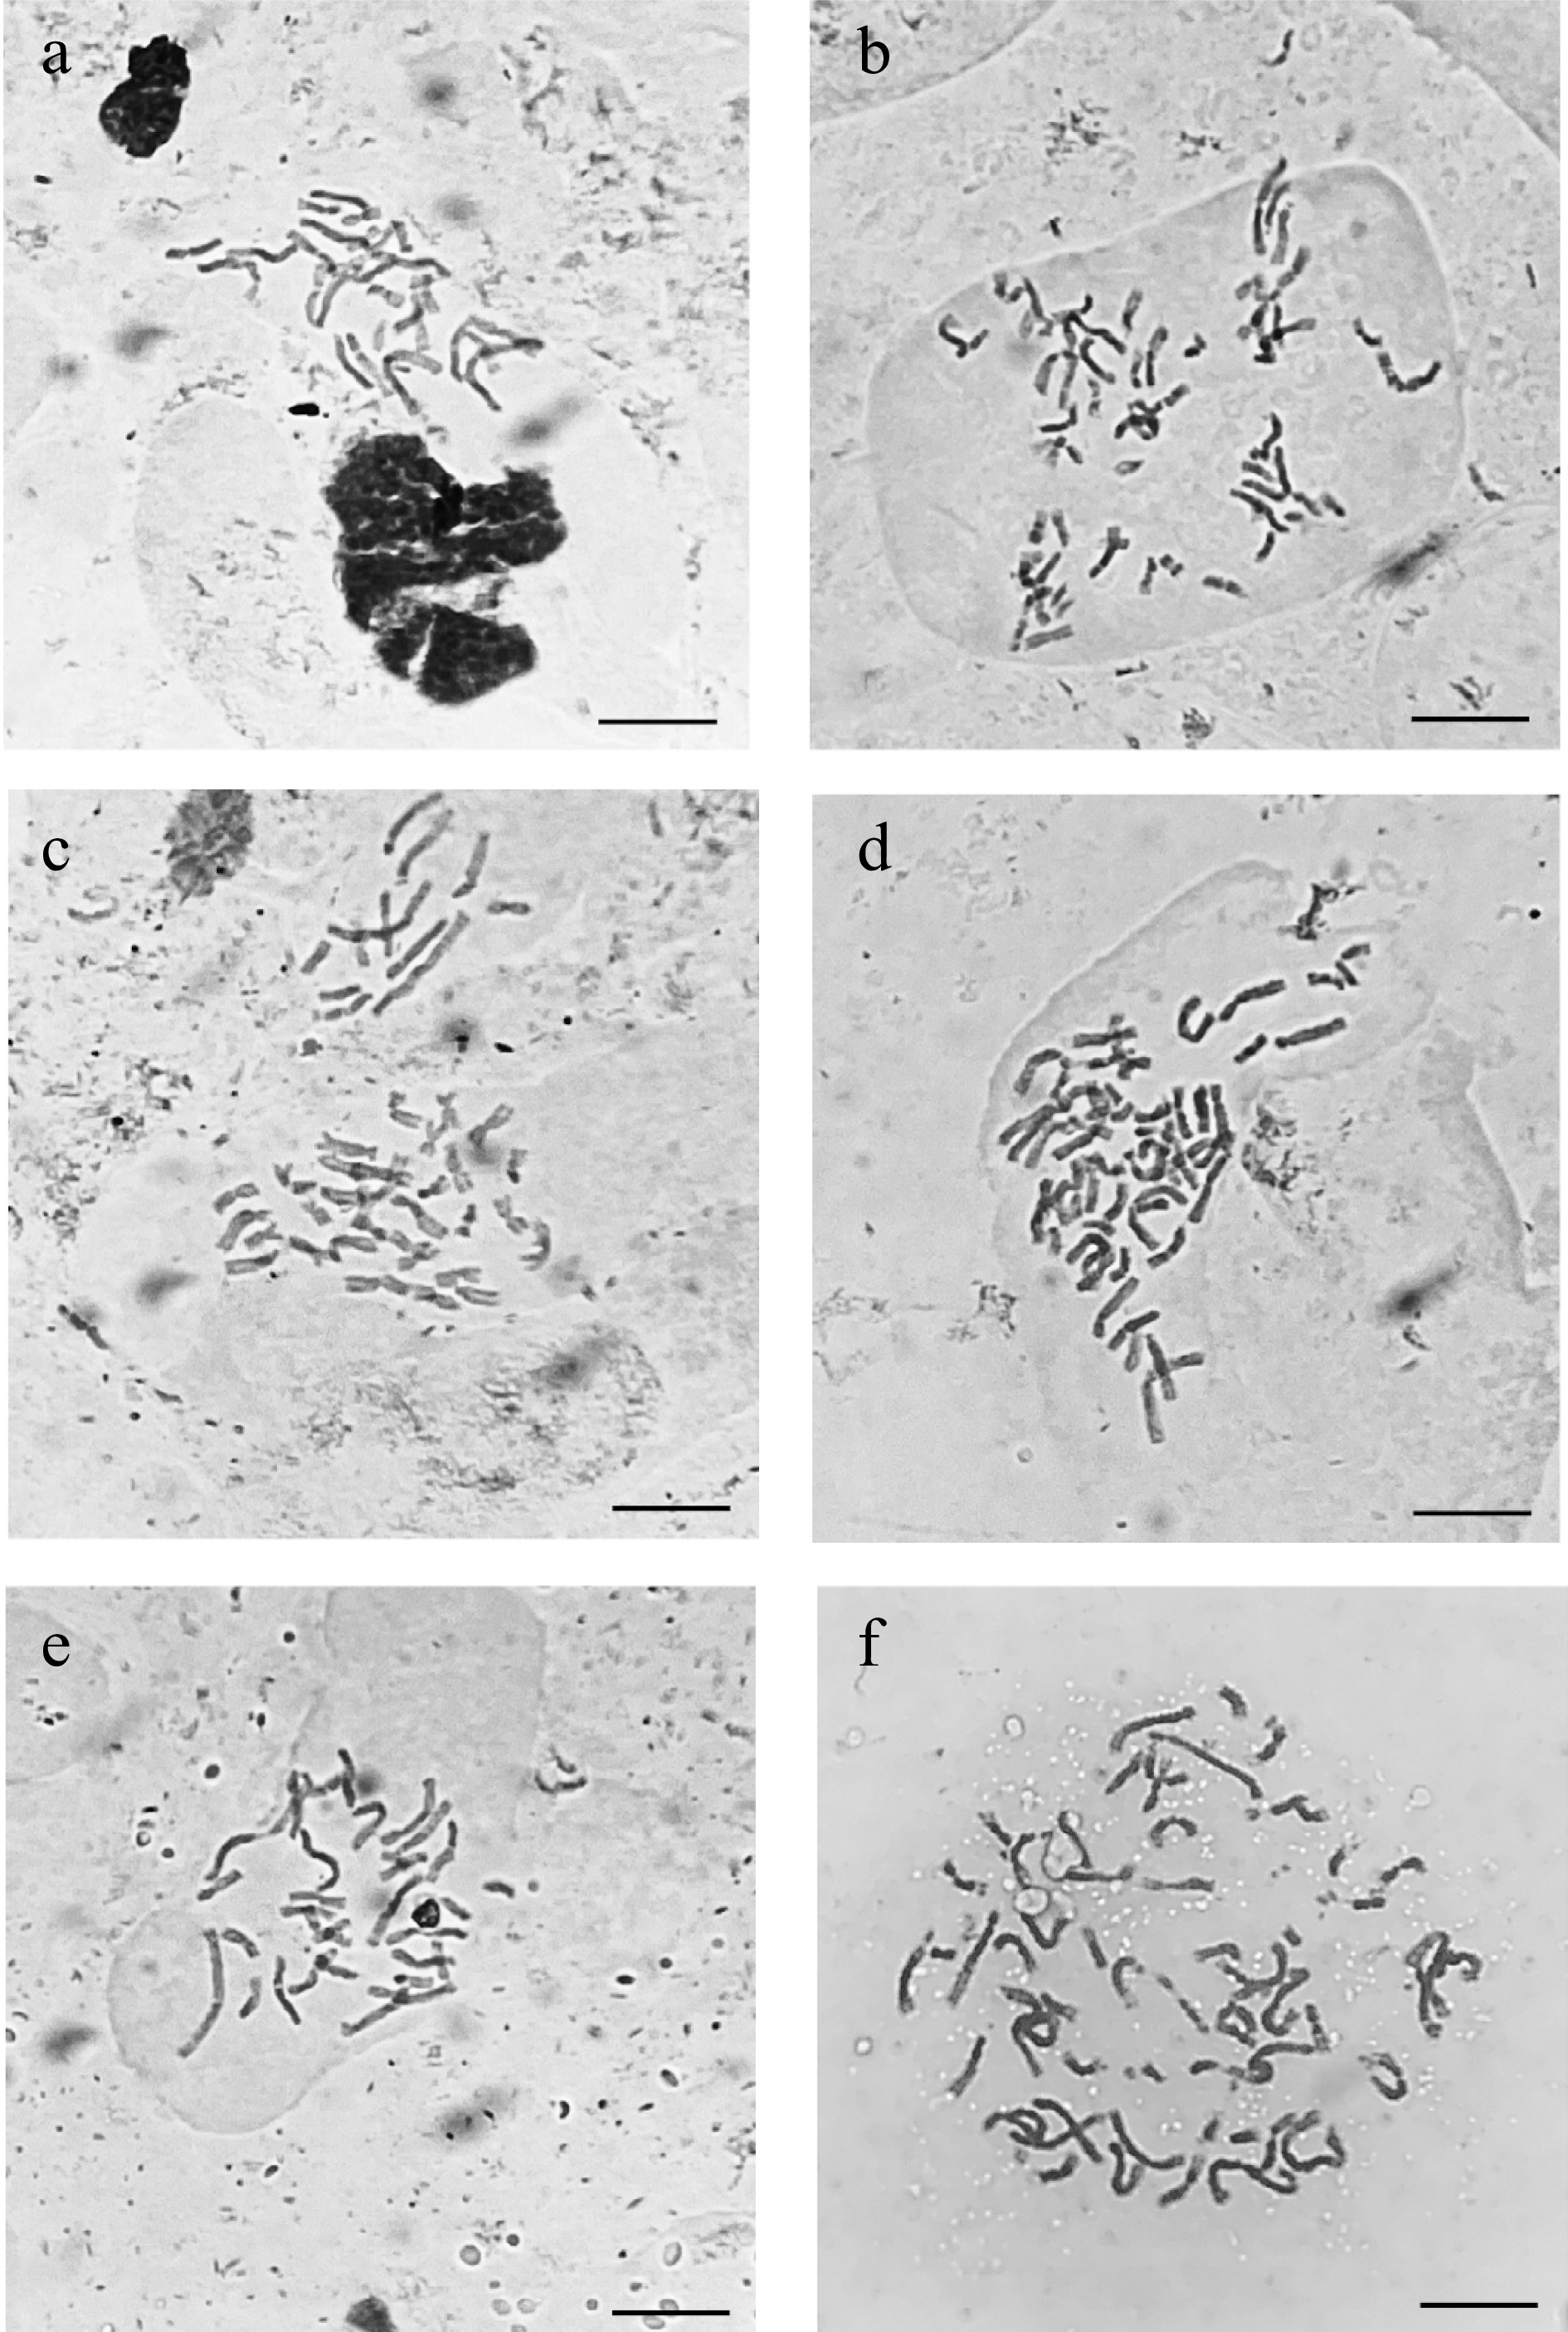
Figure 4.
Micrographs taken under a bright field microscope (×1000) of acetocarmine stained somatic chromosomes from caladium somaclonal variant and wildtype root tips. (a) 'Freida Hemple' (2n = 2x = 30). (b) FH-4 (2n = 4x = 60). (c) 'White Christmas' (2n = 2x = 30). (d) WC-7 (2n = 4x = 60). (e) 'White Wing' (2n = 2x = 30). (f) WW-1 (2n = 4x = 68). Scale bar (bottom right corner) = 10 µm.
-
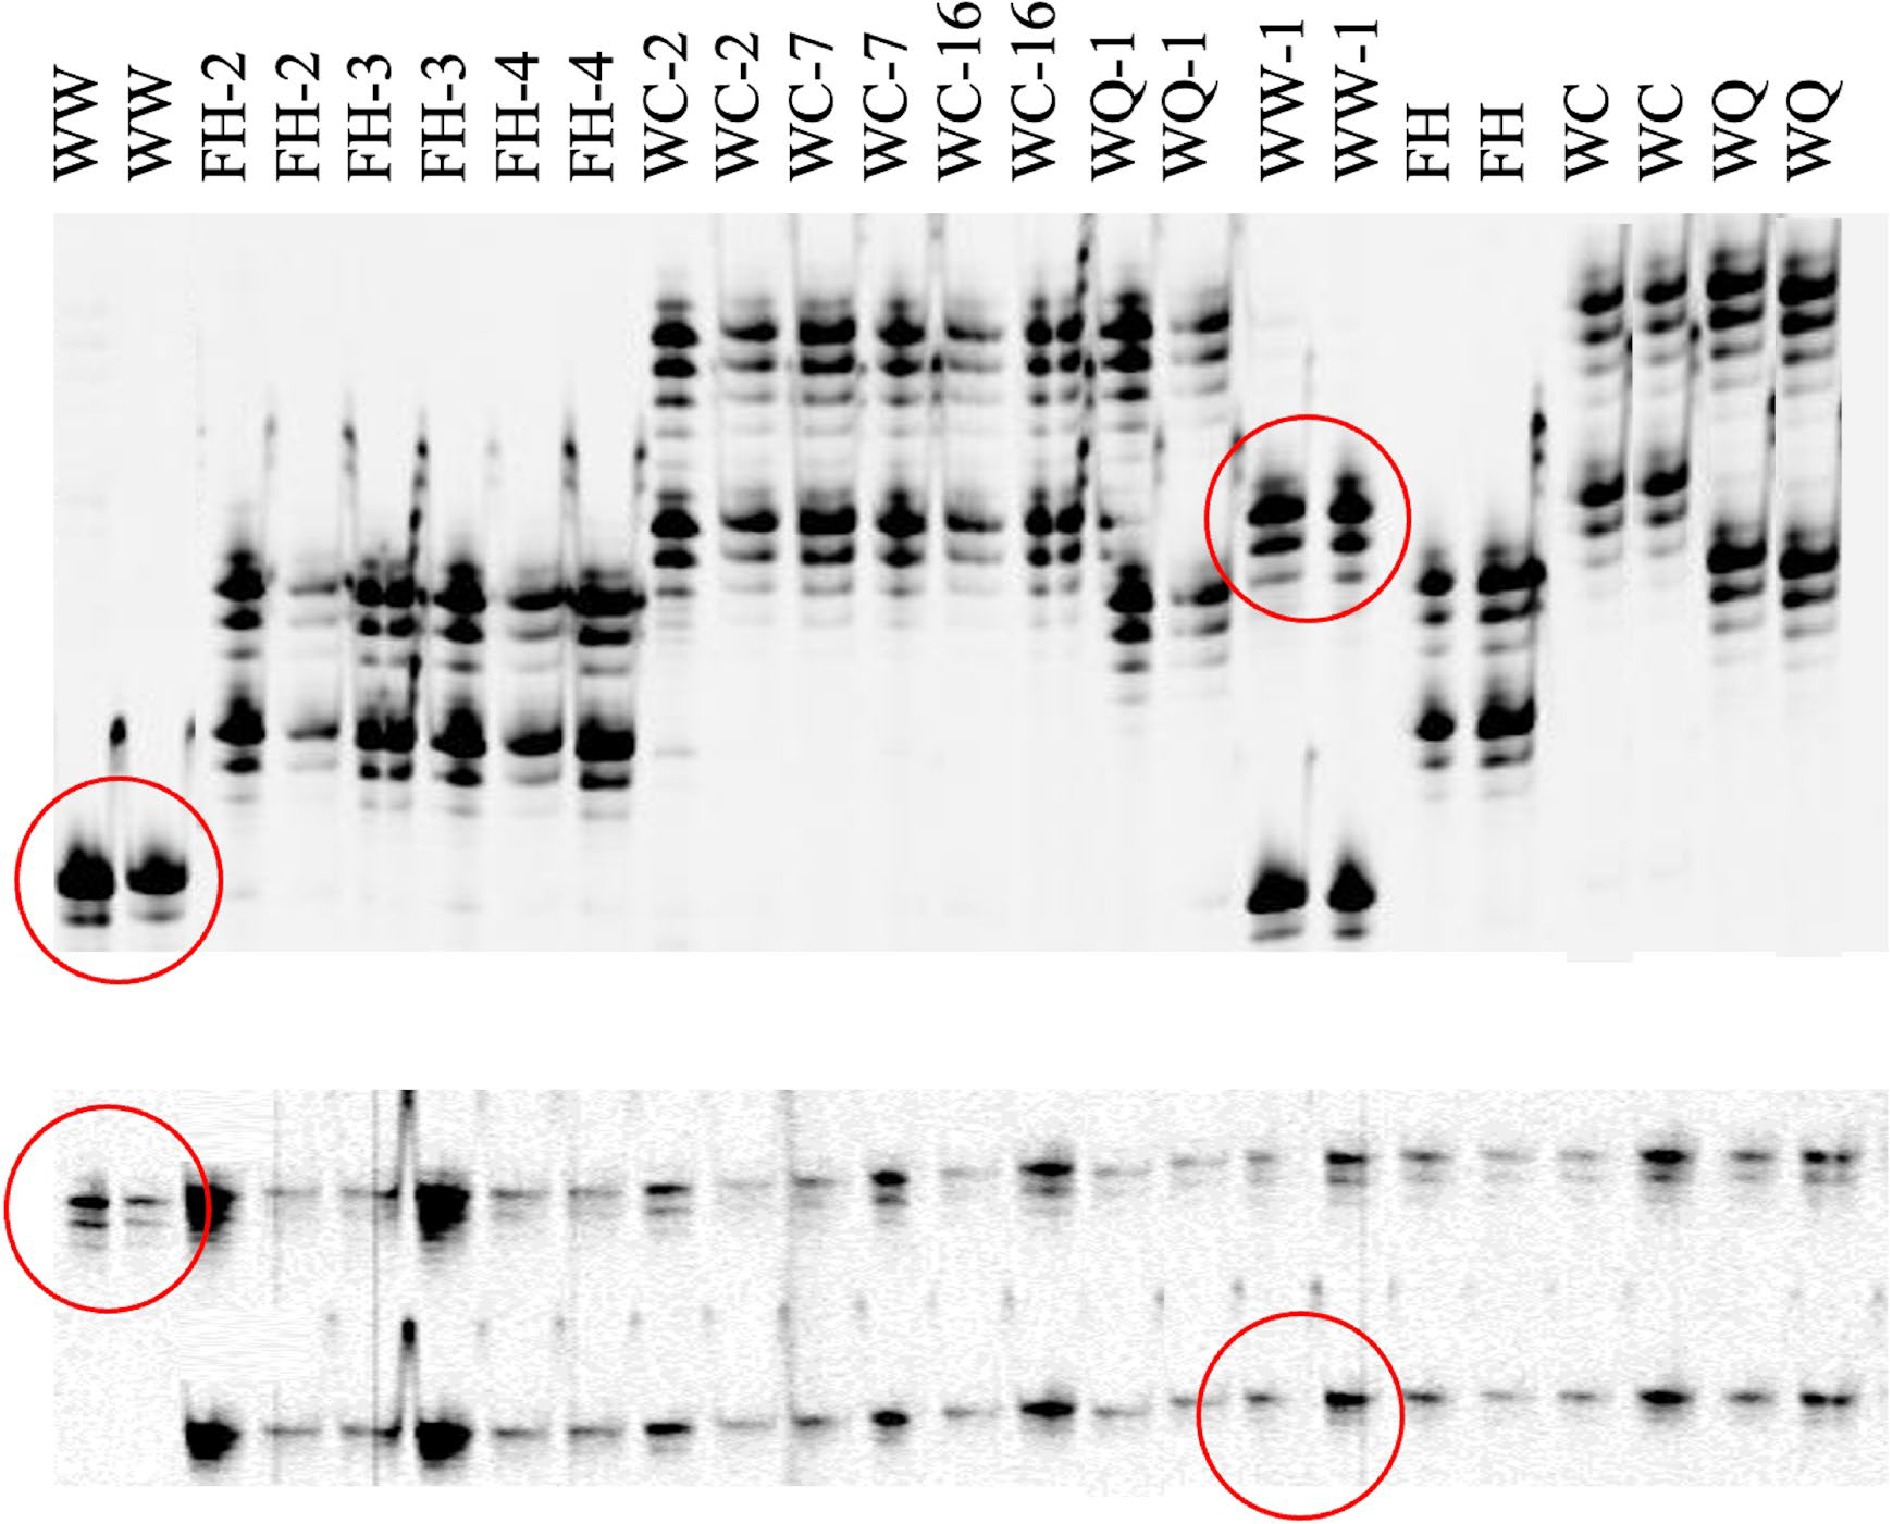
Figure 5.
Polyacrylamide infrared fluorescent gel images generated on a LiCOR 4300 of SSR markers CaM1 (top) and CaM62 (bottom) for caladium somaclonal variants and their wildtypes. Two PCR reactions were conducted using DNA samples from different plants. Wild type caladiums are identified as WW ('White Wing'), FH ('Freida Hemple'), WC (‘White Christmas’), and WQ (‘White Queen’). Polymorphisms between 'White Wing' (diploid wildtype) and WW-1 ('White Wing', tetraploid variant) are outlined in red.
-
Cultivar/somaclonal
variant (ploidy level)Leaf length/
width ratio
(mean ± SD)Leaf thickness (mm)
(mean ± SD)Leaf main vein
thickness (mm)
(mean ± SD)Petiole diam (mm)
(mean ± SD)Stomata density
(no. /mm2)
(mean ± SD)Stomata length
(µm)
(mean ± SD)Stomata width
(µm)
(mean ± SD)White Wing (2x) 1.72 ± 0.20 aa 0.31 ± 0.02 b 1.34 ± 0.28 b 2.84 ± 0.30 b 55.47 ± 7.64 a 31.03 ± 3.51 b 17.37 ± 2.22 b WW-1 (4x) 1.37 ± 0.16 b 0.43 ± 0.03 a 1.58 ± 0.26 a 3.57 ± 1.65 a 34.53 ± 7.16 b 42.03 ± 4.26 a 21.90 ± 3.09 a Freida Hemple (2x) 1.58 ± 0.13 a 0.26 ± 0.02 b 1.40 ± 0.27 b 3.72 ± 0.34 b 104.17 ± 7.27 a 28.33 ± 3.39 b 16.77 ± 2.43 c FH-2 (4x) 1.27 ± 0.14 b 0.39 ± 0.02 a 1.89 ± 0.33 ab 4.73 ± 0.70 a 38.33 ± 2.93 b 45.60 ± 5.92 a 23.03 ± 3.00 a FH-3 (4x) 1.25 ± 0.11 b 0.39 ± 0.04 a 1.86 ± 0.35 ab 4.80 ± 0.95 a 40.26 ± 3.48 b 47.30 ± 4.72 a 22.10 ± 2.73 a FH-4 (4x) 1.24 ± 0.12 b 0.40 ± 0.02 a 2.51 ± 1.61 a 5.29 ± 0.70 a 40.16 ± 2.50 b 46.20 ± 4.38 a 19.90 ± 2.52 b White Christmas (2x) 1.55 ± 0.14 a 0.25 ± 0.03 c 1.66 ± 0.38 ab 3.56 ± 0.52 b 55.68 ± 7.42 a 30.20 ± 3.89 c 19.23 ± 1.85 b WC-2 (4x) 1.25 ± 0.16 b 0.37 ± 0.03 ab 1.49 ± 0.47 b 3.70 ± 0.77 b 16.56 ± 3.57 c 38.57 ± 4.33 a 22.03 ± 1.92 a WC-7 (4x) 1.25 ± 0.15 b 0.39 ± 0.02 a 1.89 ± 0.39 a 4.44 ± 0.42 a 16.56 ± 4.70 c 44.53 ± 4.76 a 23.53 ± 2.57 a WC-16 (4x) 1.25 ± 0.09 b 0.36 ± 0.03 b 1.47 ± 0.30 b 3.73 ± 0.54 b 28.49 ± 5.69 b 45.50 ± 4.61 b 23.60 ± 2.88 a White Queen (2x) 1.52 ± 0.12 a 0.26 ± 0.01 b 1.31 ± 0.18 a 3.18 ± 0.28 b 71.61 ± 7.08 b 30.57 ± 3.13 a 16.10 ± 1.69 a WQ-1 (2x) 1.41 ± 0.12 b 0.28 ± 0.02 a 1.29 ± 0.13 a 3.50 ± 0.48 a 97.34 ± 7.30 a 28.70 ± 2.39 b 15.47 ± 1.70 a a Means followed by the same letter within each column and group are not significantly different by Tukey's honestly significant difference test at the 5% level of significance. Table 1.
Caladium leaf morphological data comparing somaclonal variants to their respective wildtypes. Data were collected on five plants grown at the University of Florida/IFAS's Gulf Coast Research and Education Center (U.S.A.).
-
Cultivar/somaclonal
variantNuclear DNA
content (pg/2C)Nuclear DNA content
change compared
to wildtype (%)Metaphases
observedChromosome number Ploidy level White Wing 9.68 ± 0.02 ba 22 34 2x WW-1 19.16 ± 0.03 a 97.9 7 68 4x Freida Hemple 9.42 ± 0.02 d 3 30 2x FH-2 18.89 ± 0.02 a 100.4 4x FH-3 18.43 ± 0.03 c 95.6 4x FH-4 18.49 ± 0.02 b 96.2 2 60 4x White Christmas 9.15 ± 0.02 c 4 30 2x WC-2 18.71 ± 0.02 b 104.5 4x WC-7 18.89 ± 0.03 a 106.5 2 60 4x WC-16 18.72 ± 0.03 b 104.6 4x White Queen 9.38 ± 0.02 a 7 30 2x WQ-1 9.23 ± 0.01 b -1.6 9 30 2x a Means followed by the same letter within each column are not significantly different by Tukey's honestly significant difference test at the 5% level of significance. Table 2.
2C nuclear DNA (pg) and somatic chromosome numbers of somaclonal variants and wildtypes from four caladium cultivars. Three plants per selection were used for nine flow cytometrical analyses.
-
Marker CaM1a CaM18 CaM24 CaM42 CaM48 CaM62 CaM103 Band Numbers 1 2 3 4 5 1 2 1 2 1 2 1 2 3 1 2 1 2 White wing 5 1 2 2 1 2 1 2 1 2 WW-1 2 5 1 2 2 1 2 1 2 1 1 2 Freida hemple 3 4 1 1 2 1 2 1 2 1 2 FH-2 3 4 1 1 2 1 2 1 2 1 2 FH-3 3 4 1 1 2 1 2 1 2 1 2 FH-4 3 4 1 1 2 1 2 1 2 1 2 White christmas 1 2 2 1 2 2 3 1 2 1 2 WC-2 1 2 2 1 2 2 3 1 2 1 2 WC-7 1 2 2 1 2 2 3 1 2 1 2 WC-16 1 2 2 1 2 2 3 1 2 1 2 White Queen 1 3 2 2 2 1 2 1 1 2 WQ-1 1 3 2 2 2 1 2 1 1 2 a Numbers represent the bands produced based on relative size with 1 being the heaviest and n being the smallest. For example, a 1, 2 indicates that a given accession had two bands located on the gel at position 1 and 2 relative to the other bands present for a given marker. Table 3.
Microsatellite marker (SSR) banding patterns from somaclonal variants and their wildtypes. DNA was extracted from two separate plants and used for PCR and electrophoresis. The process was repeated once.
Figures
(5)
Tables
(3)