-
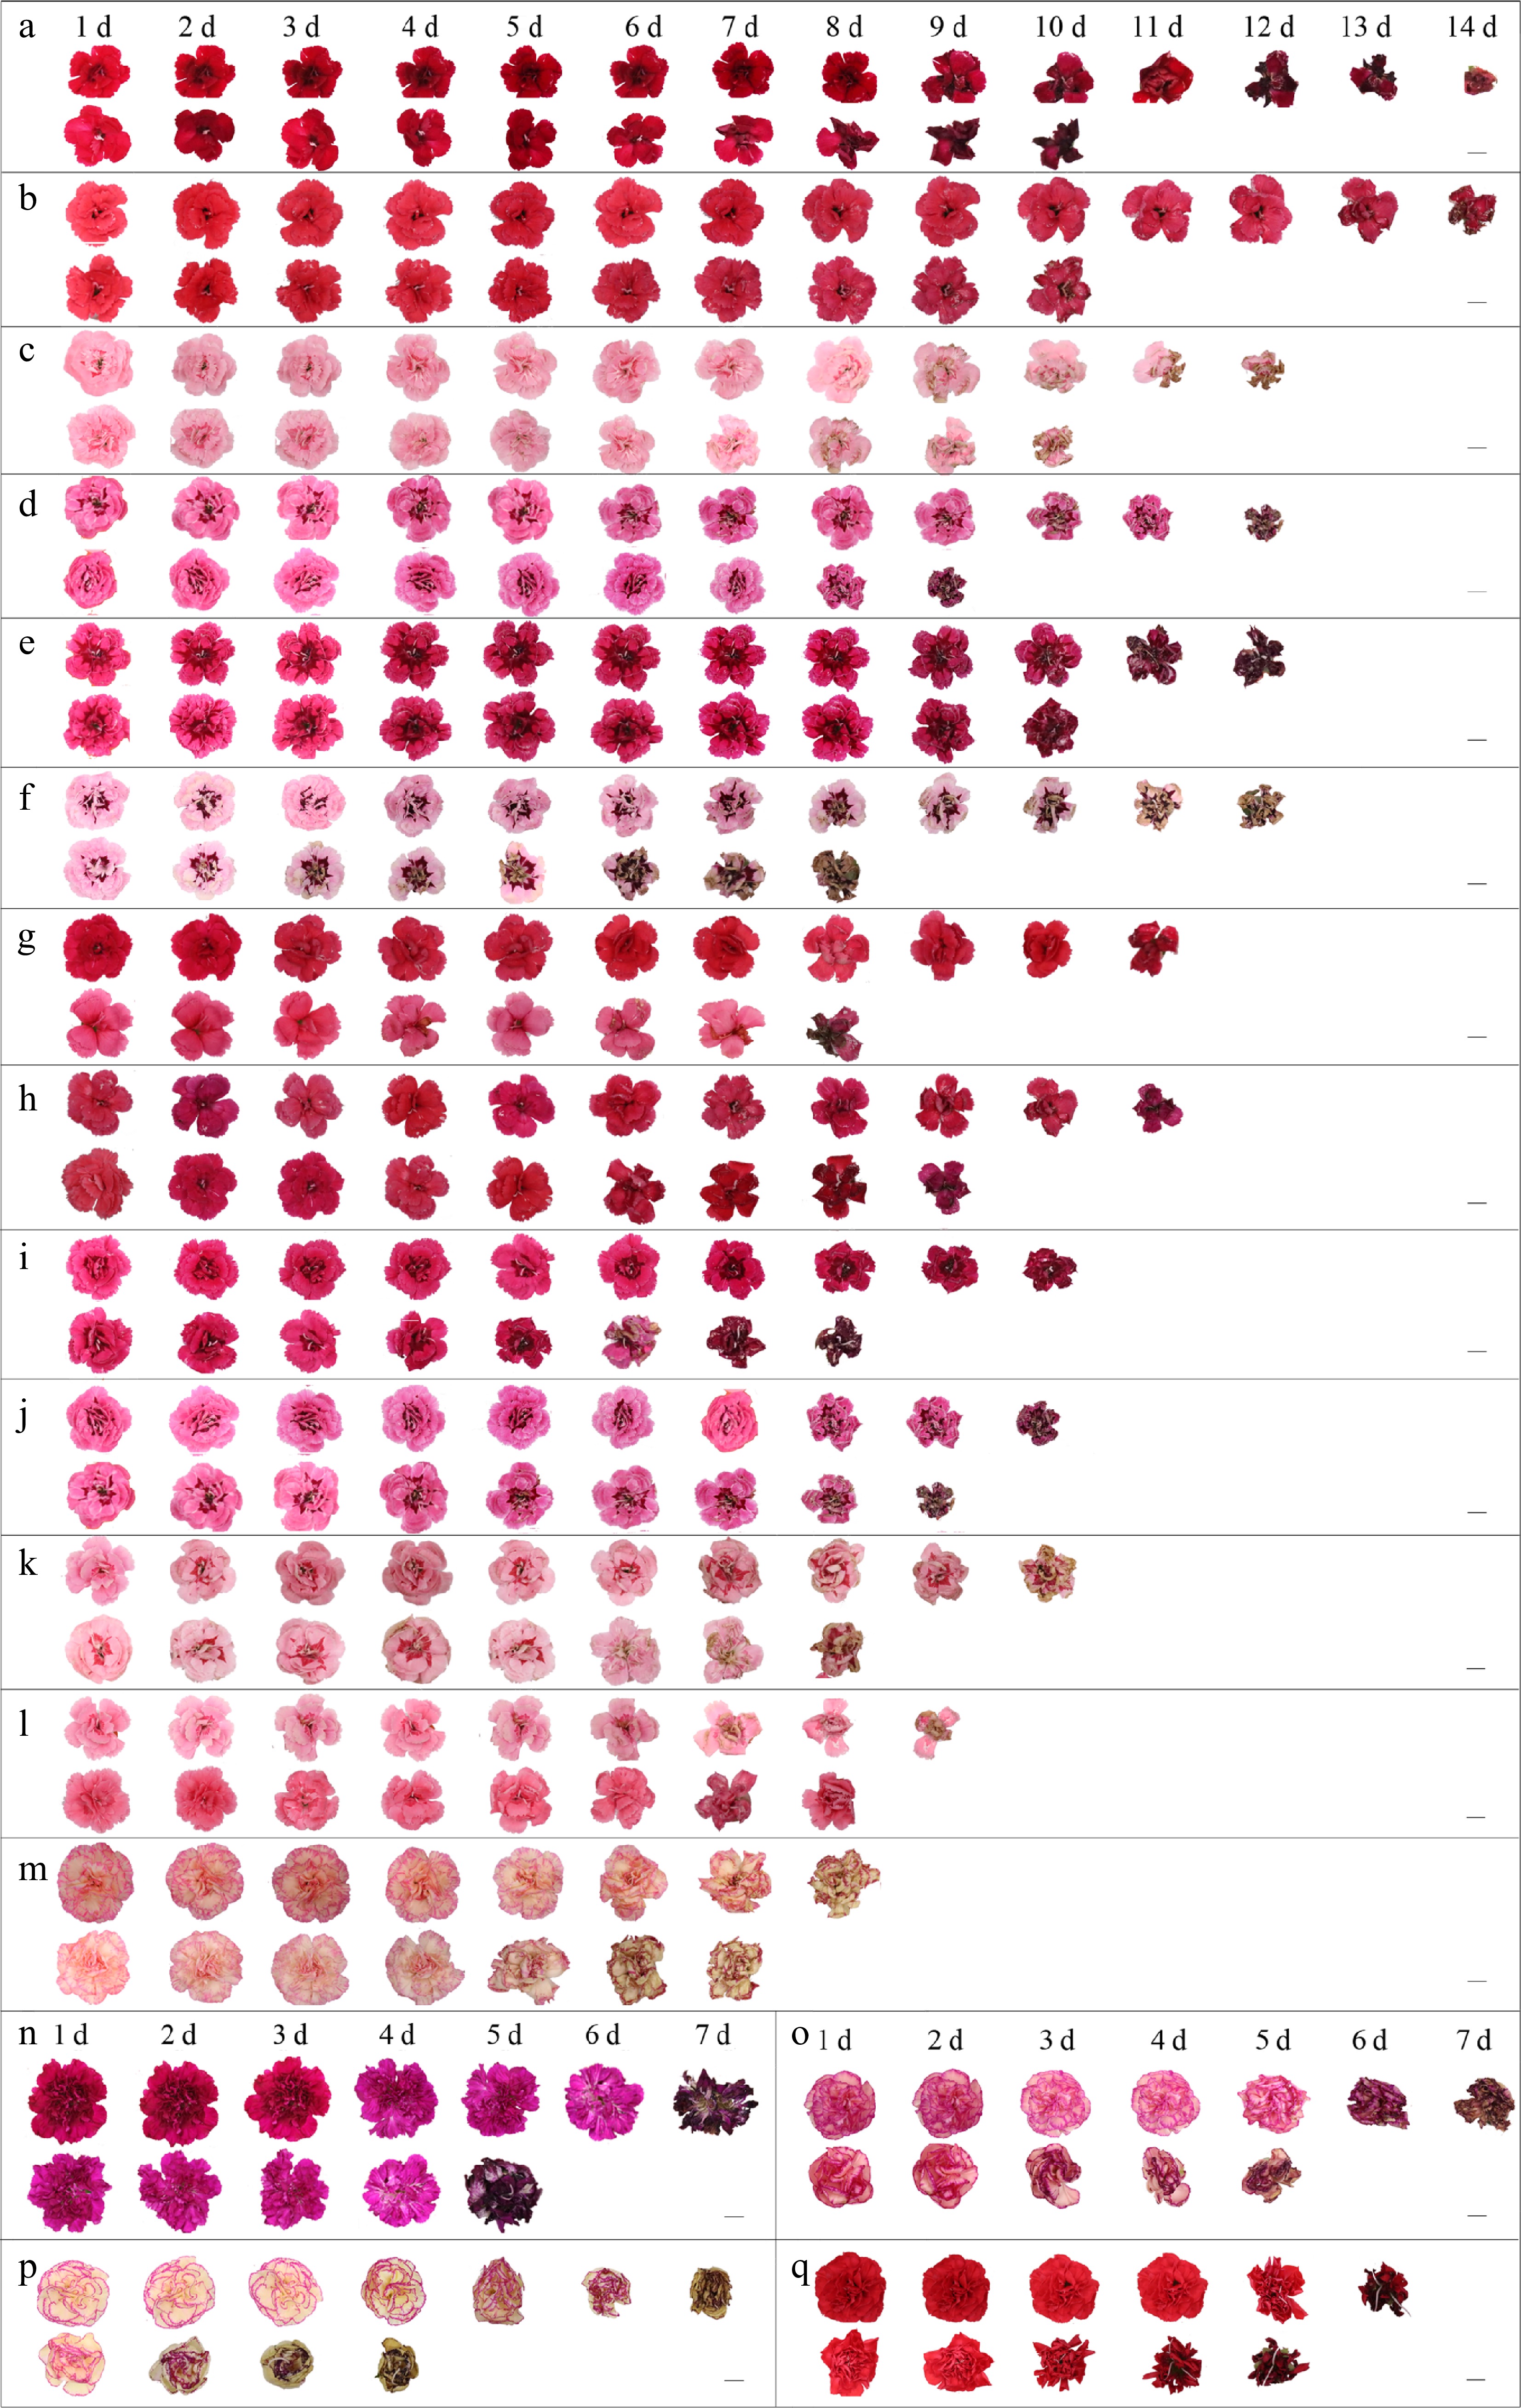
Figure 1.
Representative petal views of 17 potted carnation varieties during bottling. For each variety, the first row is a view of the petals in normal air and the second row is a view of the petals after treatment with 10 μL·L−1 exogenous ethylene for 4 h. (a) 'Cherry'. (b) 'Salmon'. (c) 'Pink Star'. (d) 'Oscar'. (e) 'Purple Wings'. (f) 'Purple Star'. (g) ‘Red’. (h) ‘Magenta’. (i) 'Violet and Pink'. (j) 'Pink and Purple'. (k) 'Red Star'. (l) 'Pink'. (m) 'Bondi Beach'. (n) 'Blinky Beach'. (o) 'Shark Bay'. (p) 'Grace Bay'. (q) 'Grane Beach'. Scale bar = 1 cm.
-
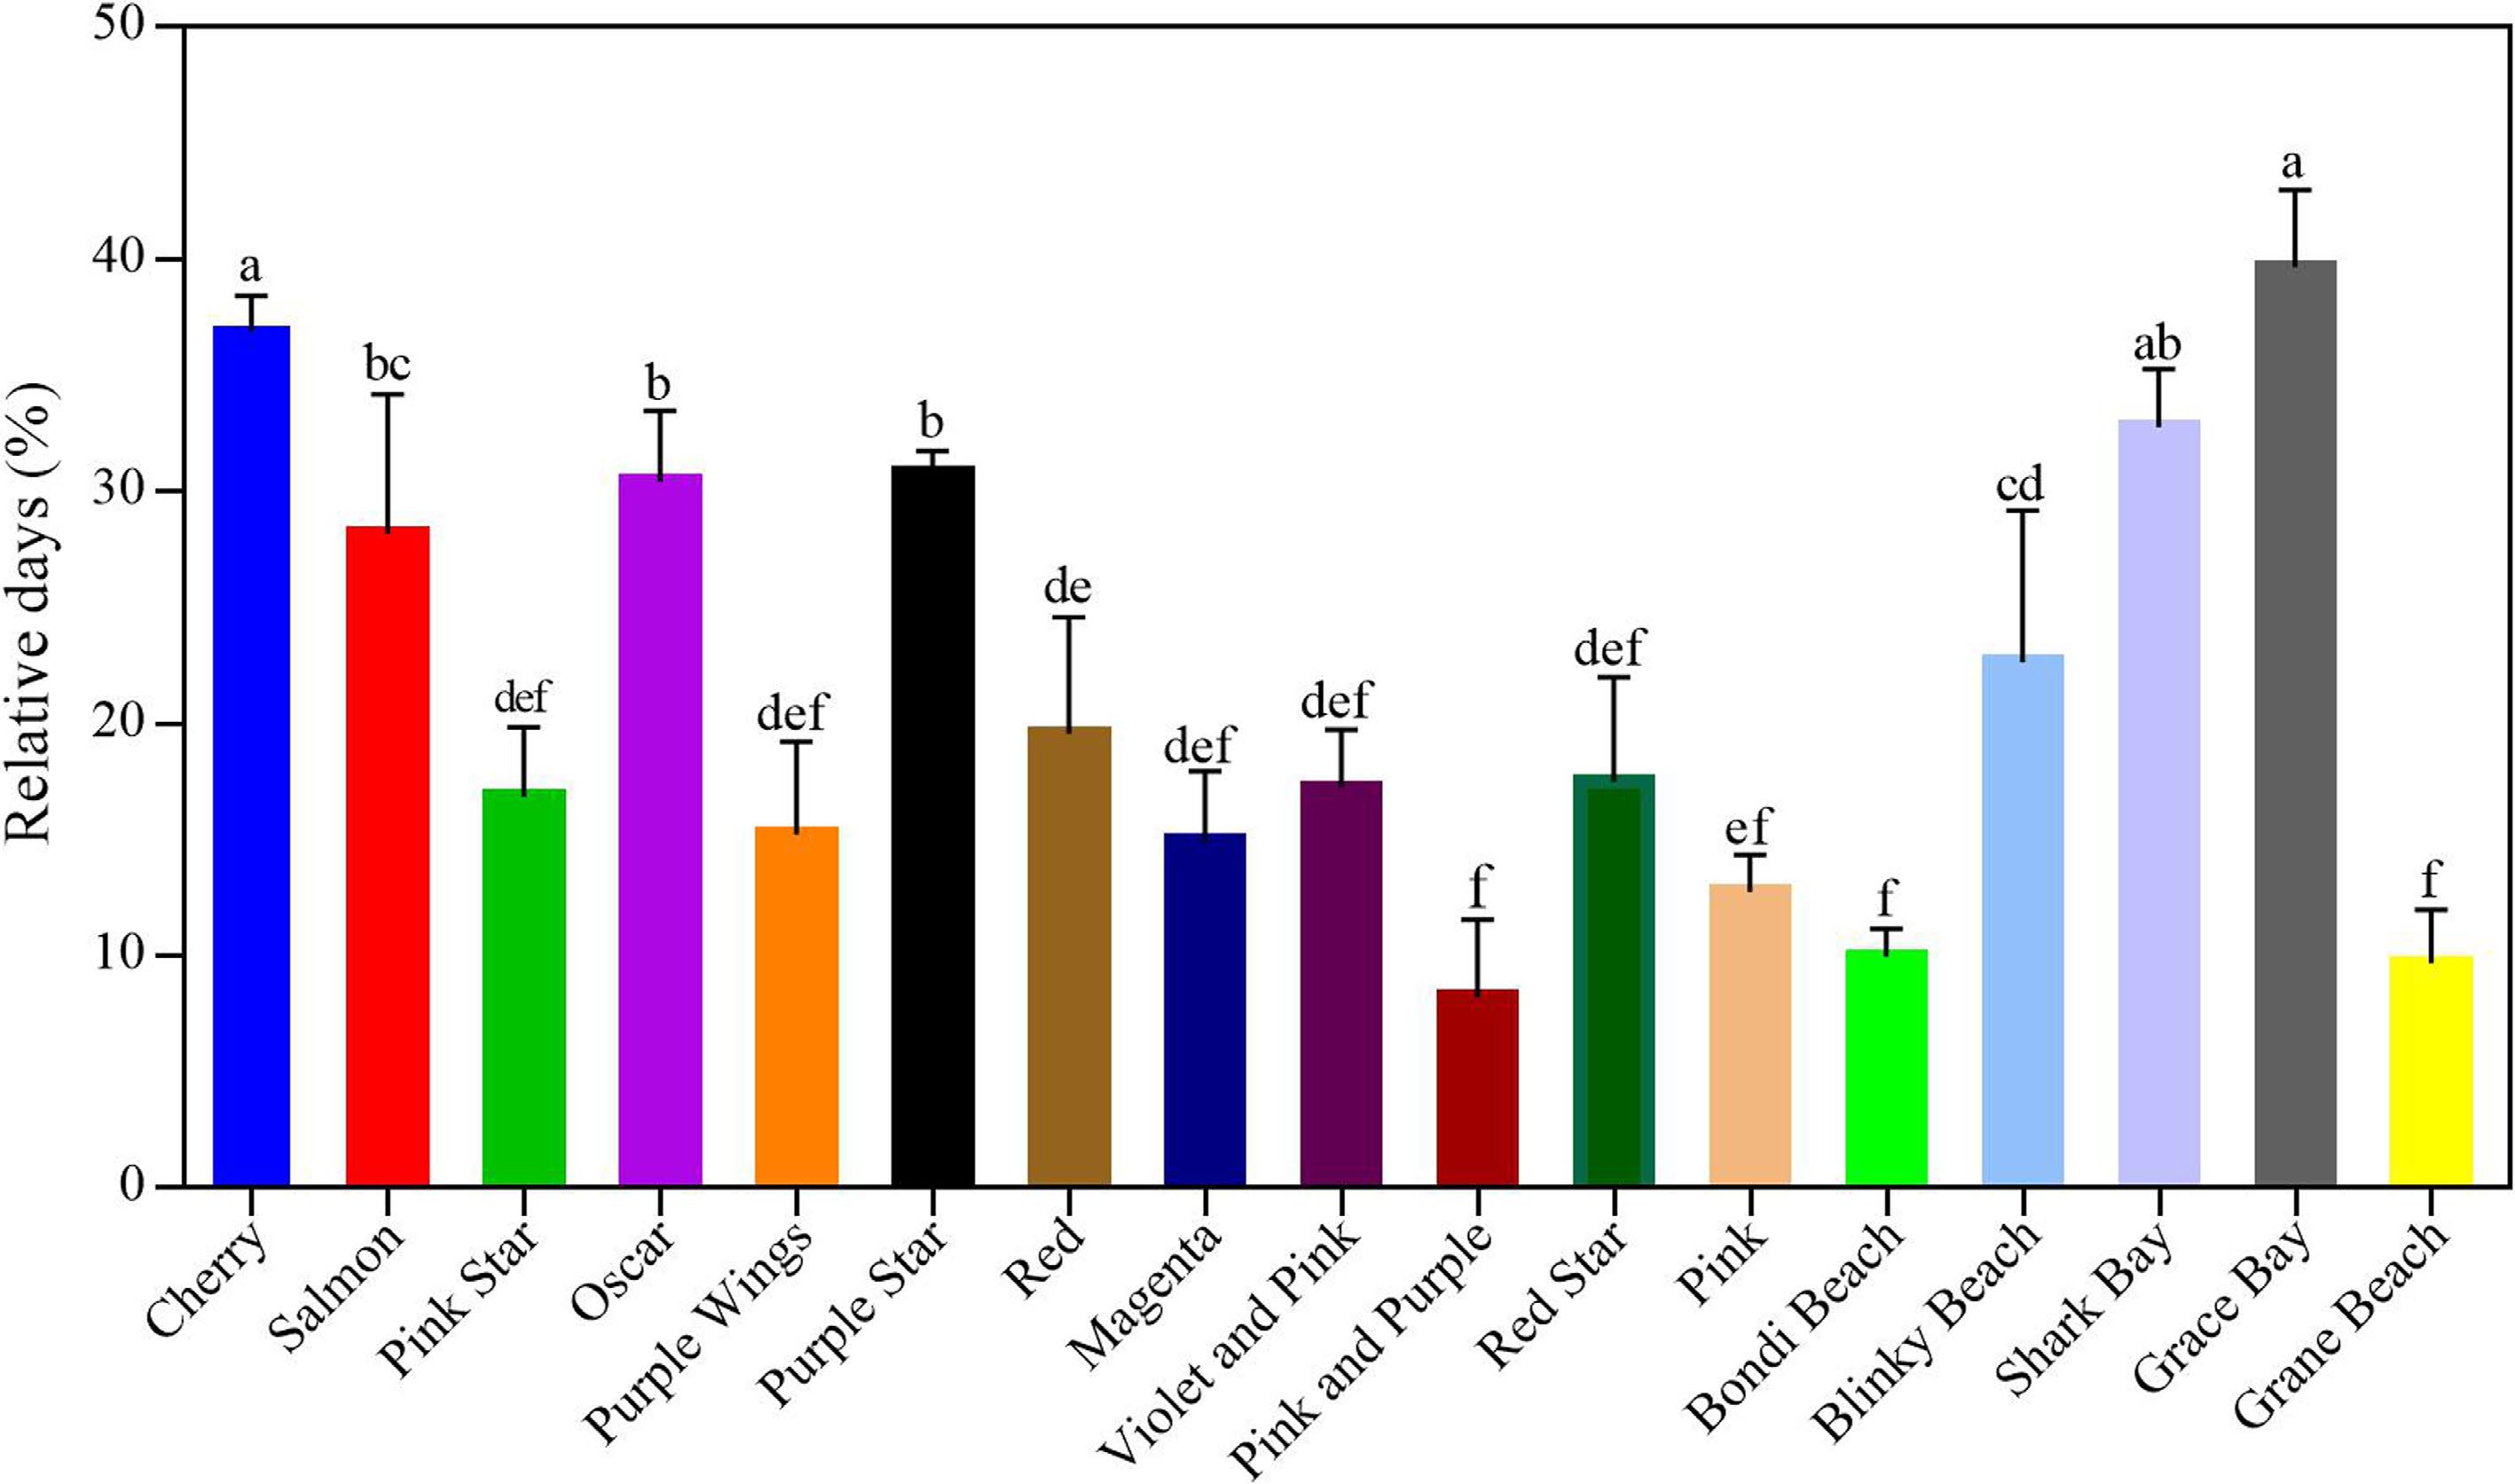
Figure 2.
Relative days of reduced vase life of 17 potted carnation varieties after 4 h of 10 μL·L−1 ethylene treatment. The error bars are represented by the standard deviations of three replicates. Different lowercase letters indicate significant differences between cultivars using one-way ANOVA test in SPSS software at P < 0.05.
-
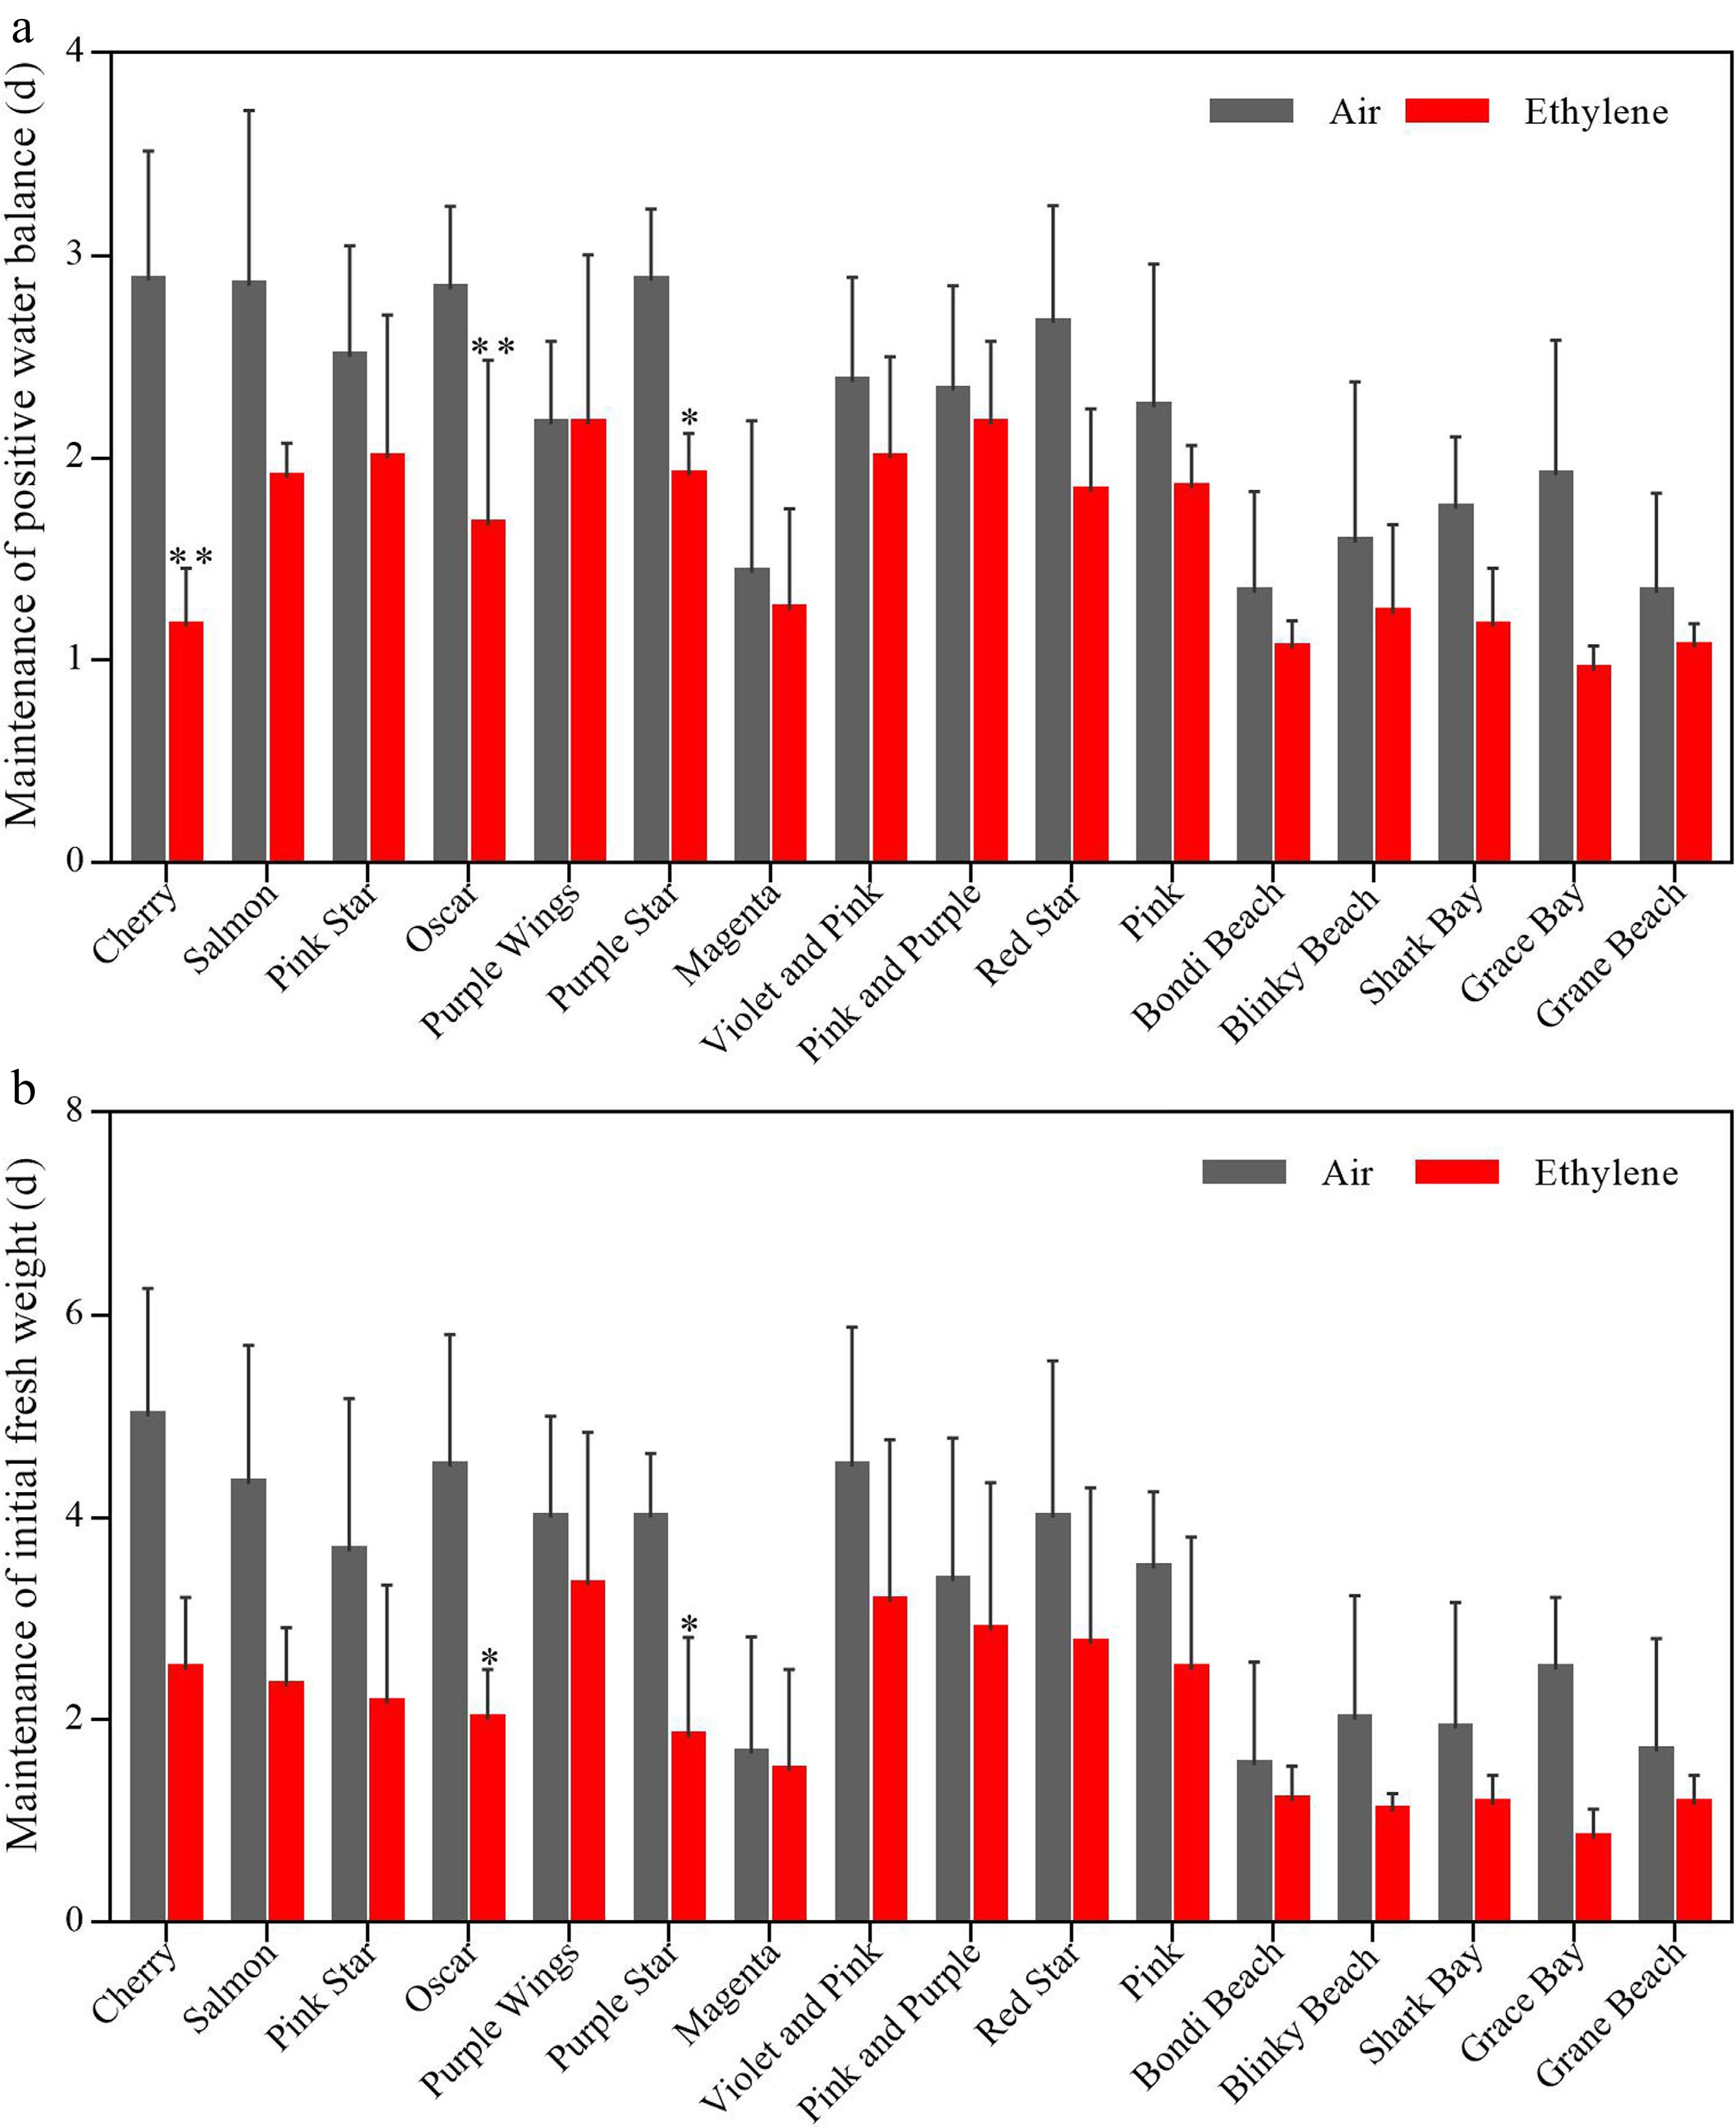
Figure 3.
(a) Number of days in which flowers retained their positive water balance and (b) initial fresh weight for 16 potted carnation cultivars after ethylene treatment. Air: cut flowers were incubated in chambers with normal air at 25 °C, 50% RH, and natural light. Ethylene: cut flowers were incubated in chambers with 10 μL·L−1 ethylene for 4 h at 25 °C, 50% RH, and natural light. The error bars are represented by standard deviations of three replicates (three subsamples per replication). (*, **) represent a significant difference between air and ethylene treatment, as determined by Student’s t-test at P < 0.05 and P < 0.01.
-
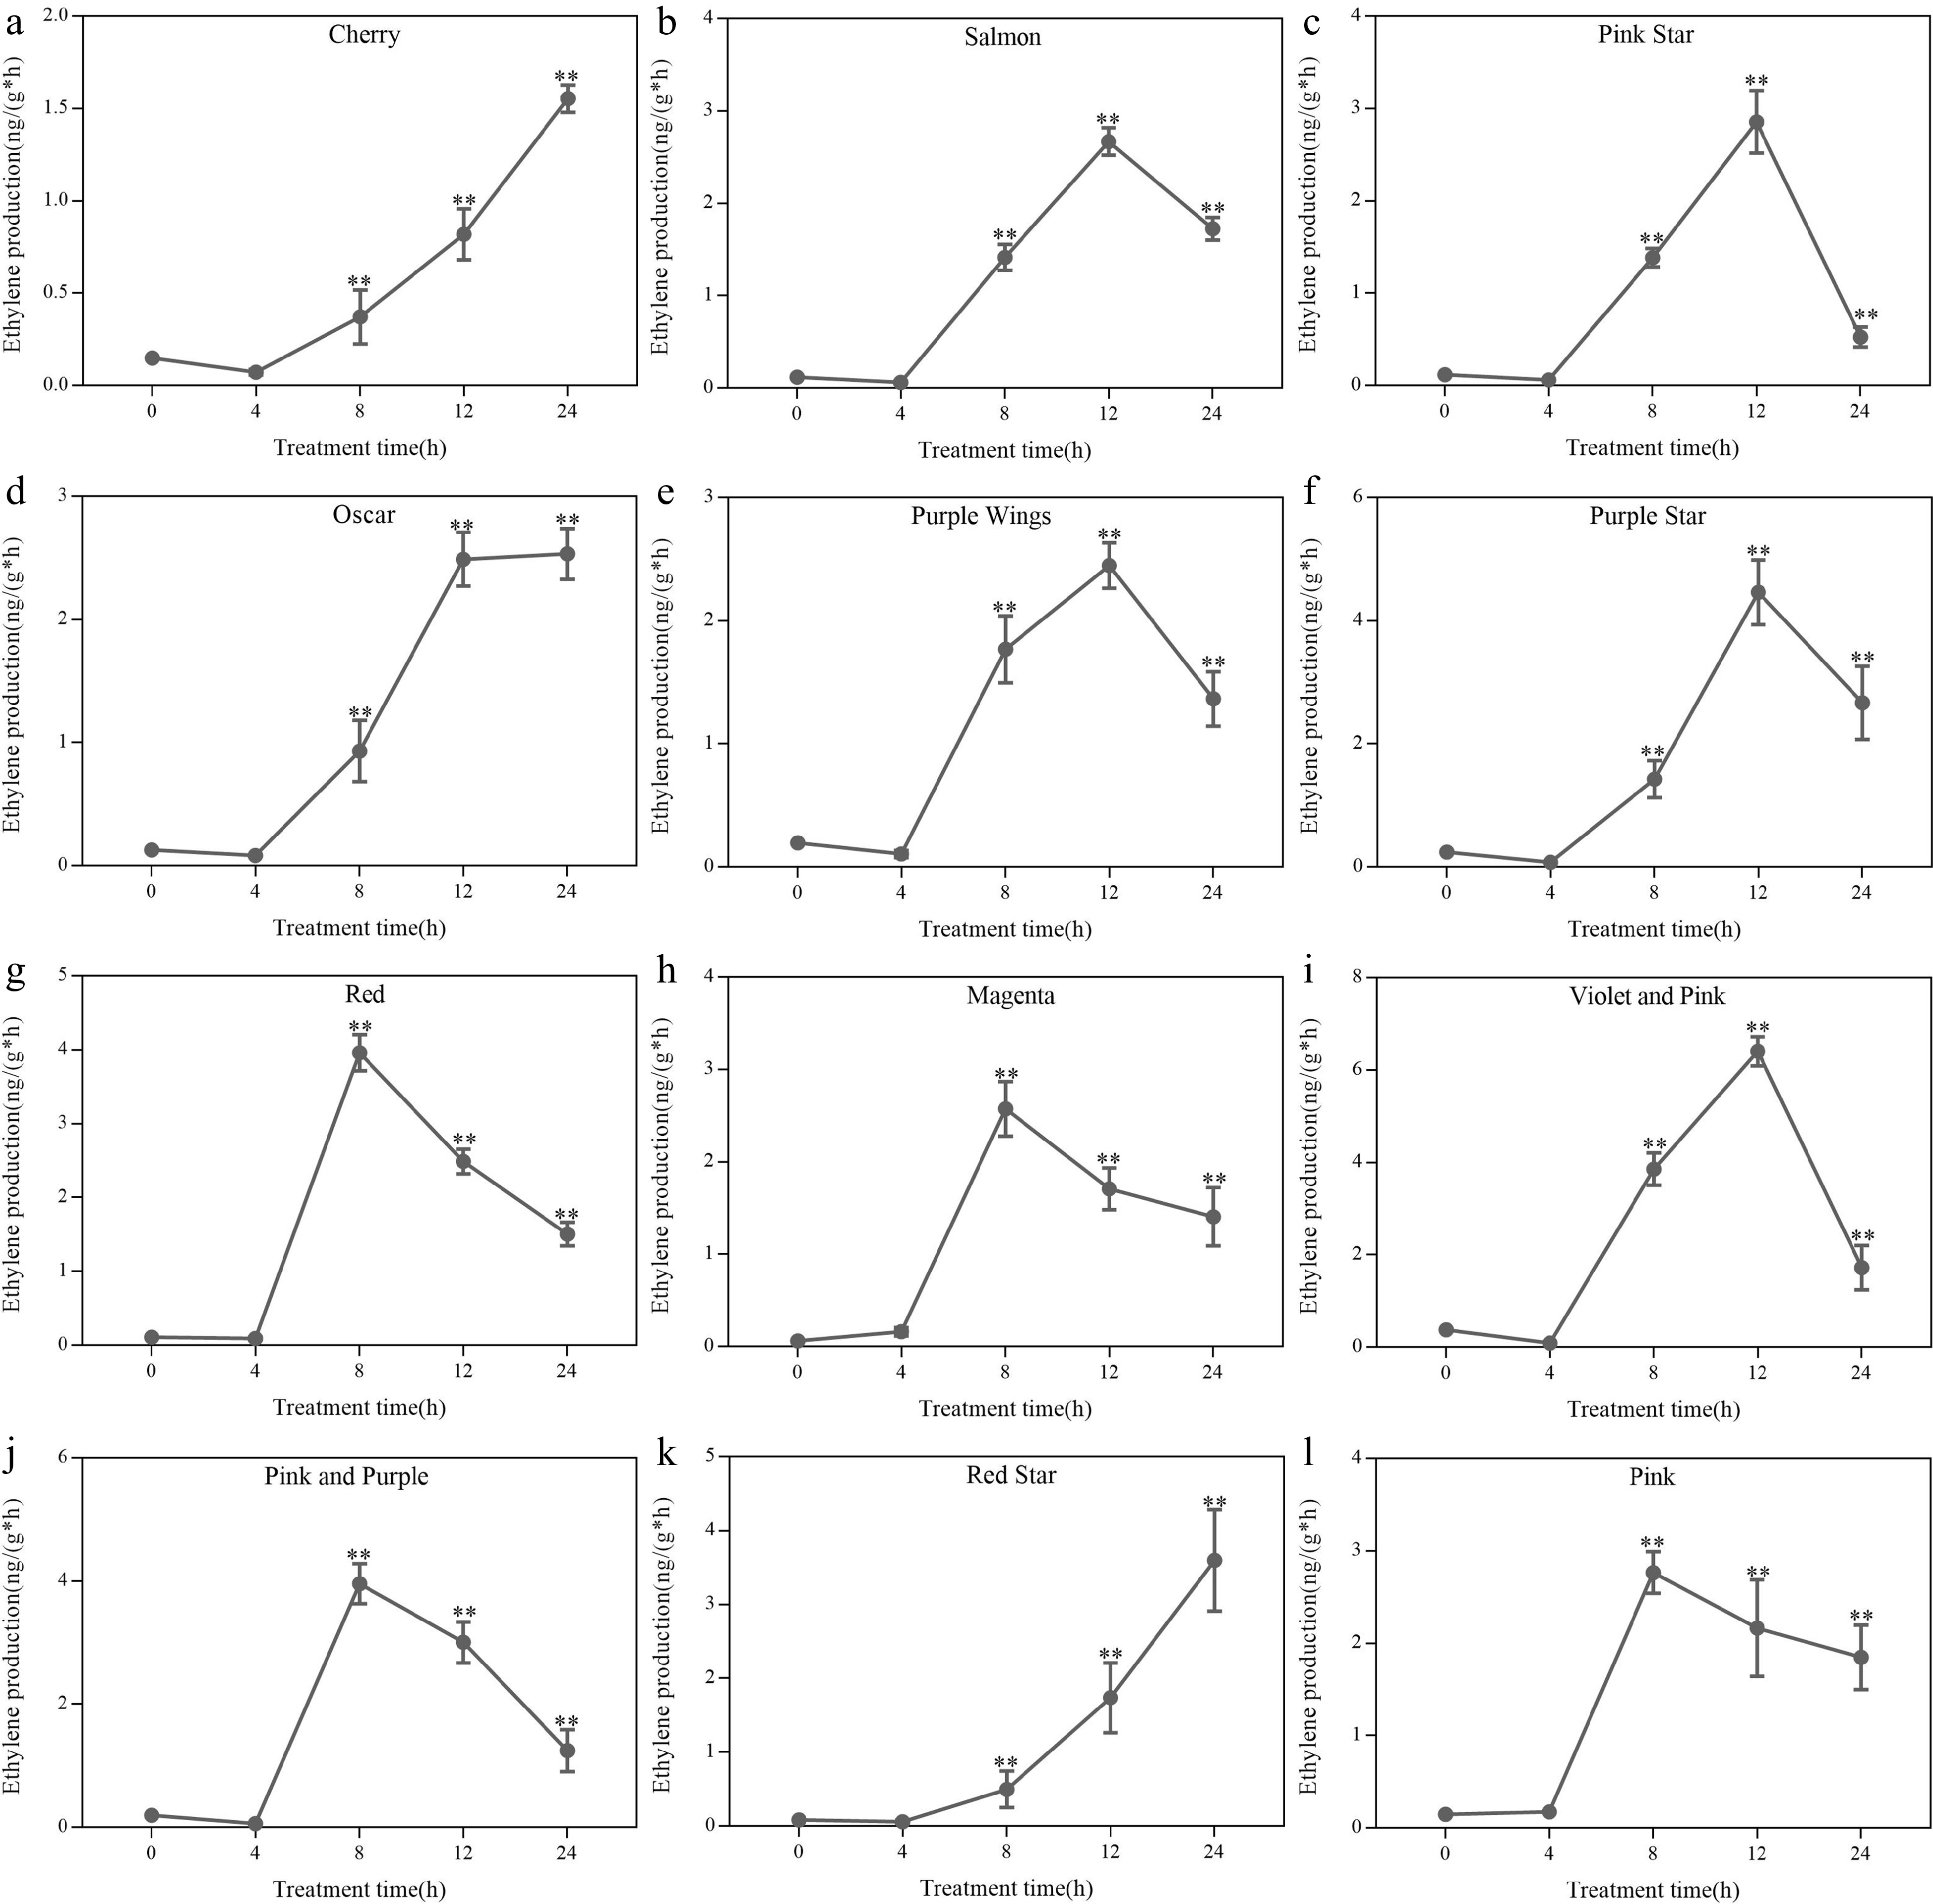
Figure 4.
Effect of ethylene treatment on petal ethylene production in different cultivars of potted carnation. (a) 'Cherry'. (b) 'Salmon'. (c) 'Pink Star'. (d) 'Oscar'. (e) 'Purple Wings'. (f) 'Purple Star'. (g) 'Red. (h) 'Magenta'. (i) 'Violet and Pink'. (j) 'Pink and Purple'. (k) 'Red Star'. (l) 'Pink'. The X-axis indicates cut flowers were incubated in chambers with normal air (0 h) or with 10 μL·L−1 ethylene for 4, 8, 12, and 24 h at 25 °C, 50% RH, and natural light. The Y-axis indicates the endogenous ethylene release from the petals. The error bars are represented by the standard deviations of three replicates. (*, **) represent a significant difference between different treatments, as determined by Student's t-test at P < 0.05 and P < 0.01.
-
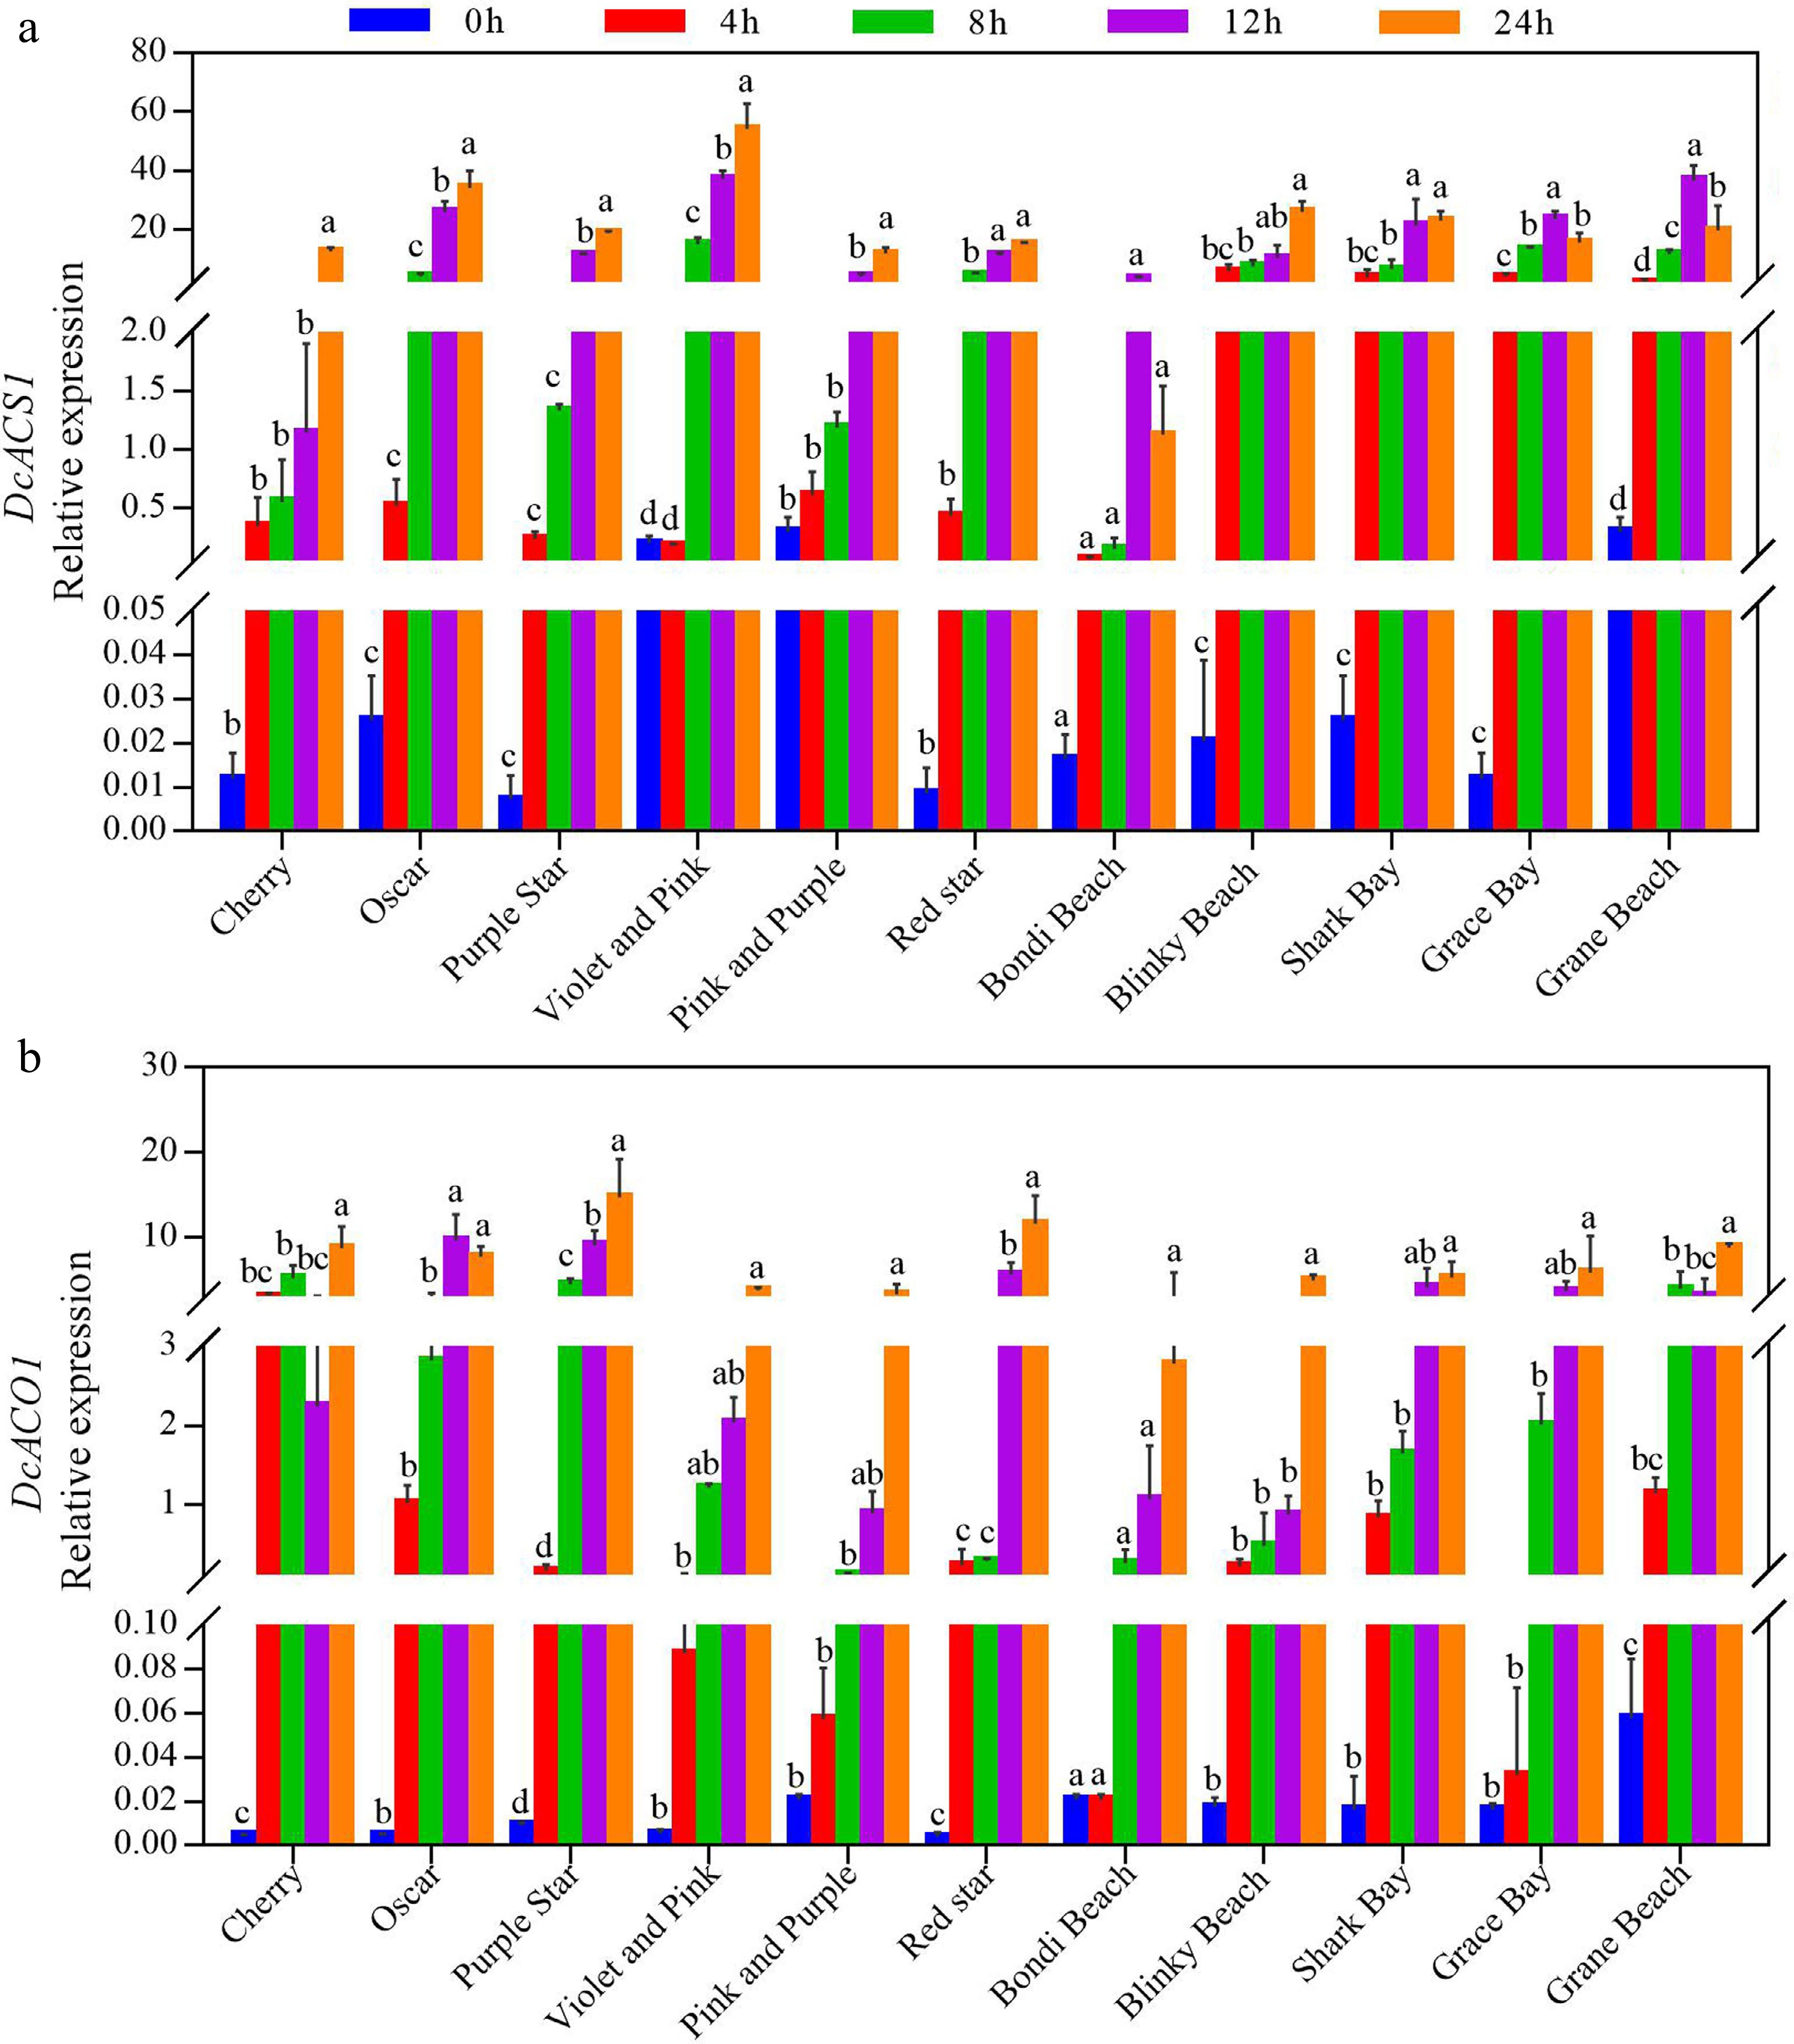
Figure 5.
Effect of ethylene treatment on the relative expression of (a) DcACS1 and (b) DcACO1 in petals of different cultivars of potted carnation. The relative expression level was calculated using the 2−ΔΔCᴛ method. Cut flowers were incubated in chambers with normal air (0 h) or with 10 μL·L−1 ethylene for 4, 8, 12, and 24 h at 25 °C, 50% RH, and natural light. The error bars are represented by the standard deviations of three replicates. Different lowercase letters indicate significant differences between treatments, using the one-way ANOVA test in SPSS software at P < 0.05.
-
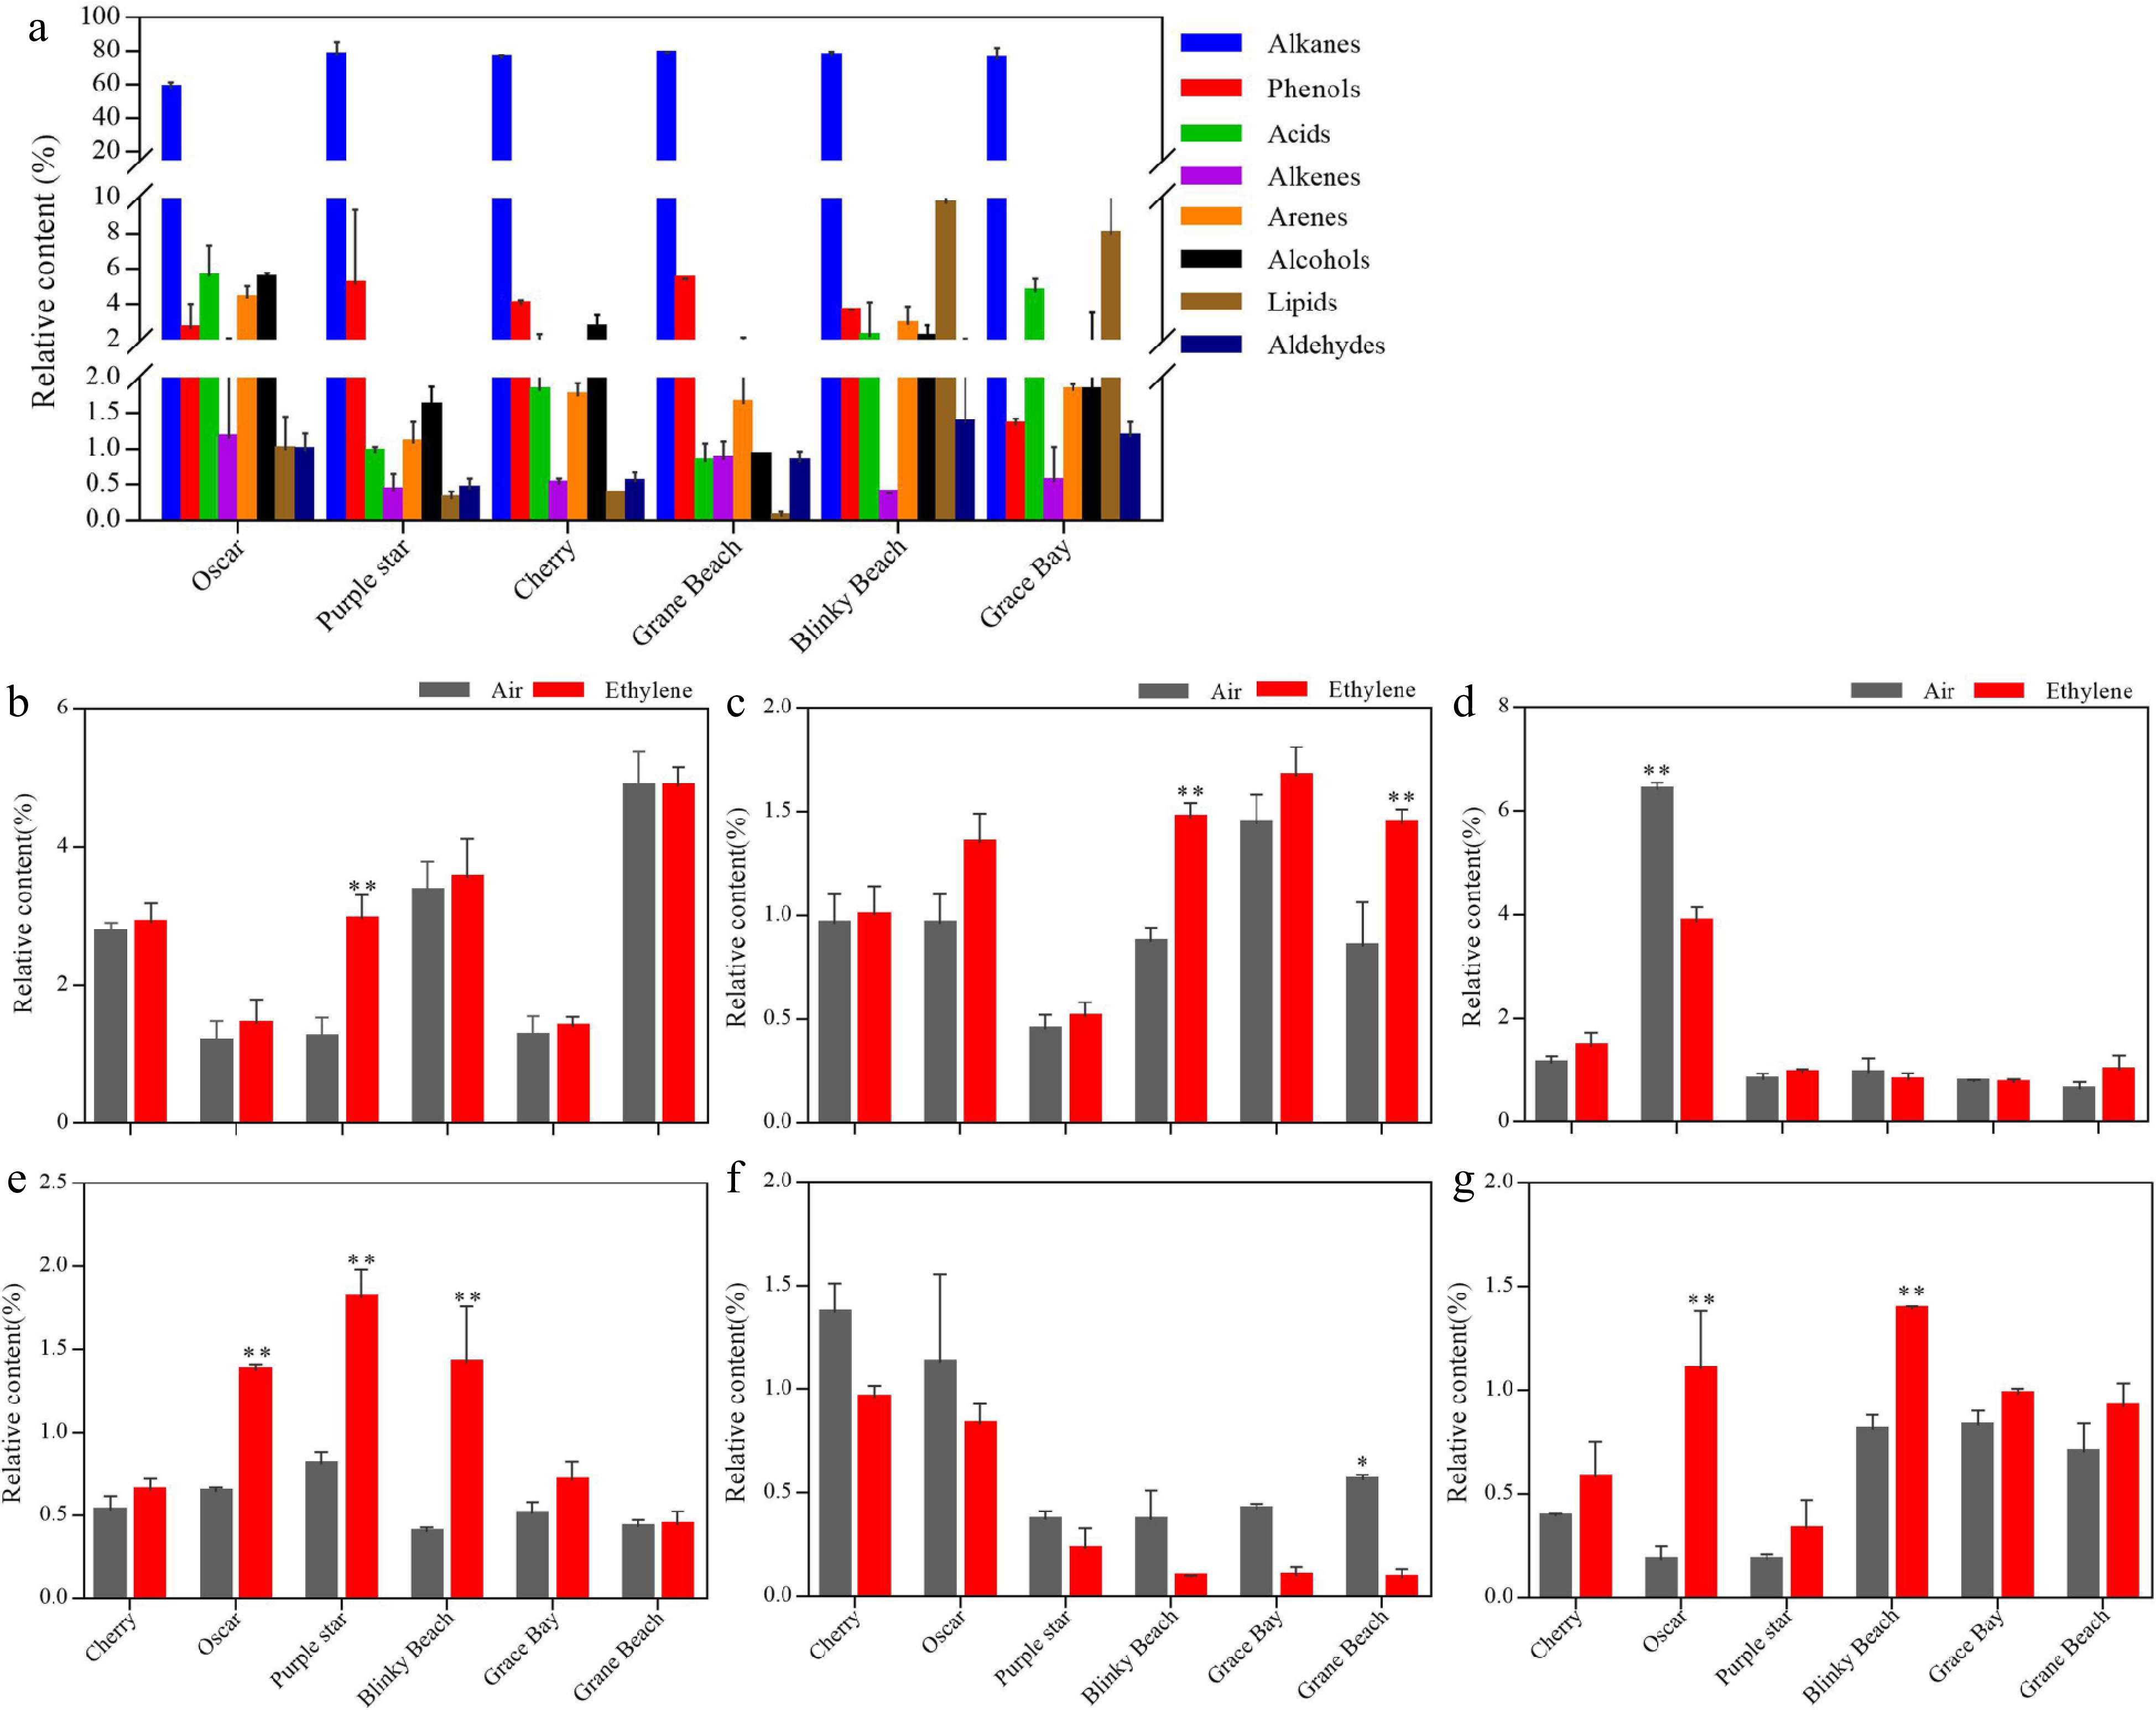
Figure 6.
Differences in the content of volatile substances of different species and changes in major volatile substances after ethylene treatment. (a) Relative content of volatile component in petals of different cultivars of potted carnation. Flowers were incubated in chambers with normal air at 20 °C. Effect of ethylene treatment on relative content of volatile compounds in petals of different cultivars of potted carnation. Air: cut flowers were incubated in chambers with normal air at 25 °C, 50% RH, and natural light. Ethylene: cut flowers were incubated in chambers with 10 μL·L−1 ethylene for 4 h at 25 °C, 50% RH, and natural light. (b) 2,4-Di-tert-butylphenol. (c) 2,4-Dimethylbenzyl chloride. (d) Benzoic acid, 2-amino-4-methyl. (e) Phenol, 2-methoxy-3-(2-propenyl). (f) Behenic alcohol. (h) Benzaldehyde, 2,5-dimethyl. Flowers were incubated in chambers with normal air (Air) or with 10 μL·L−1 ethylene (Ethylene) for 4 h at 20 °C. The error bars are represented by the standard deviations of three replicates. (*, **) represent a significant difference between air and ethylene treatment, as determined by Student’s t-test at P < 0.05 and P < 0.01.
-
Gene Primer DcACS1 Forward (5‘-3’) CAGTGTGACGCCATTGAAAC Reverse (5‘-3’) TTAAGTTCAATGTTTTGTTGAGAAGA DcACO1 Forward (5‘-3’) TGCAATGCTTCTCATCAACC Reverse (5‘-3’) CAATCCATAGGACATGGAACA DcUbq3-7 Forward (5‘-3’) GTTGTTGGTTTCAGGGCTGGTTTG Reverse (5‘-3’) CTACGGTAATTGAGAATTCACACCGAAATG Table 1.
Primers used for quantitative real-time PCR.
-
Cultivar Vase life (d) In planta flower longevity (d)3 Air1 Ethylene2 'Cherry' 14.20 ± 2.44 a 9.20 ± 3.55** ab 21.92 ± 3.47 ab 'Salmon' 13.92 ± 2.66 a 10.00 ± 2.44** a 19.70 ± 3.30 abc 'Pink Star' 12.83 ± 3.04 ab 10.67 ± 2.74* a 19.09 ± 3.85 abc 'Oscar' 12.78 ± 2.95 ab 8.89 ± 2.97** ab 21.60 ± 3.80 ab 'Purple Wings' 12.55 ± 2.91 ab 10.64 ± 3.04* a 23.78 ± 3.70 a 'Purple Star' 12.13 ± 2.10 abc 8.40 ± 3.06** ab 20.77 ± 4.04 ab 'Red' 11.60 ± 2.41 abc 9.33 ± 1.52* ab 22.00 ± 3.36 ab 'Magenta' 11.17 ± 2.59 abc 9.50 ± 1.08 ab 15.20 ± 3.39 cde 'Violet and Pink' 10.79 ± 3.06 bc 8.93 ± 2.95** ab 17.58 ± 3.53 bcd 'Pink and Purple' 10.31 ± 1.38 bcd 9.46 ± 3.59 ab 18.73 ± 4.23 abc 'Red Star' 10.00 ± 1.14 bcd 8.25 ± 1.58 ab 18.17 ± 3.76 bcd 'Pink' 9.17 ± 3.61 cde 8.00 ± 2.04 ab 14.15 ± 3.82 def 'Bondi Beach' 8.33 ± 1.21 def 7.50 ± 1.76 bc 11.71 ± 2.36 ef 'Blinky Beach' 7.33 ± 0.57 ef 5.67 ± 0.57 cd 12.00 ± 0.84 ef 'Shark Bay' 7.11 ± 0.93 ef 4.78 ± 0.97 d 11.25 ± 3.45 ef 'Grace Bay' 6.86 ± 0.69 f 4.14 ± 0.38 d 10.18 ± 3.02 f 'Grane Beach' 6.20 ± 0.84 f 5.60 ± 0.55 cd 10.30 ± 2.40 f (1) Air: vase life of cut flowers was incubated in chambers with normal air at 25 °C, 50% RH, and natural light. (2) Ethylene: vase life of cut flowers was incubated in chambers with 10 μL·L-1 ethylene for 4 h at 25 °C, 50% RH, and natural light. (3) In planta flower longevity: Number of days from full bloom (outermost petals at a 90° angle to the flower stem) to complete wilting and crumpling of complete potted carnations (not cut flowers) grown in a greenhouse at 20 °C, 50% RH, and natural light. Data represent the mean ± SE of three replications (three subsamples per replication). Different lowercase letters indicate significant differences between cultivars using the one-way ANOVA test in SPSS software at P < 0.05. (*, **) represent a significant difference between air and ethylene treatment, as determined by Student's t-test at P < 0.05 and P < 0.01. Table 2.
Variation in vase life and flower longevity of 17 potted carnation cultivars.
Figures
(6)
Tables
(2)