-
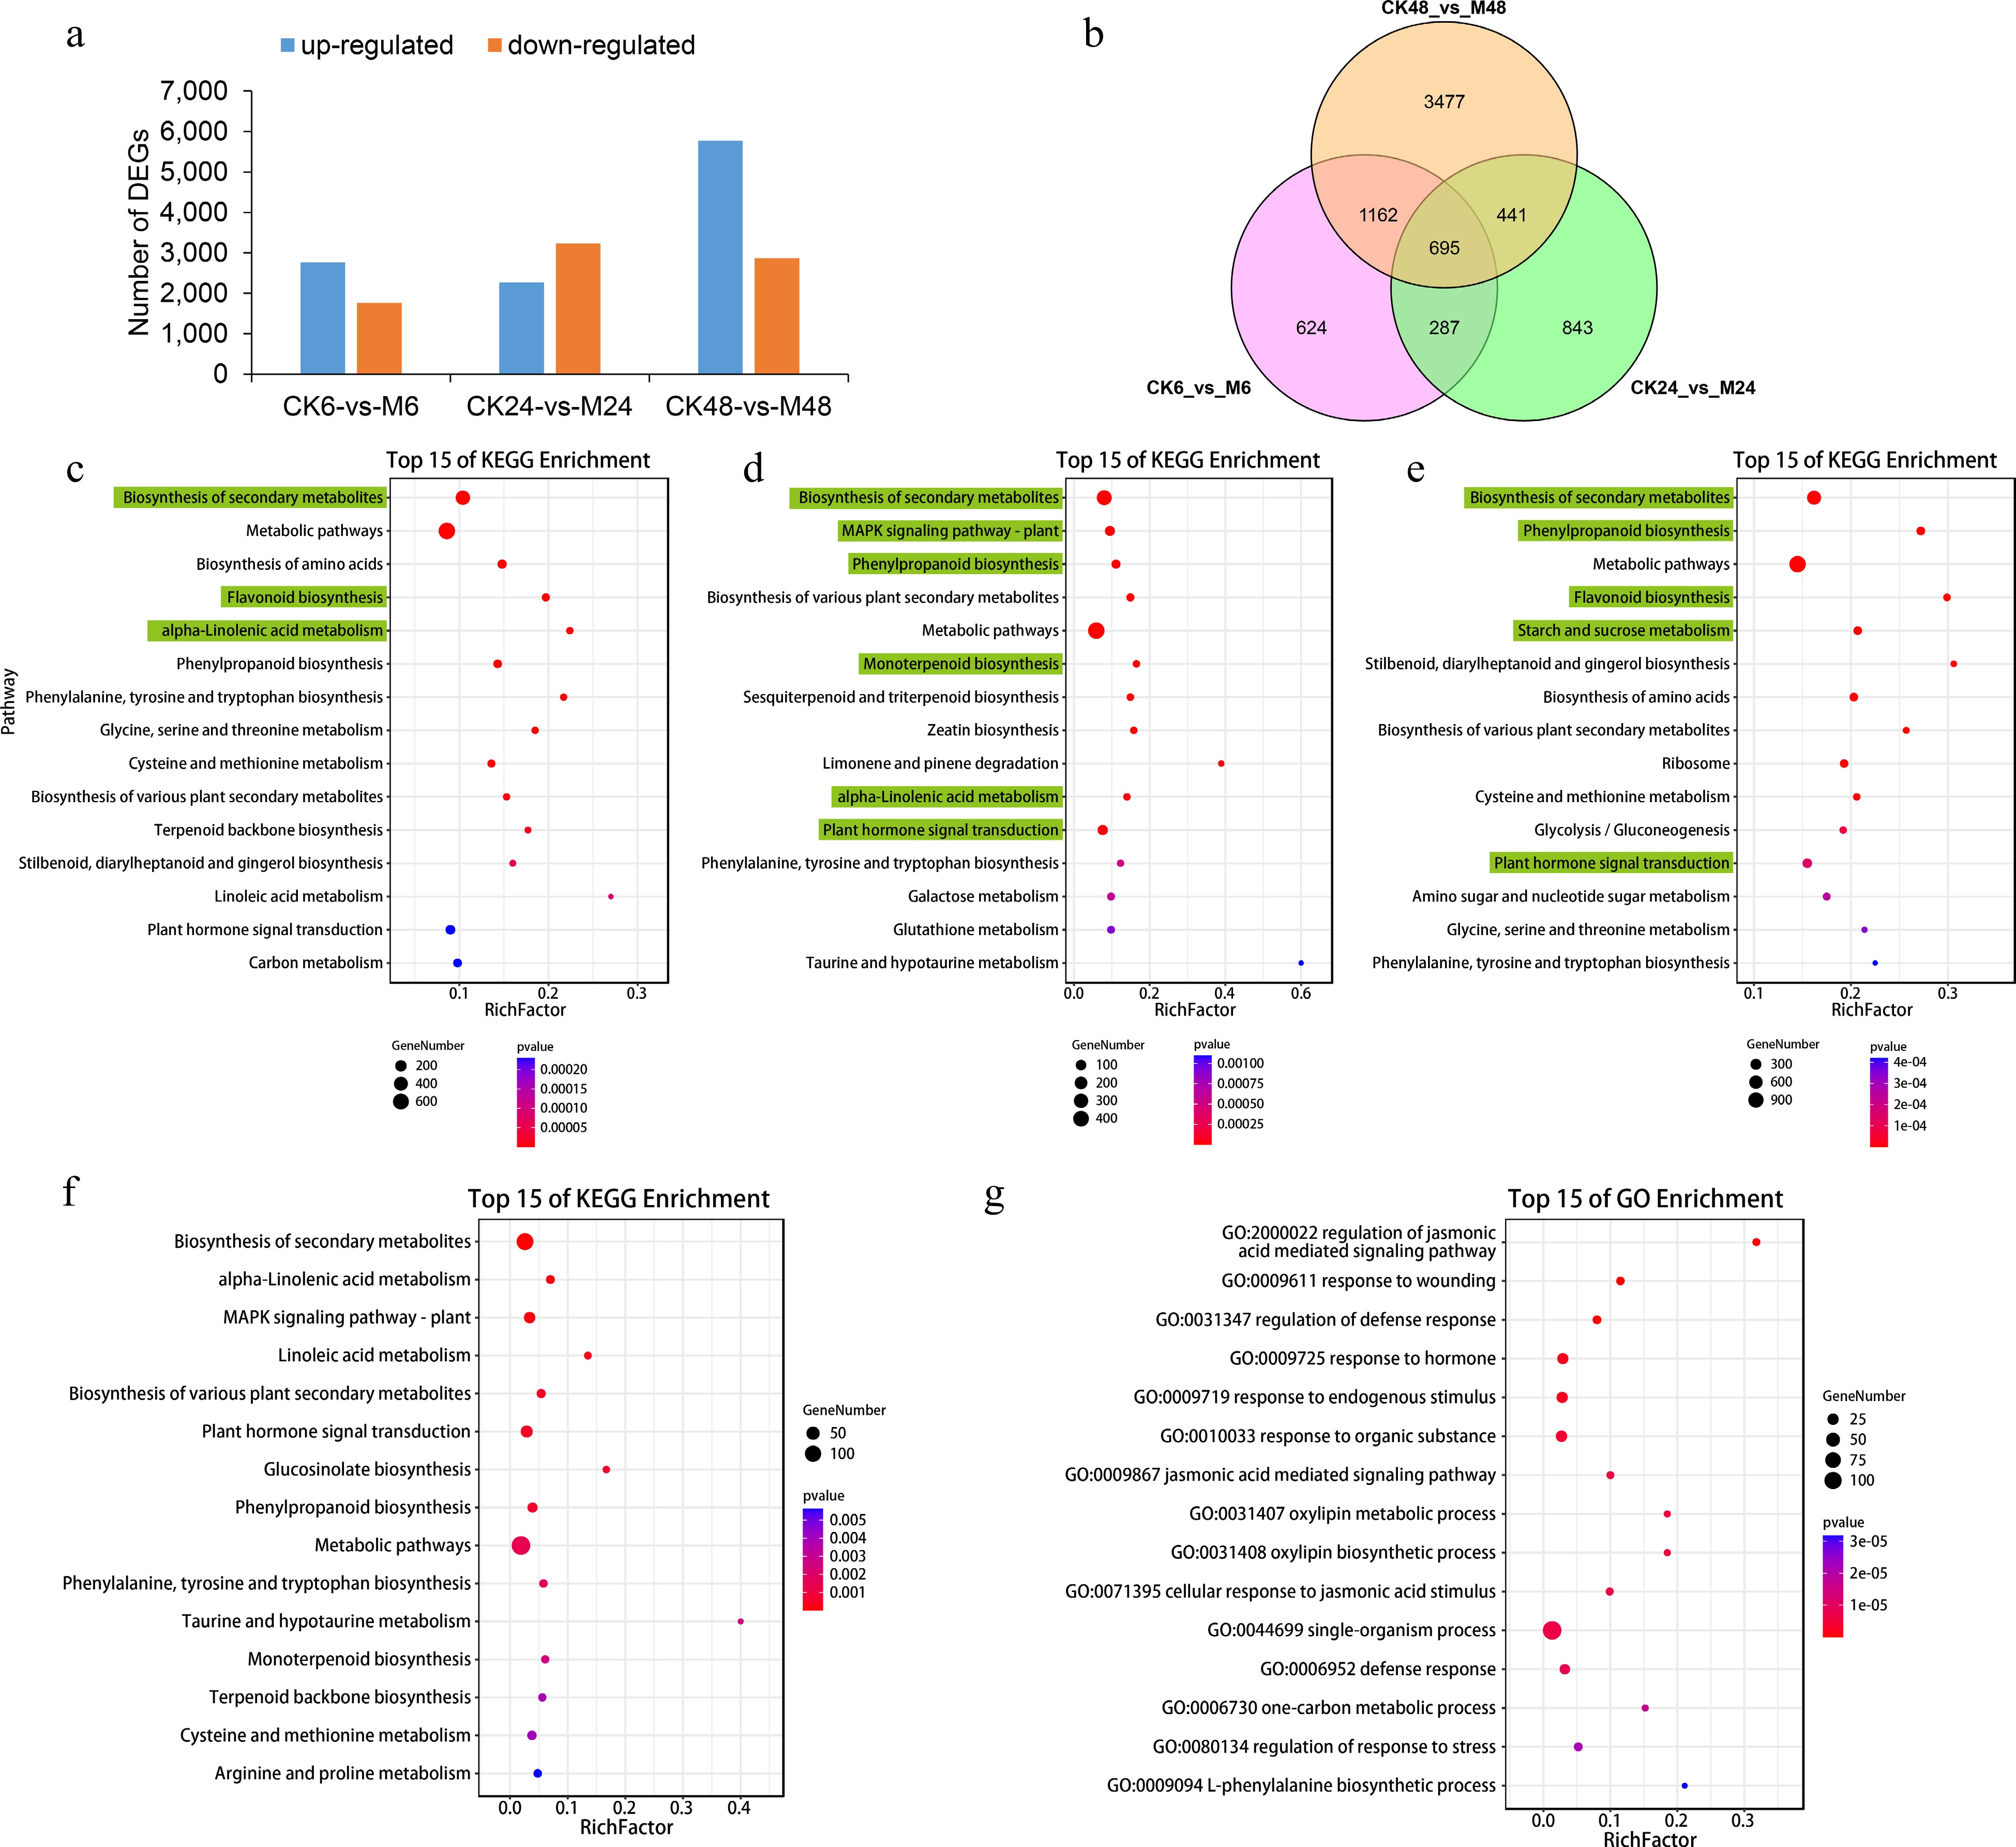
Figure 1.
Differentially expressed genes at different time points after E. onukii Matsuda feeding. (a) Differentially expressed gene numbers between different comparison groups (CK6-vs-M6, CK24-vs-M24 and CK48-vs-M48). (b) Venn diagram of the number of up-regulated genes in the three comparison groups. Top 15 KEGG enrichment pathways of up-regulated genes in comparison group CK6-vs-M6 (c), CK24-vs-M24 (d) and CK48-vs-M48 (e). Top 15 (f) KEGG and (g) GO enrichment pathways of co-upregulated genes in the three comparison groups.
-
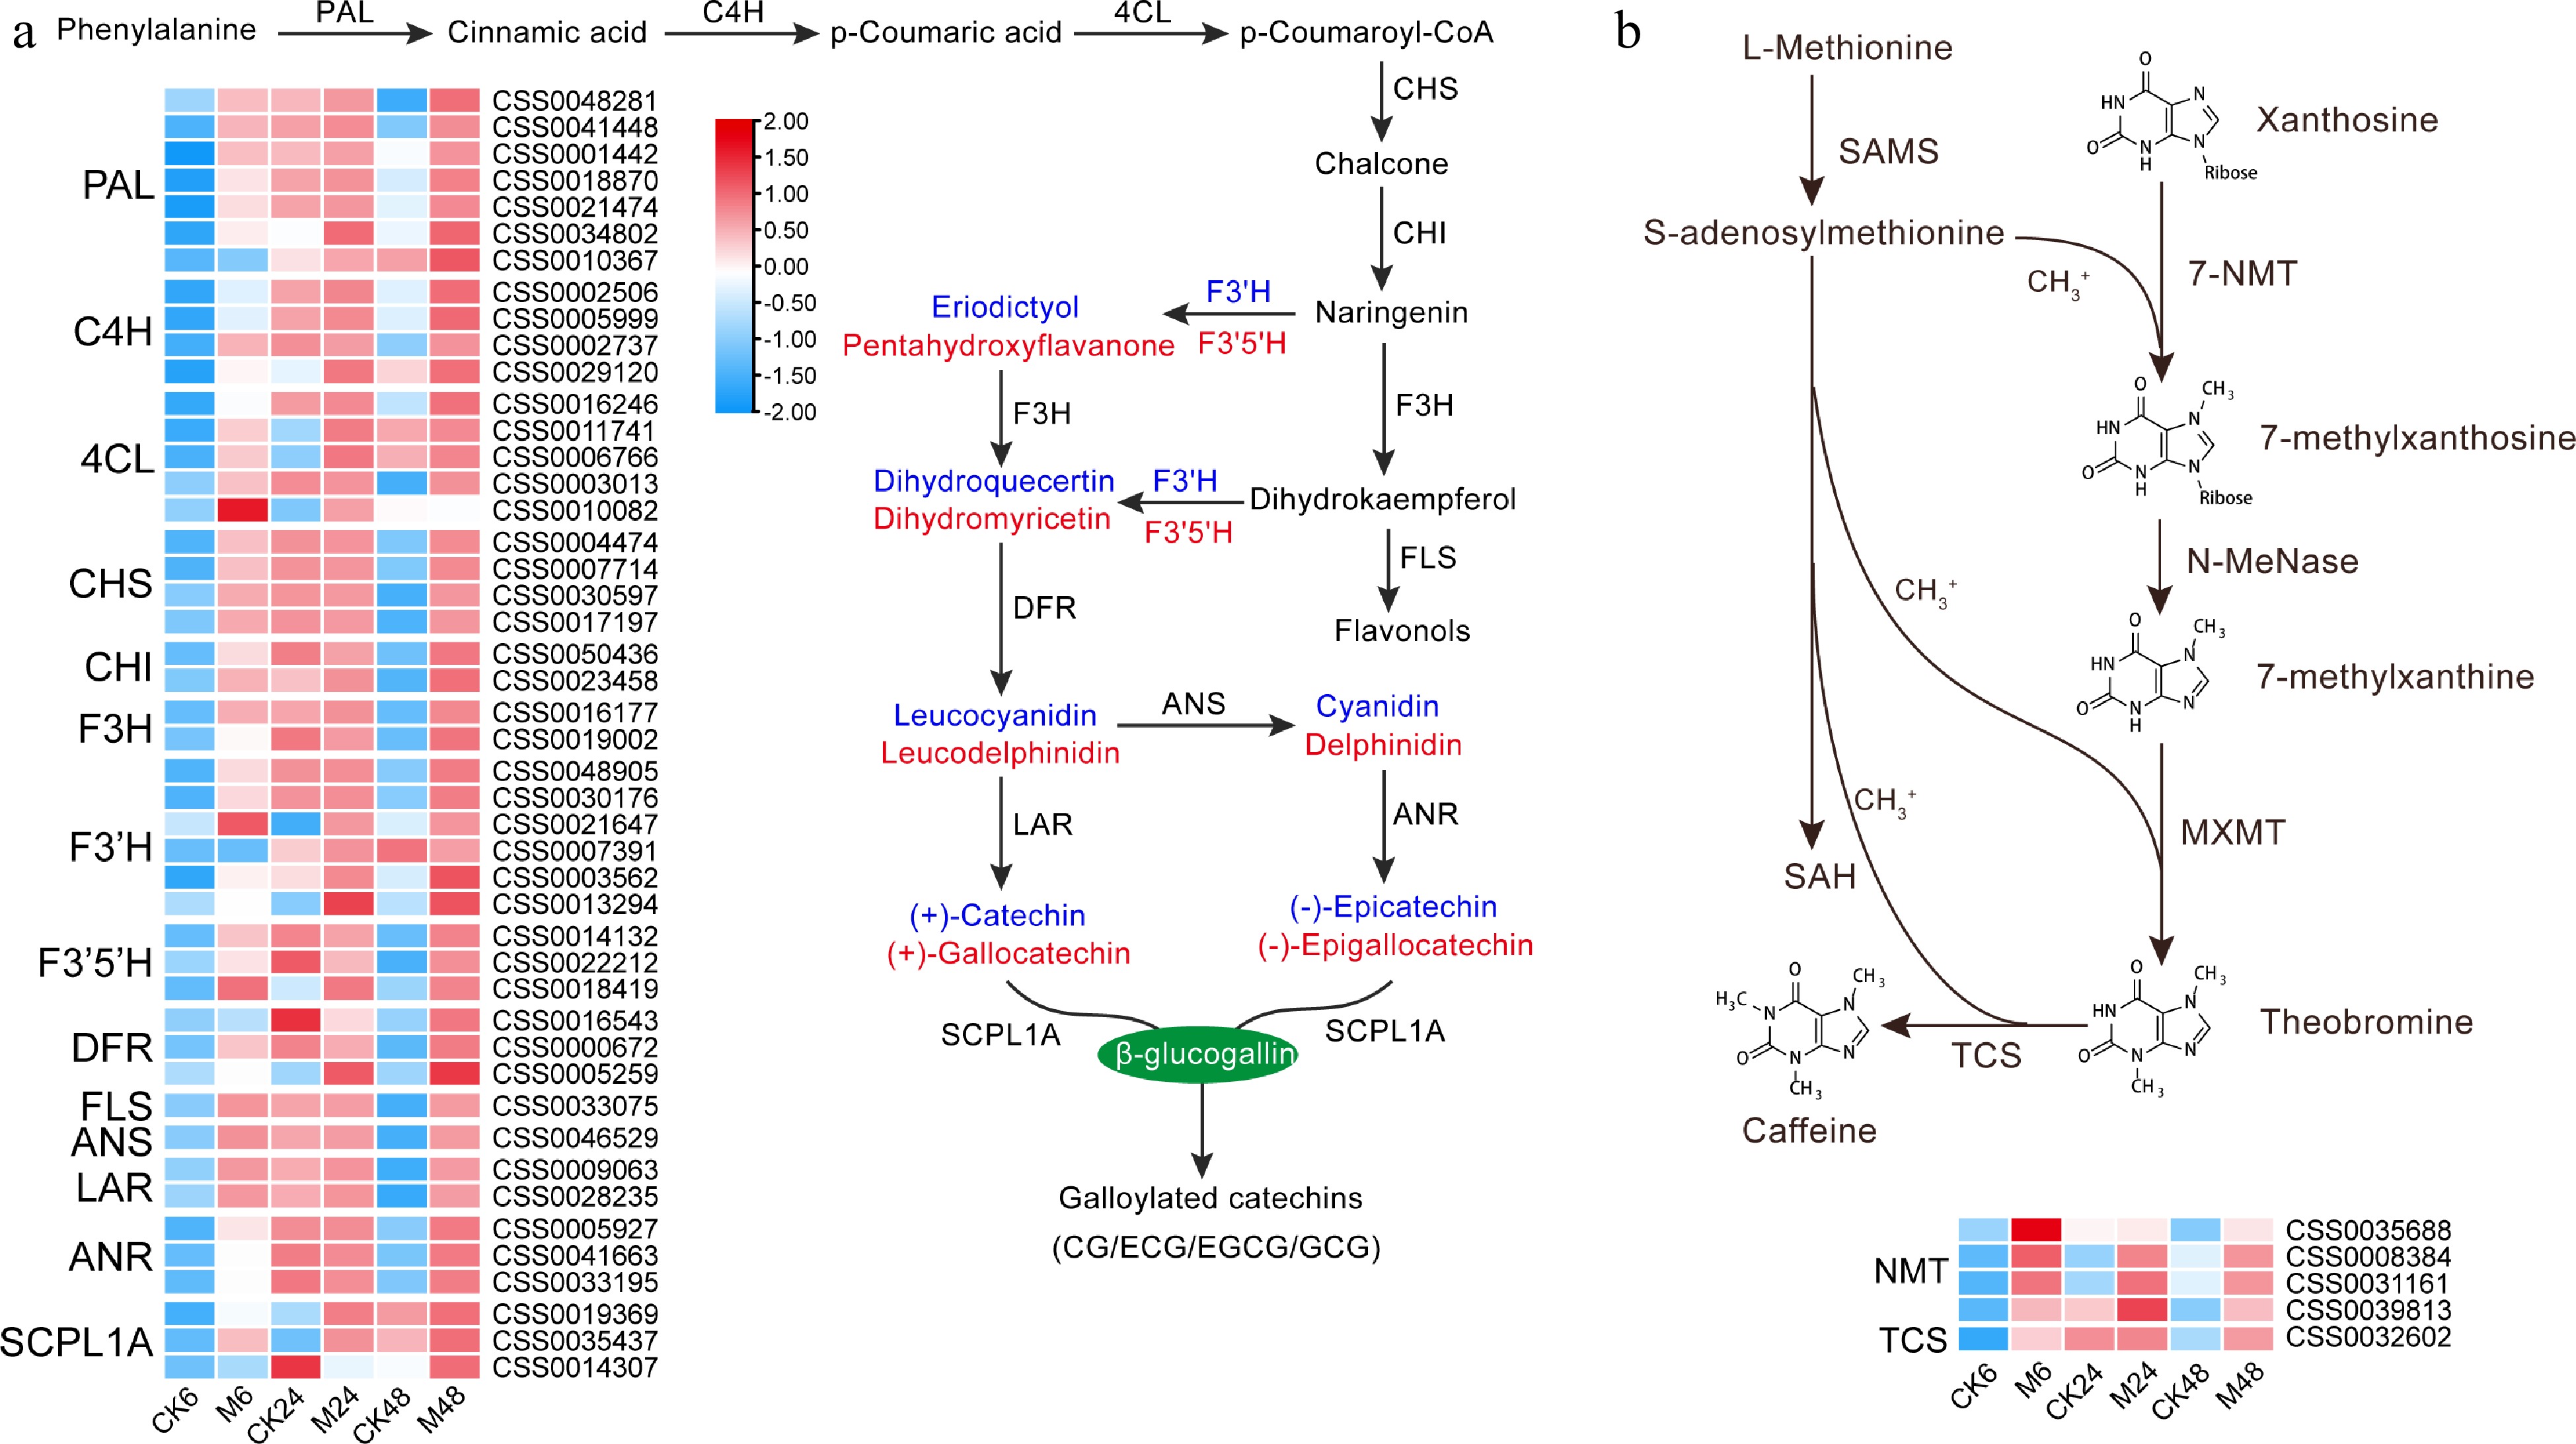
Figure 2.
Expression characteristics of key genes in (a) catechins and (b) caffeine synthesis pathways at different time points after E. onukii Matsuda feeding. Expression level is based on the log2 value of FPKM. Red and blue indicate higher or lower expression levels of genes, respectively. The heatmaps are drawn using TBtools software, and the original data of the drawing is shown in Supplemental Table S3. PAL, phenylalanine ammonialyase; C4H, cinnamate 4-hydroxylase; 4CL, p-coumaroyl-CoA ligase; CHS, chalcone synthase; CHI, chalcone isomerase; F3H, flavanone 3-hydroxylase; F3'H, flavonoid 3'-hydroxylase; F3'5'H, flavonoid 3',5'-hydroxylase; DFR, dihydroflavonol 4-reductase; FLS, flavonol synthase; ANS, anthocyanidin synthase; LAR, leucoanthocyanidin reductase; ANR, anthocyanidin reductase; SCPL1A, type 1A serine carboxypeptidase-like acyltransferases. NMT, N-methyltransferase; 7-NMT, xanthosine methyltransferase; MXMT, 7-methylxanthine methyltransferase/theobromine synthase; TCS, tea caffeine synthase/3,7-dimethylxanthine methyltransferase; SAMS, S-adenosylmethionine synthetase; SAH, S-adenosylhomocysteine.
-
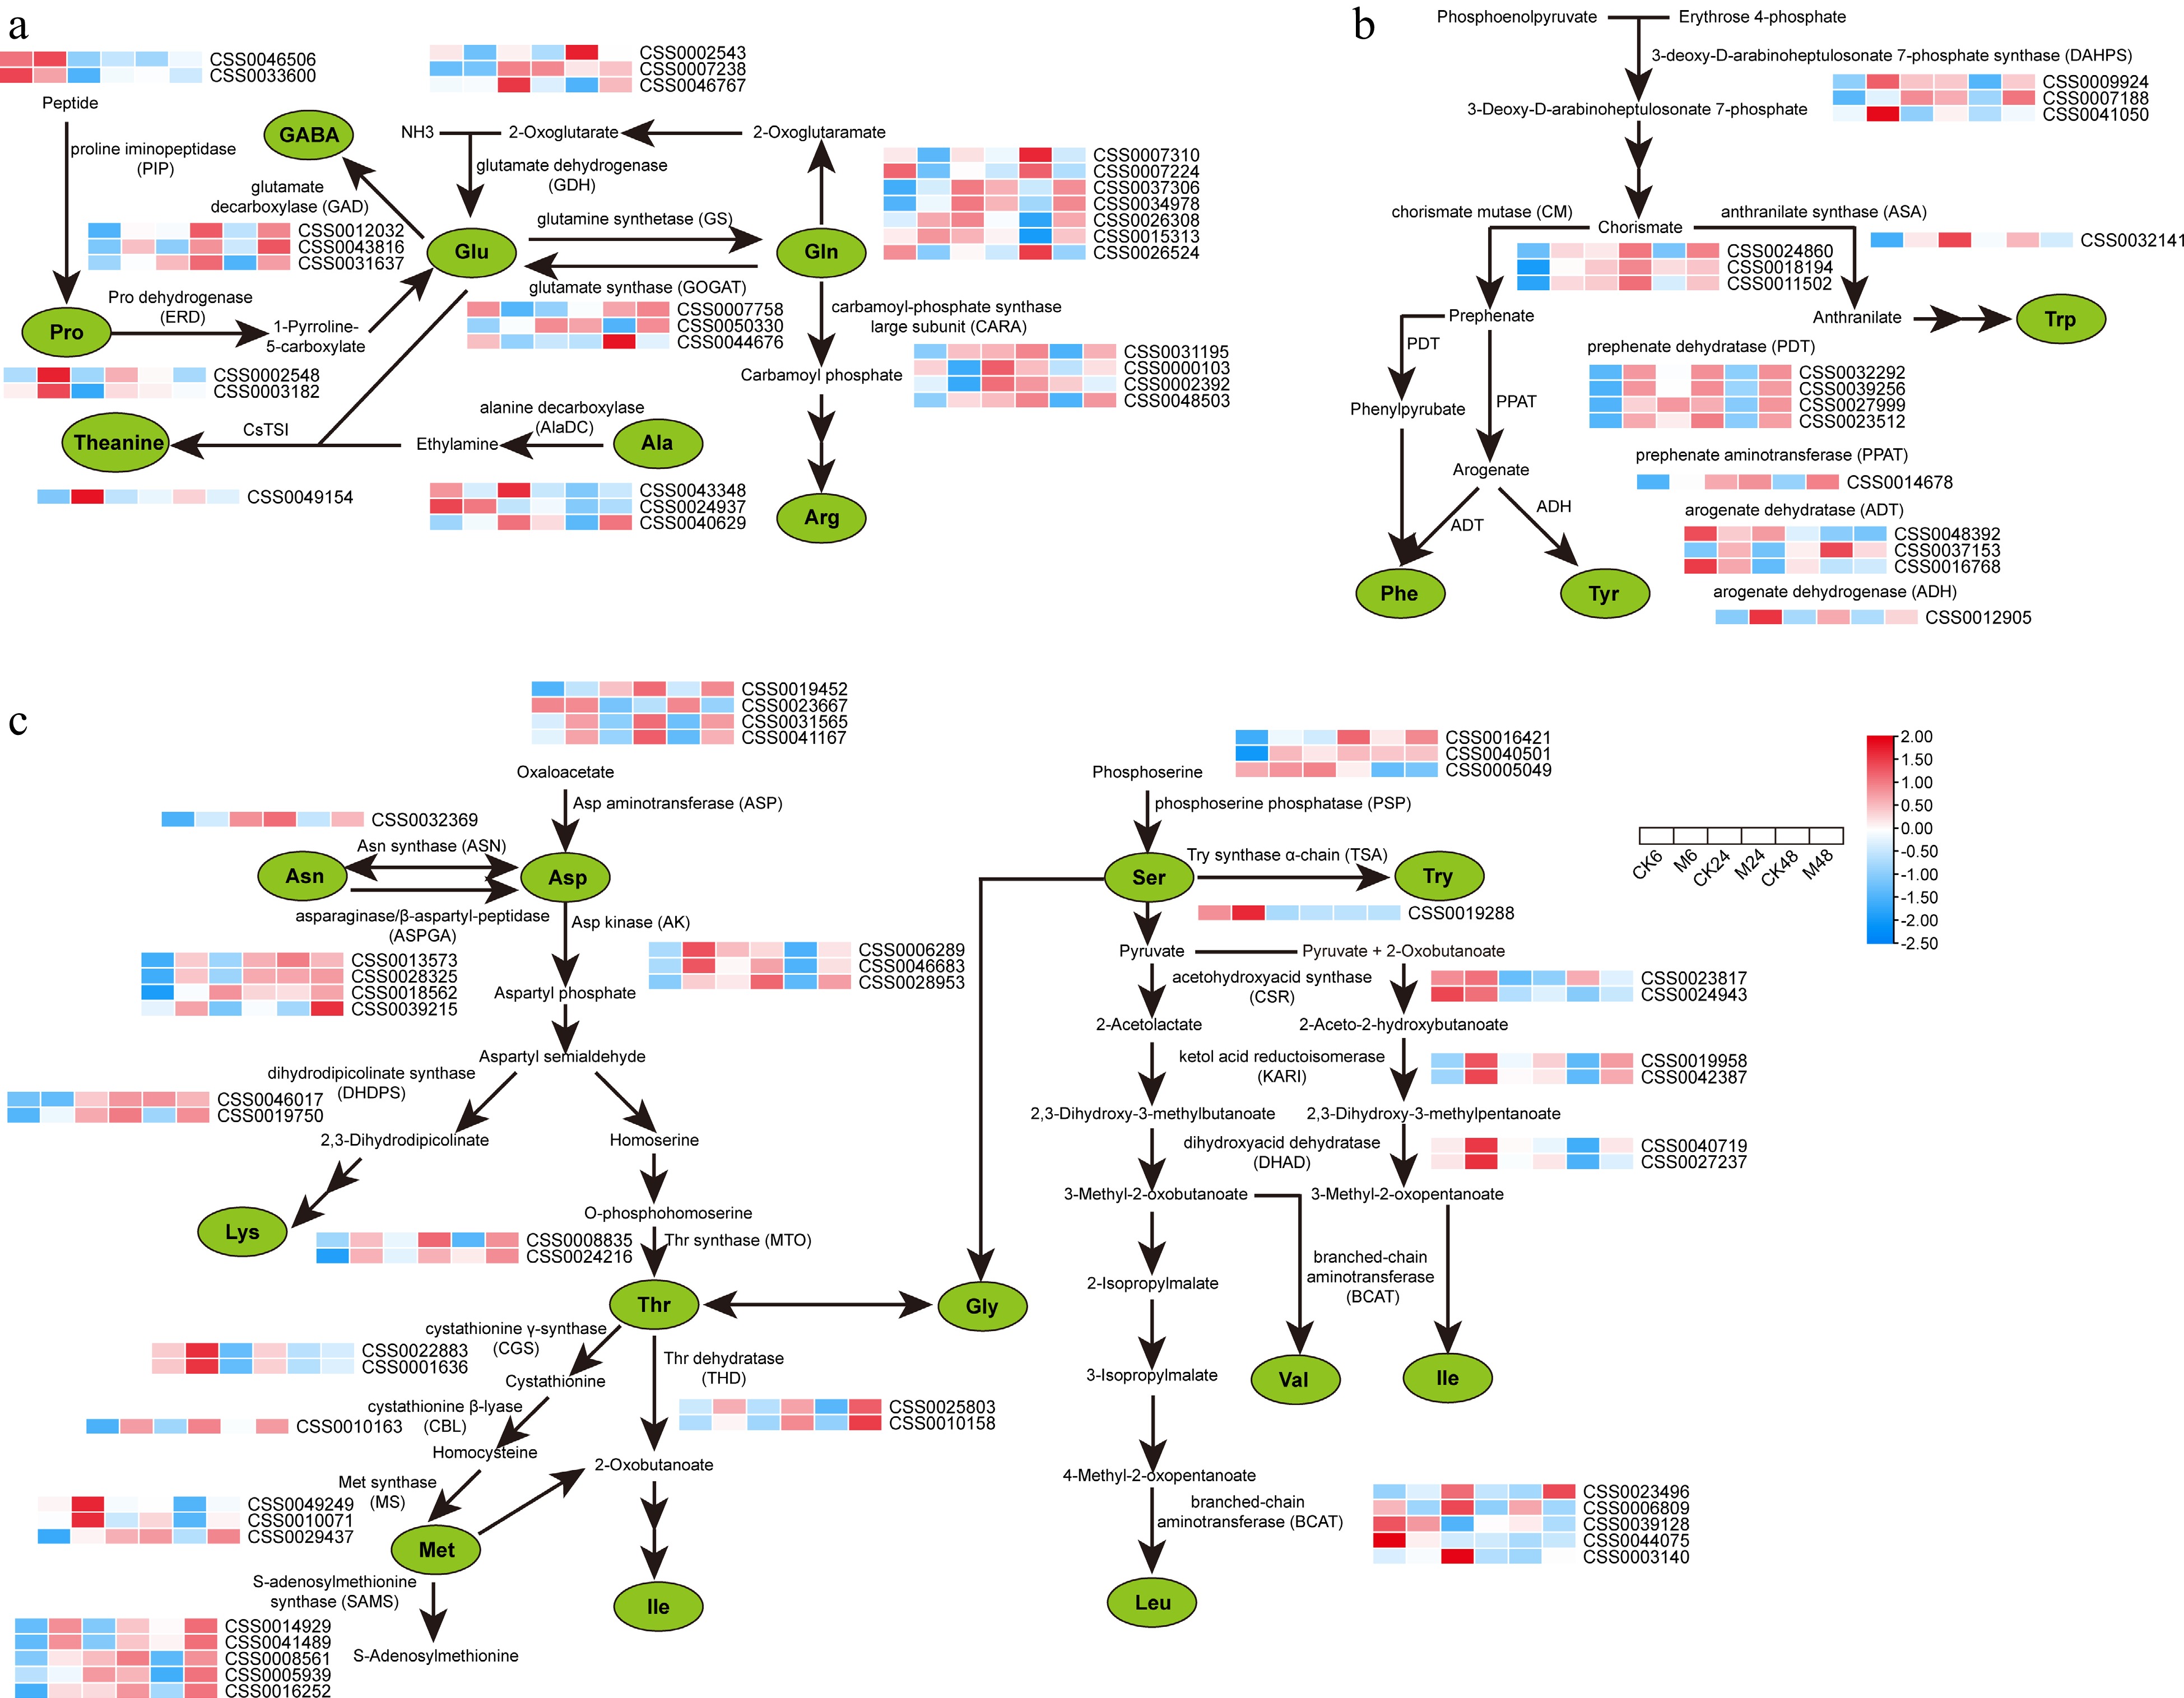
Figure 3.
Expression characteristics of key genes in amino acid metabolic pathways at different time points after E. onukii Matsuda feeding. (a) Expression patterns of key genes for theanine, proline, GABA, glutamic acid and arginine synthesis. (b) Expression patterns of genes related to the synthesis of aromatic amino acids. (c) Expression patterns of proteinaceous amino acid synthesis-related genes. Expression level is based on the log2 value of FPKM. Red and blue indicate higher or lower expression levels of genes, respectively. The heatmaps are drawn using TBtools software, and the original data of the drawing is shown in Supplemental Table S3.
-
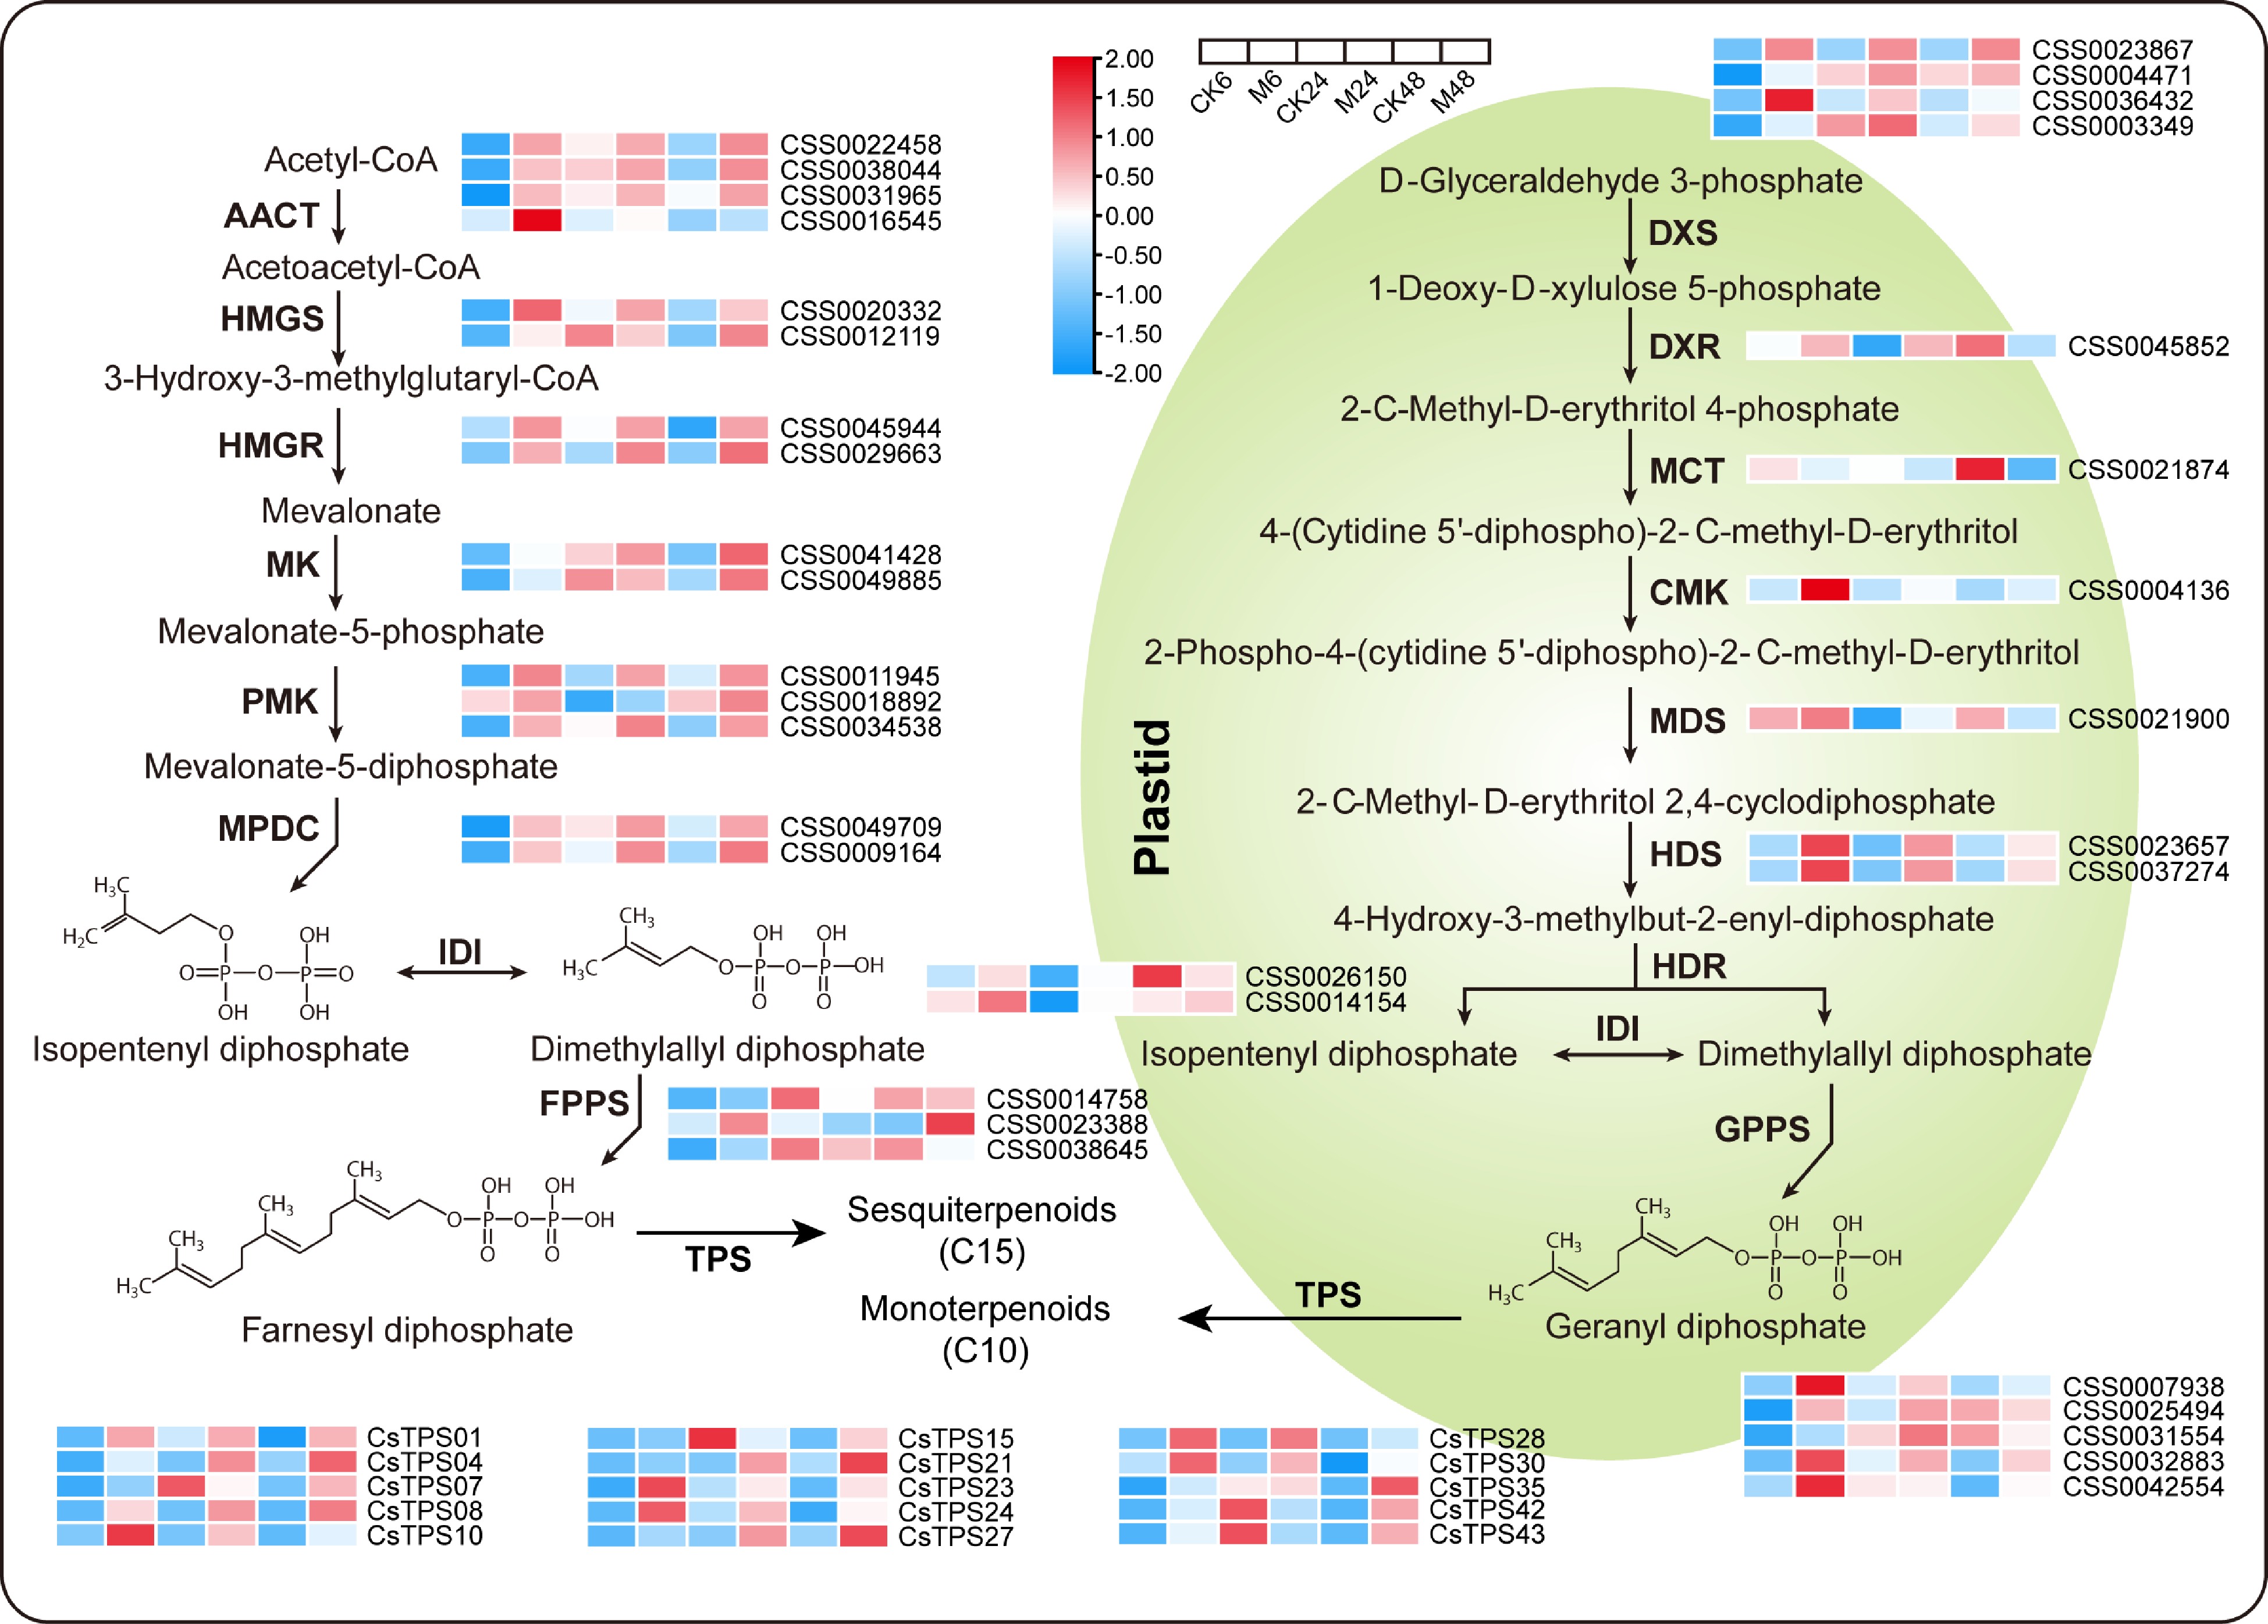
Figure 4.
Expression patterns of key genes in the terpene synthesis pathway at different time points after E. onukii Matsuda feeding. Expression level is based on the log2 value of FPKM. Red and blue indicate higher or lower expression levels of genes, respectively. The heatmaps are drawn using TBtools software, and the original data of the drawing is shown in Supplemental Table S3. AACT, acetoacetyl-CoA thiolase; HMGS, 3-hydroxy-3-methylglutaryl-CoA synthase; HMGR, 3-hydroxy-3-methylglutaryl-CoA reductase; MK, mevalonate kinase; PMK, phospho-mevalonate kinase; MPDC, mevalonate-5-diphosphate decarboxylase; IDI, isopentenyl diphosphate isomerase; FPPS, farnesyl diphosphate synthase; GPPS, geranyl diphosphate synthase; TPS, terpene synthase; DXS, 1-deoxy-D-xylulose 5-phosphate synthase; DXR, 1-deoxy-D-xylulose 5-phosphate reductase; MCT, 2-C-methyl-D-erythritol 4-phosphate (MEP) cytidyltransferase; CMK, 4-diphosphocytidyl-2-C-methyl-D-erythritol kinase; MDS, 2-C-methyl-D-erythritol 2,4-cyclodiphosphate synthase; HDS, (E)-4-hydroxy-3-methyl-but-2-enyl diphosphate synthase; HDR, (E)-4-hydroxy-3-methyl-but-2-enyl diphosphate reductase.
-
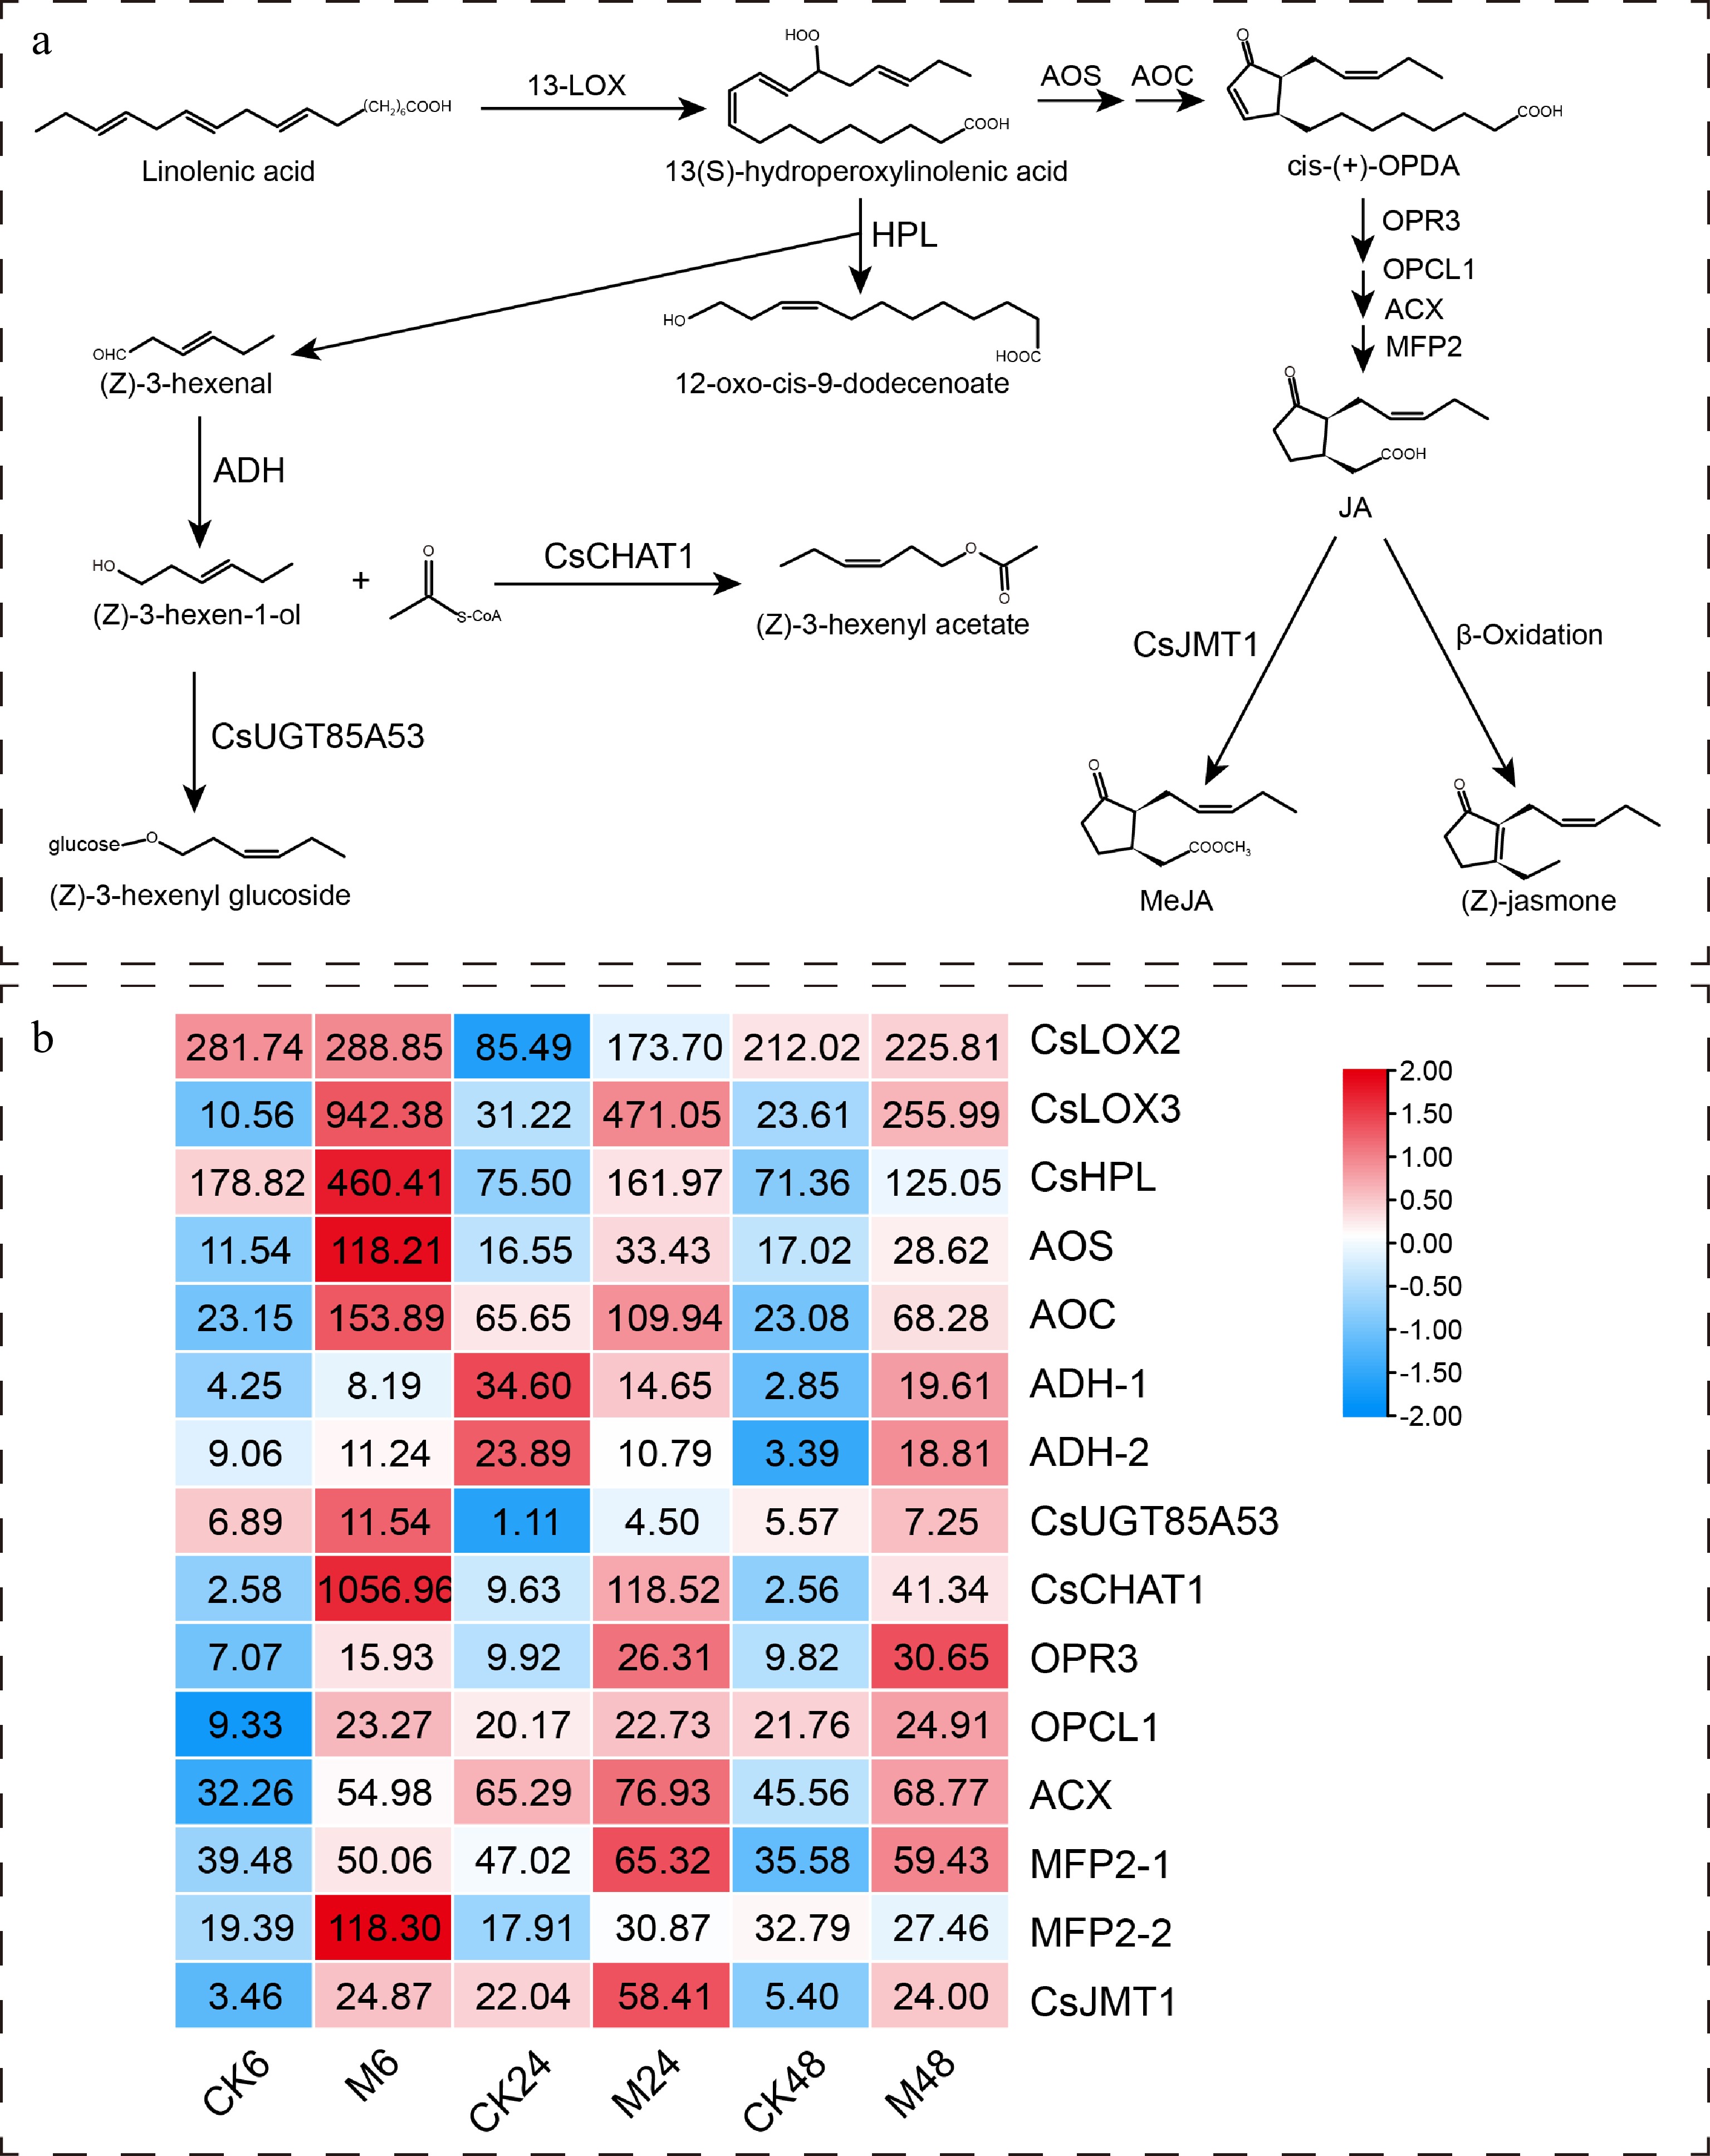
Figure 5.
Expression characteristics of key genes in α-linolenic acid metabolism pathway at different time points after E. onukii Matsuda feeding. (a) The α-linolenic acid metabolism pathway and its key genes in tea plant. (b) Heatmap of key gene expression patterns in α-linolenic acid metabolism pathway. The number on the heat map represents the average FPKM value. The heatmaps are drawn using TBtools software. 13-LOX, 13S-lipoxygenase; HPL, hydroperoxide lyase; ADH, alcohol dehydrogenase; CHAT, acetyl CoA:(Z)-3-hexen-1-ol acetyltransferase; UGT, uridine-diphosphate-dependent glycosyltransferase; AOS, allene oxide synthase; AOC, allene oxide cyclase; OPR3, OPDA reductase 3; OPCL1, OPC-8:0 CoA ligase 1; ACX, acyl-CoA oxidase; MFP2, multifunctional protein 2; JMT, jasmonic acid carboxyl methyltransferase.
-
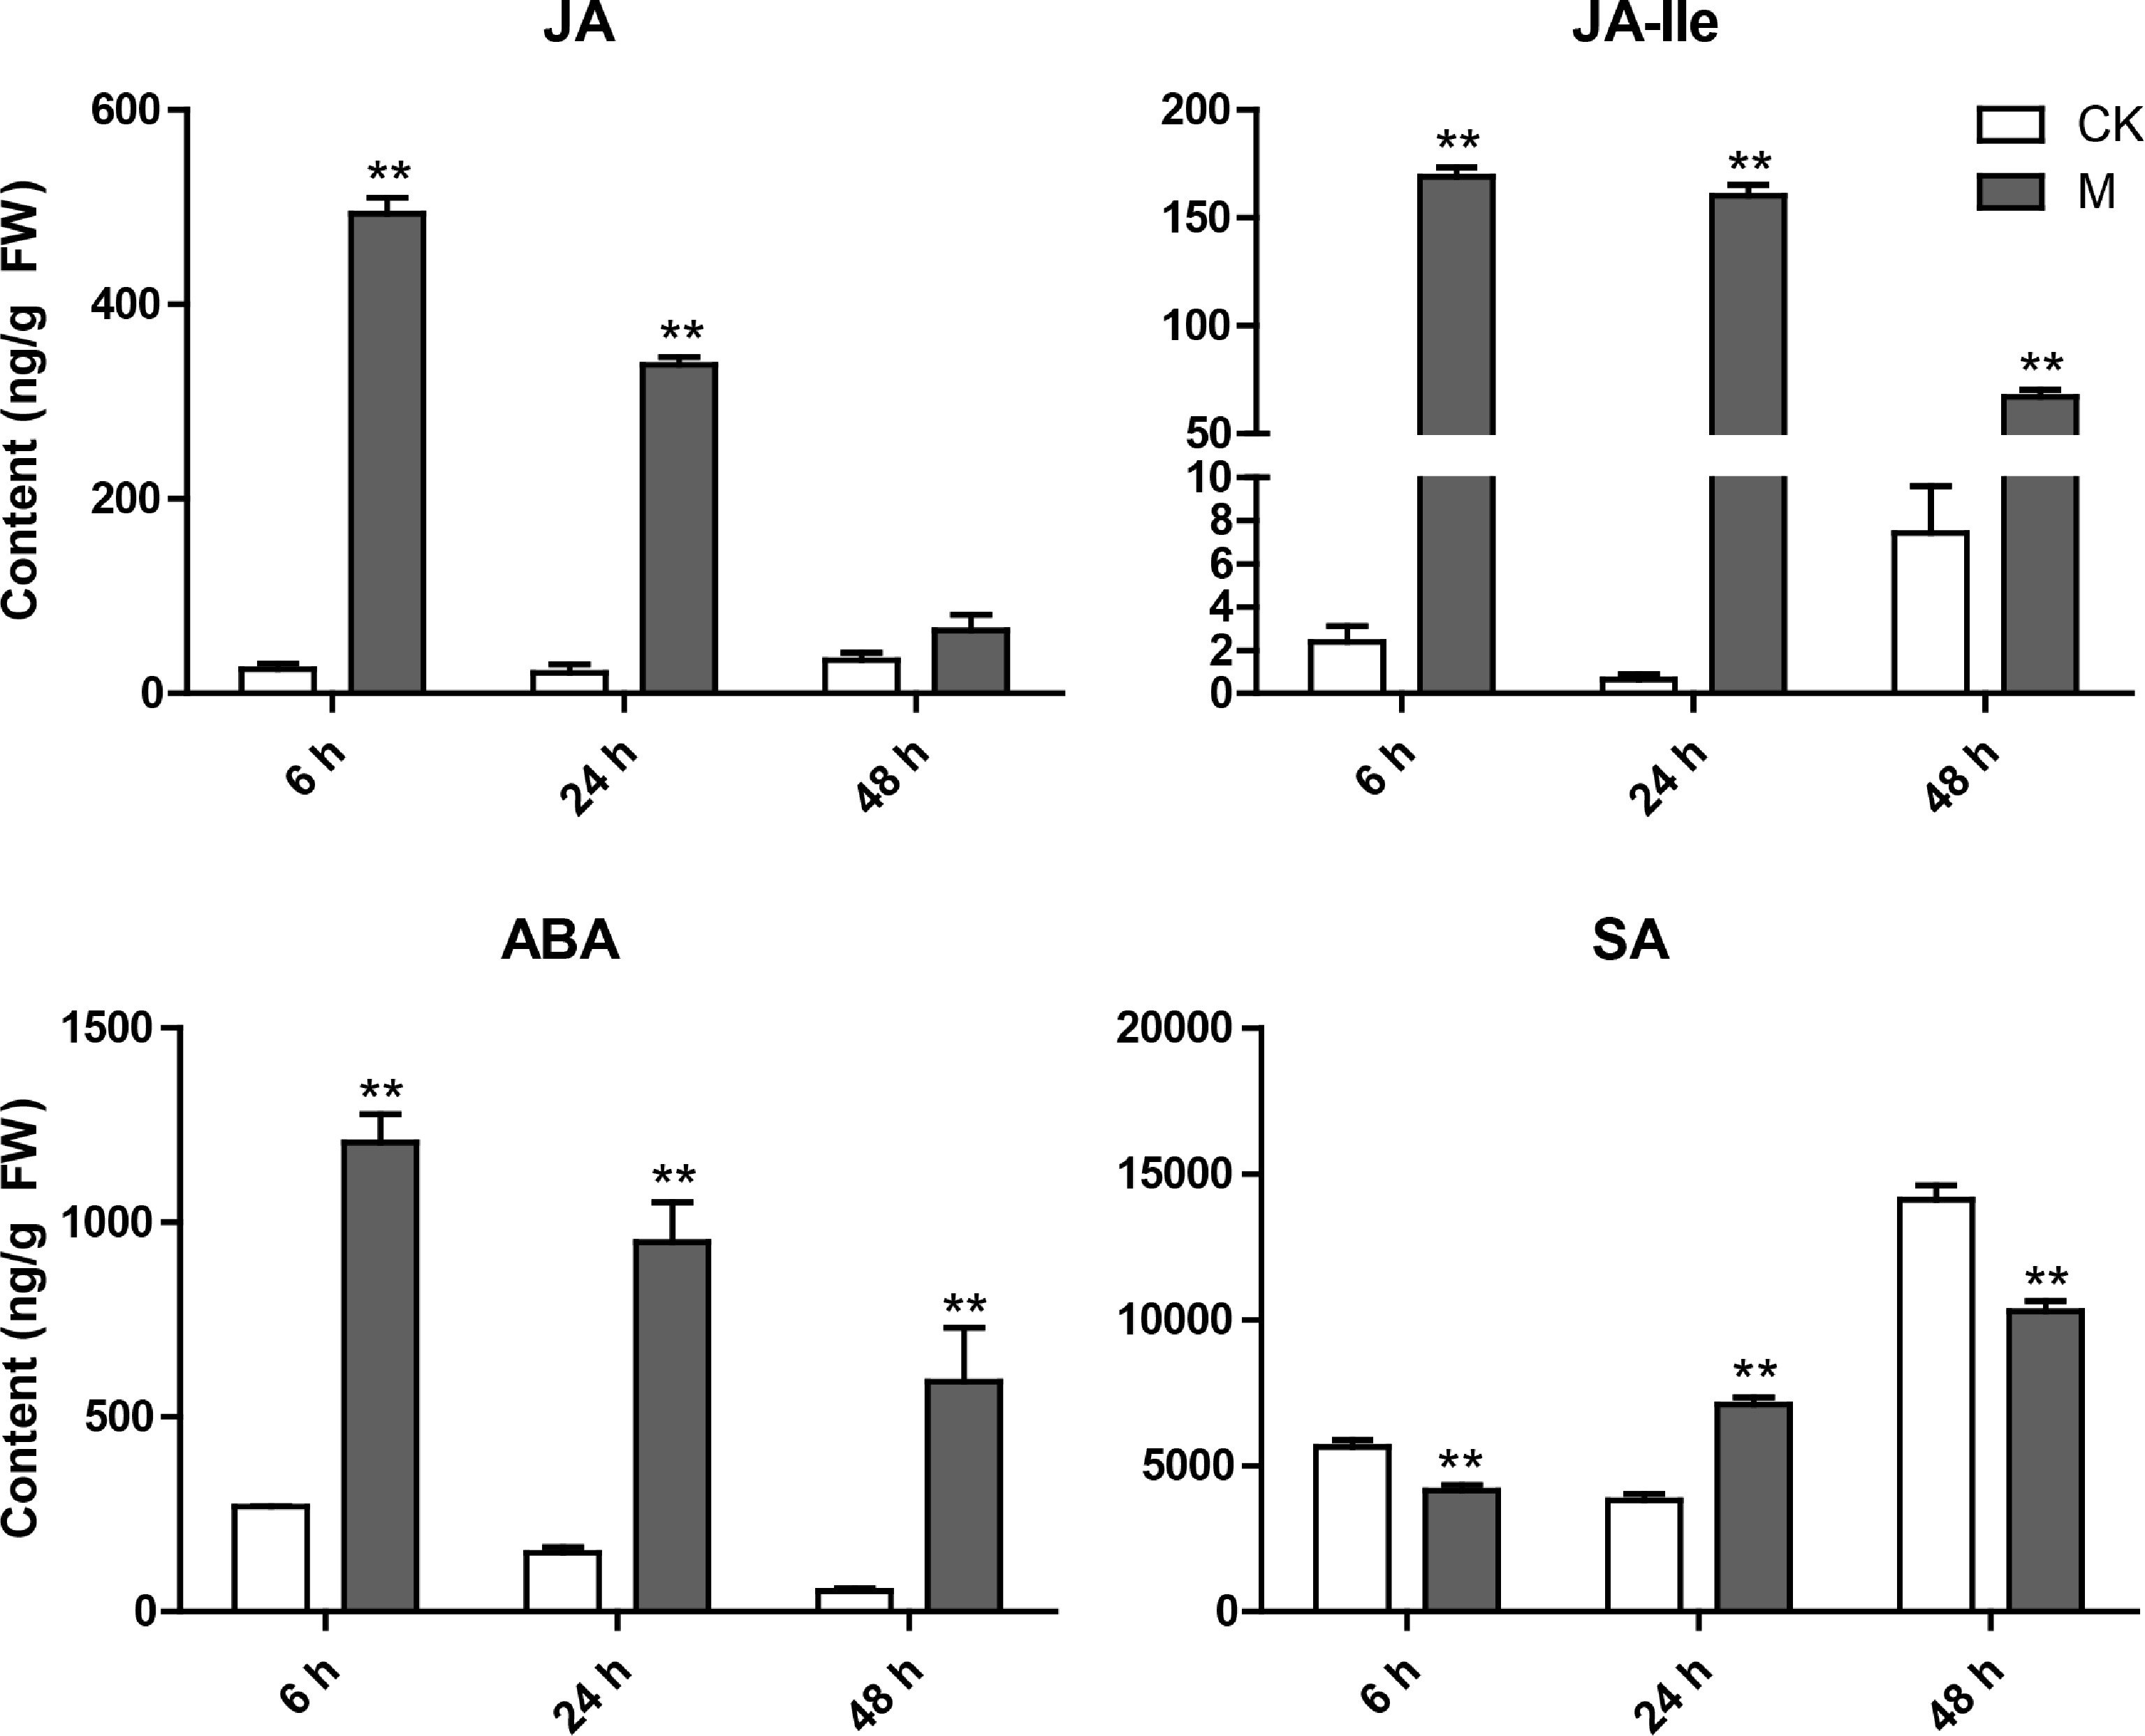
Figure 6.
Variation characteristics of main hormone (JA, JA-Ile, ABA and SA) content in tea plant leaves at different time points after E. onukii Matsuda feeding. Data are expressed as mean+standard deviation (SD) (n = 3). ** Indicates significant difference at the p < 0.01 level.
-
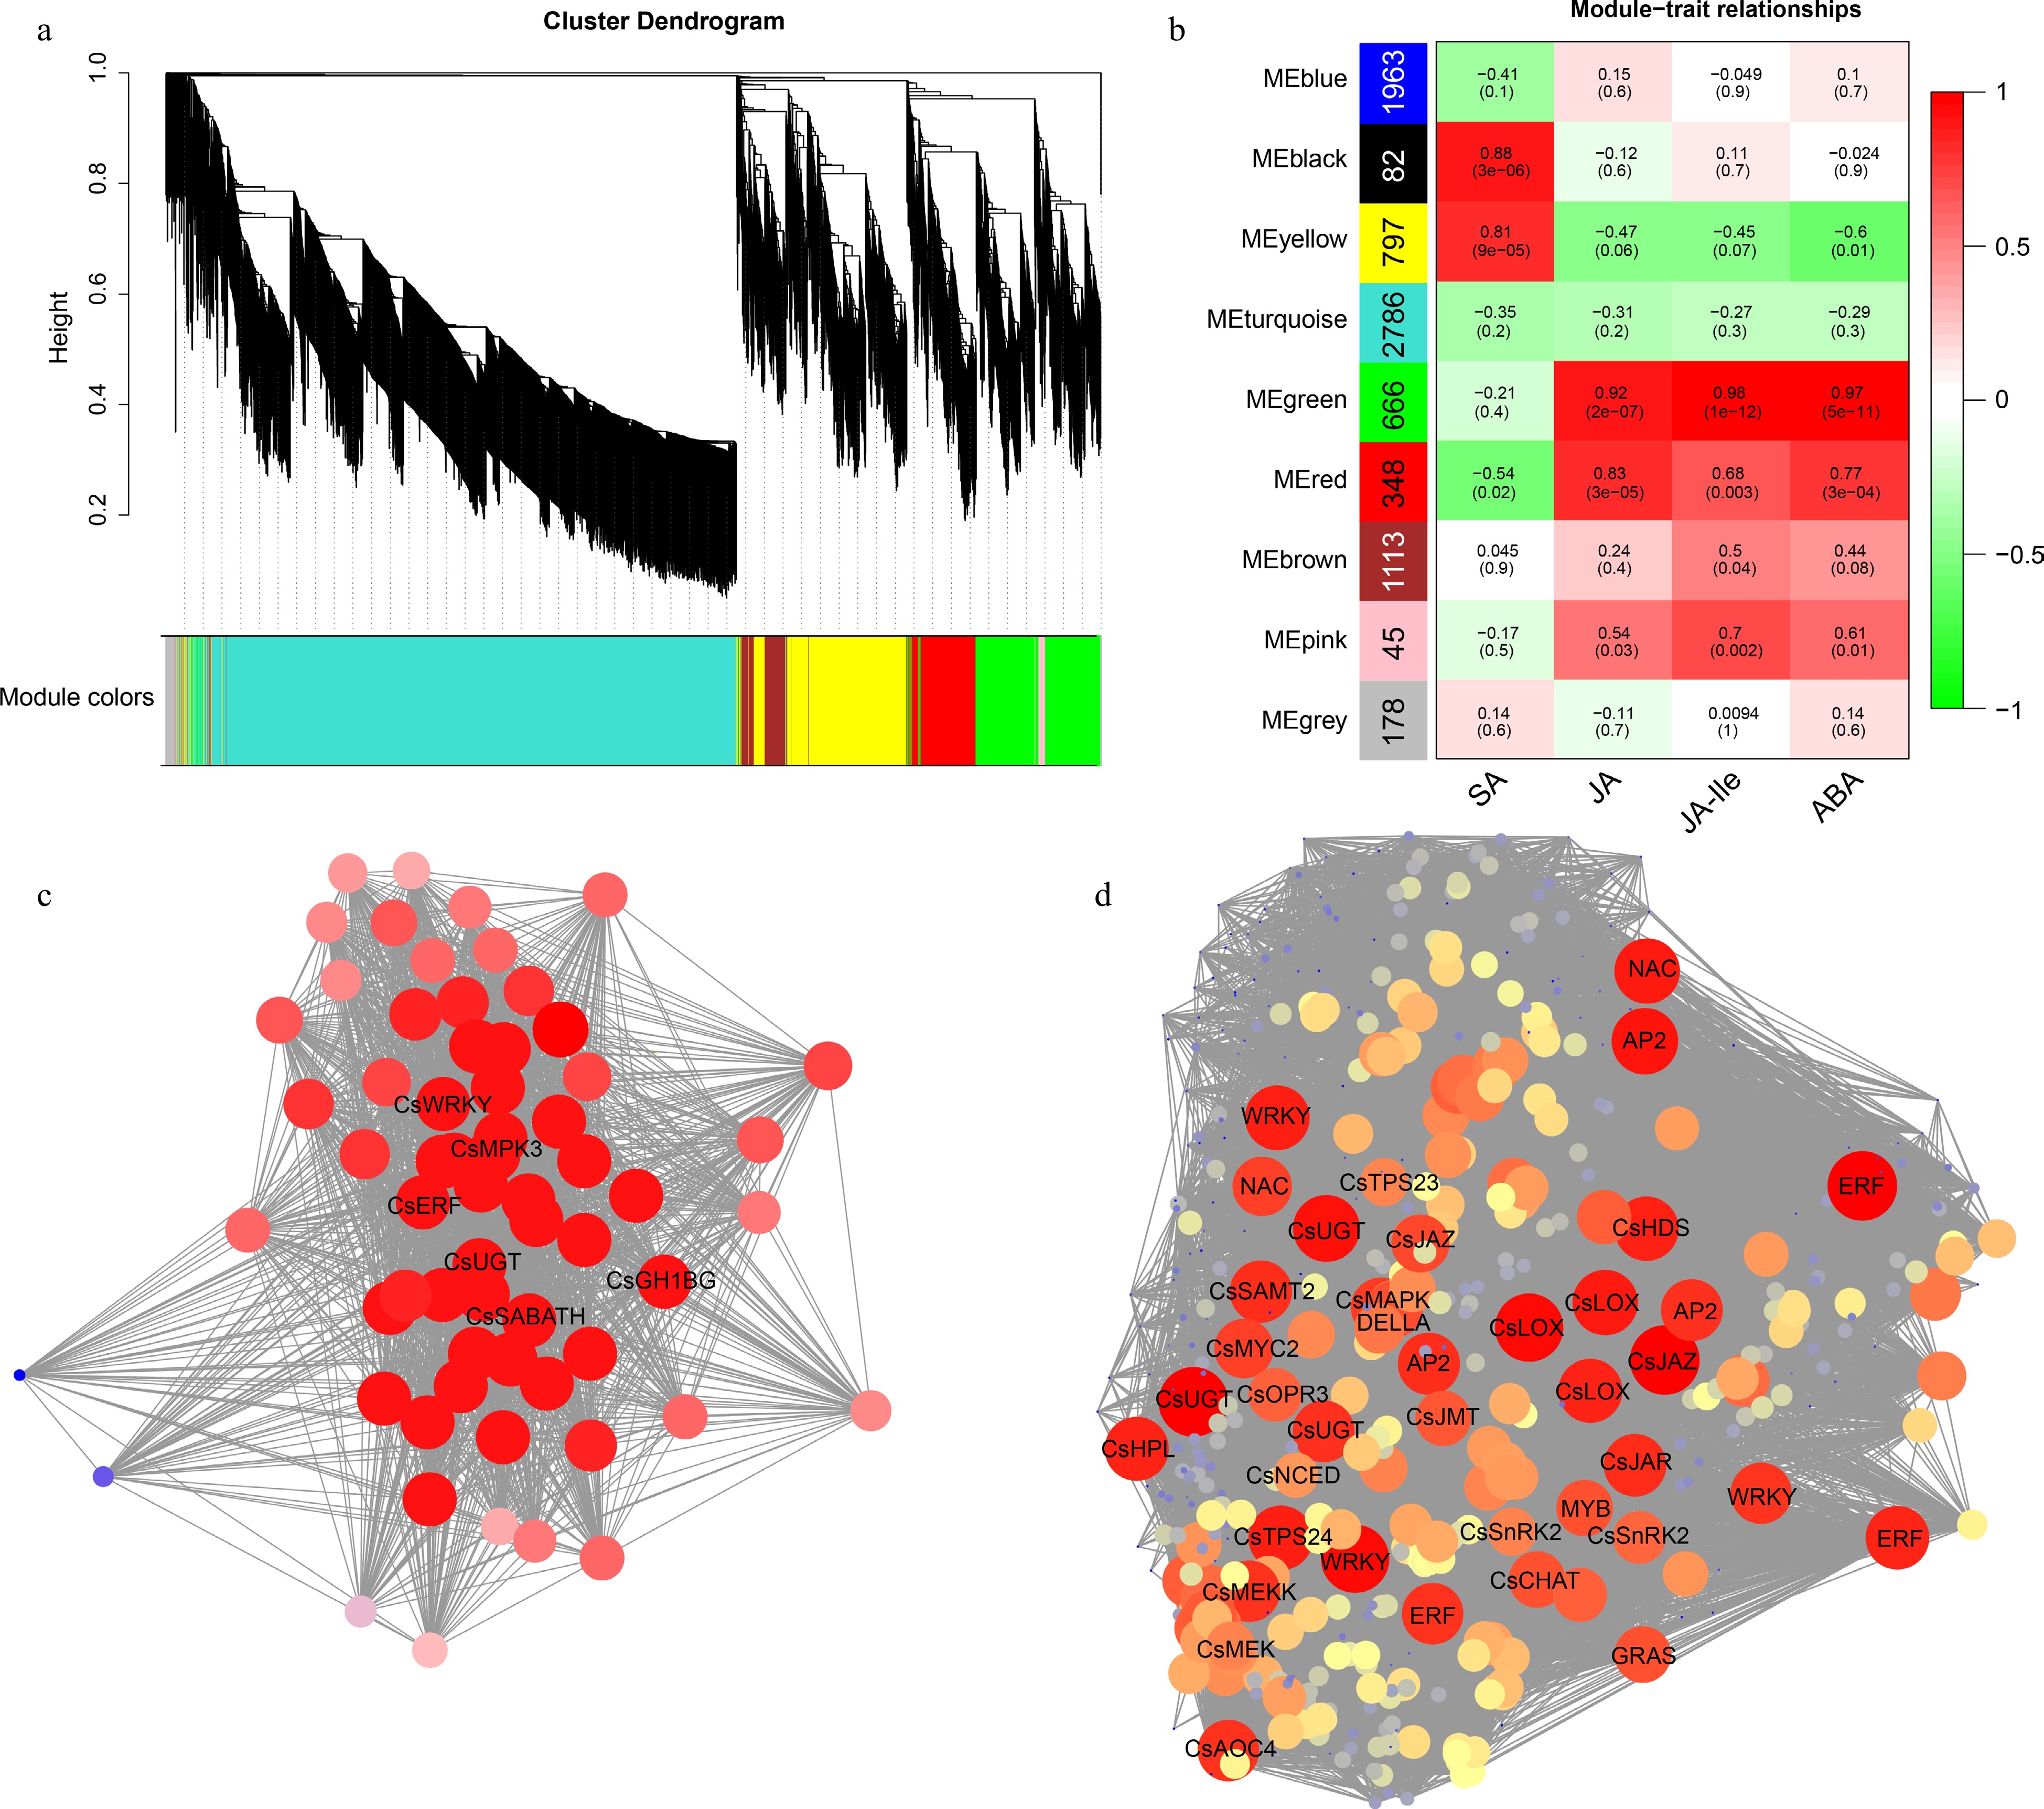
Figure 7.
WGCNA of genes responding to E. onukii Matsuda feeding in tea plant leaves. (a) Clustering dendrograms of genes. (b) Heatmap of correlation between module and trait. The vertical axis represents different modules, the left column of numbers represents the number of genes in the module and each set of data on the right represents the correlation coefficient. Gene co-expression networks of hub genes of (c) black module and (d) green module.
-
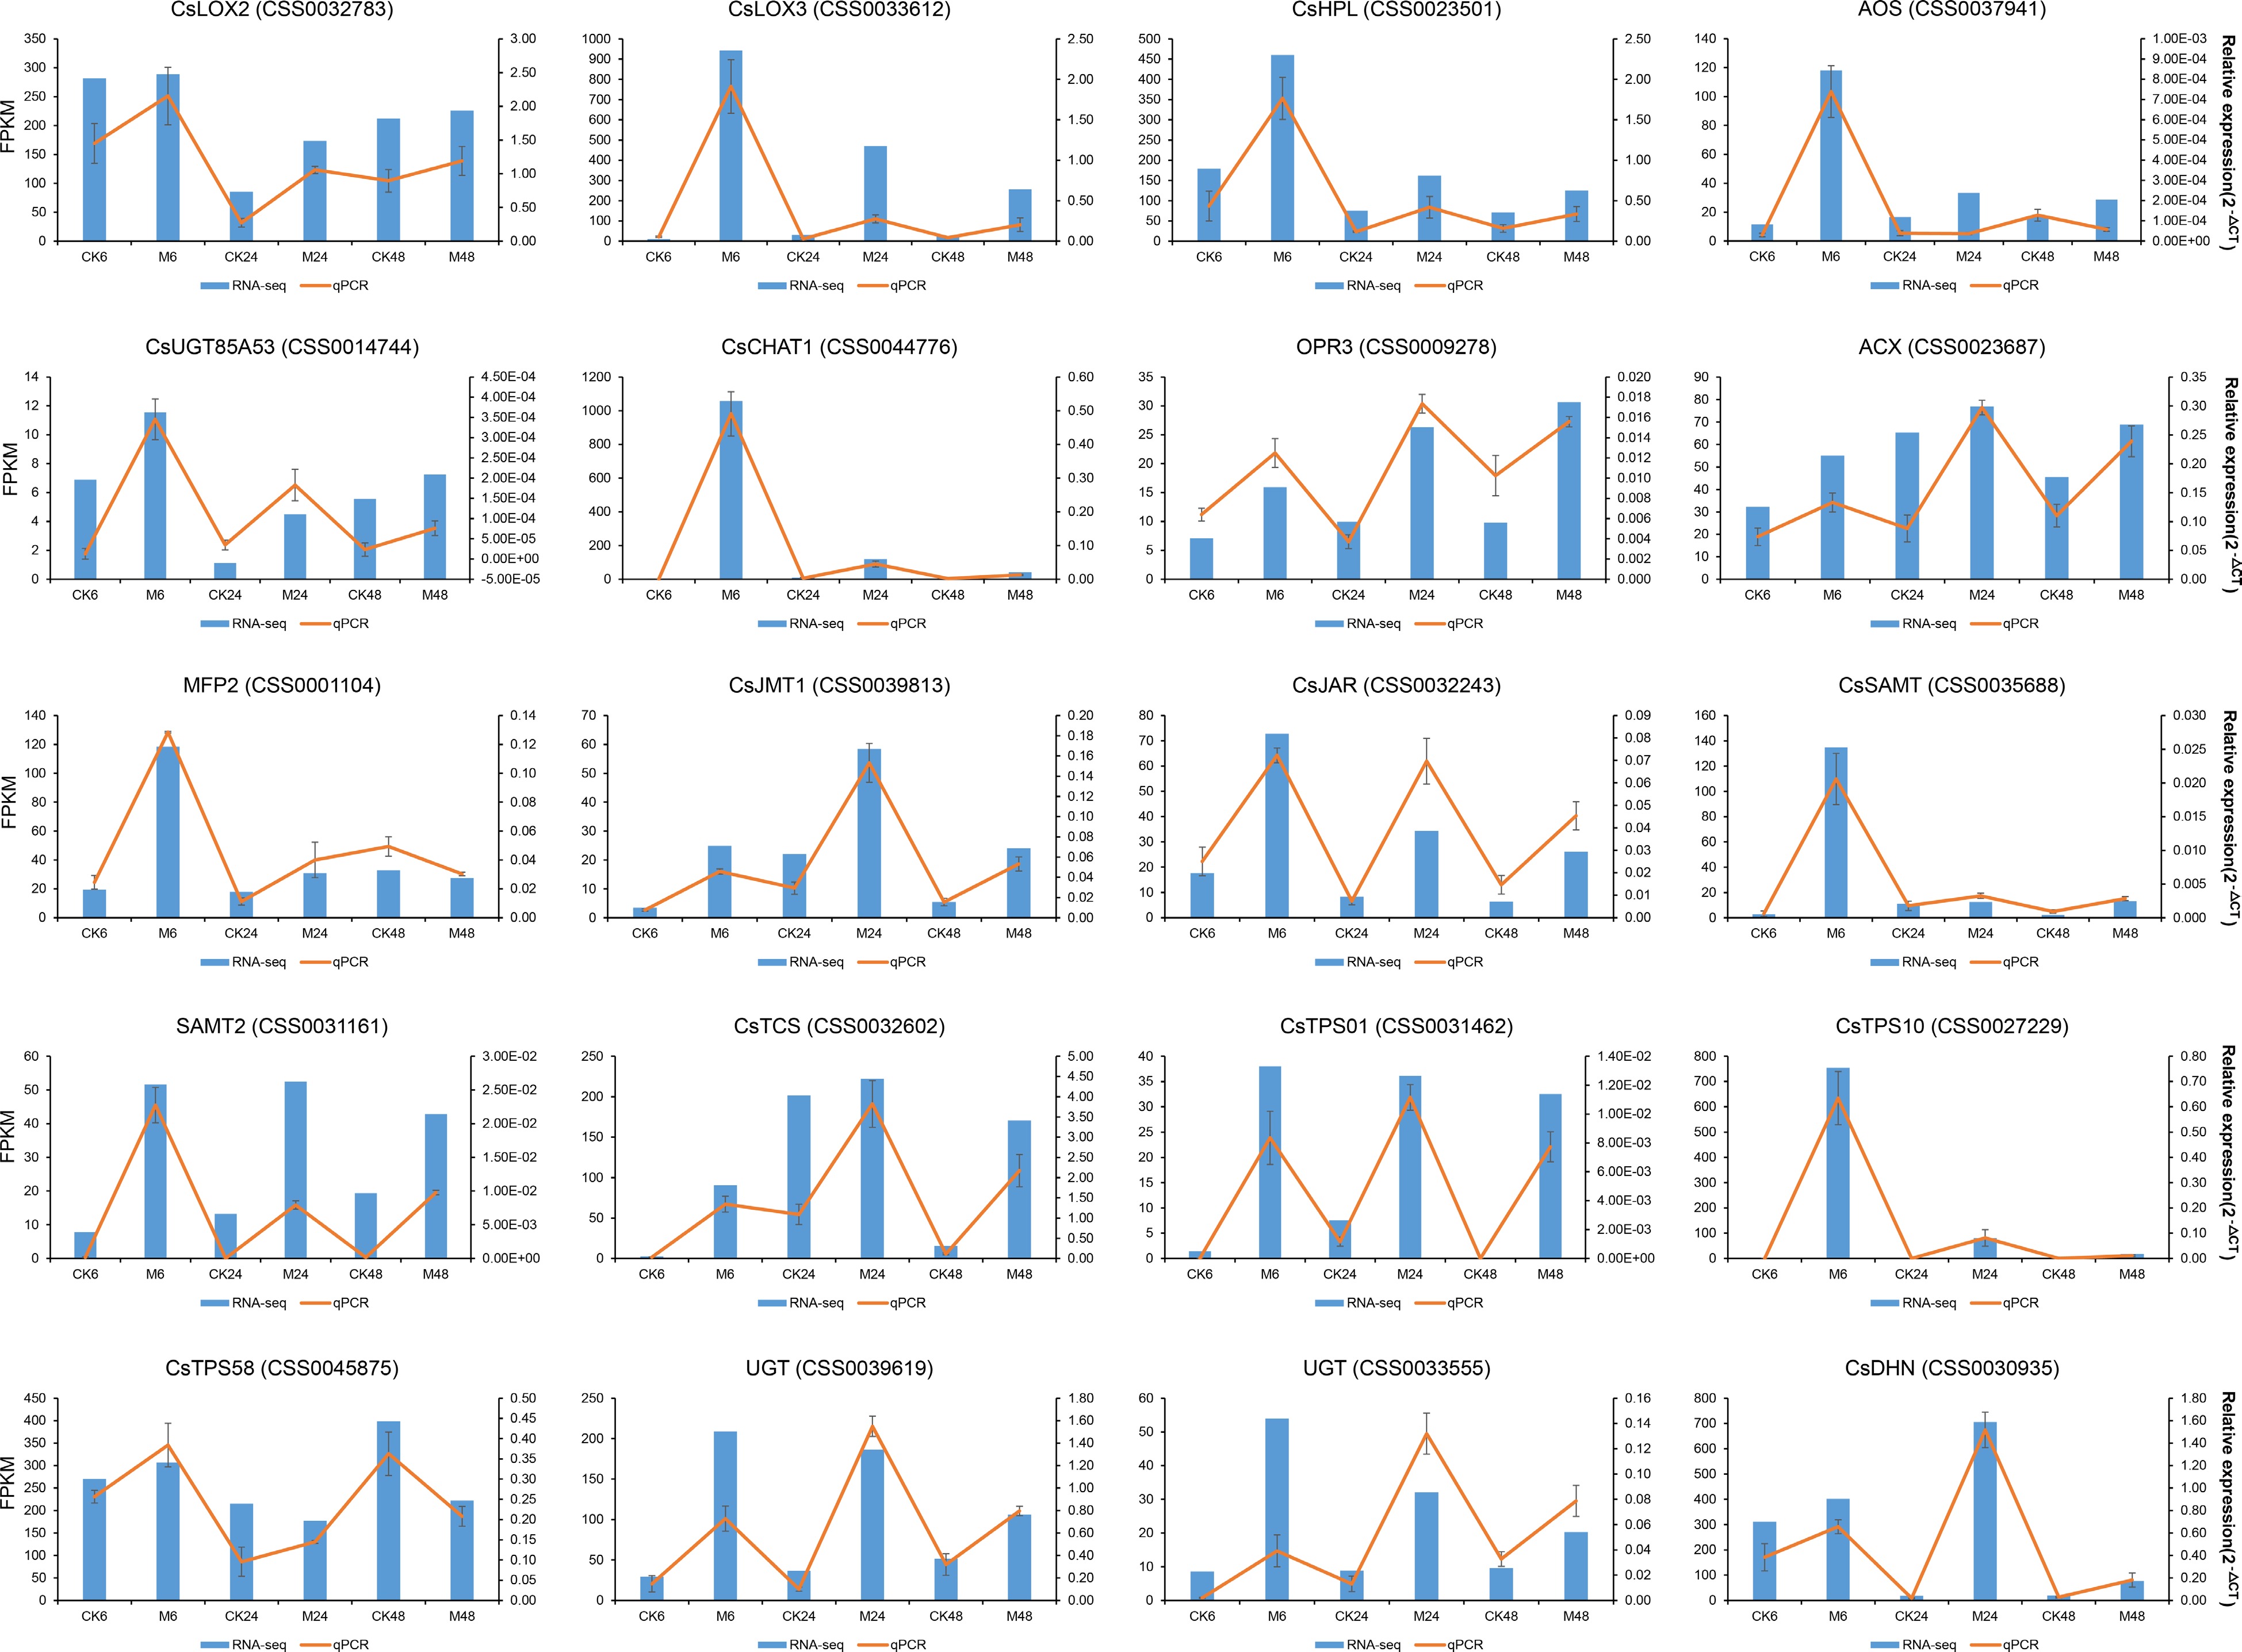
Figure 8.
qRT-PCR validation of the expression levels of the genes in α-linolenic acid metabolism pathway, terpene synthesis pathway and the two co-expression networks in Fig. 7.
Figures
(8)
Tables
(0)