-
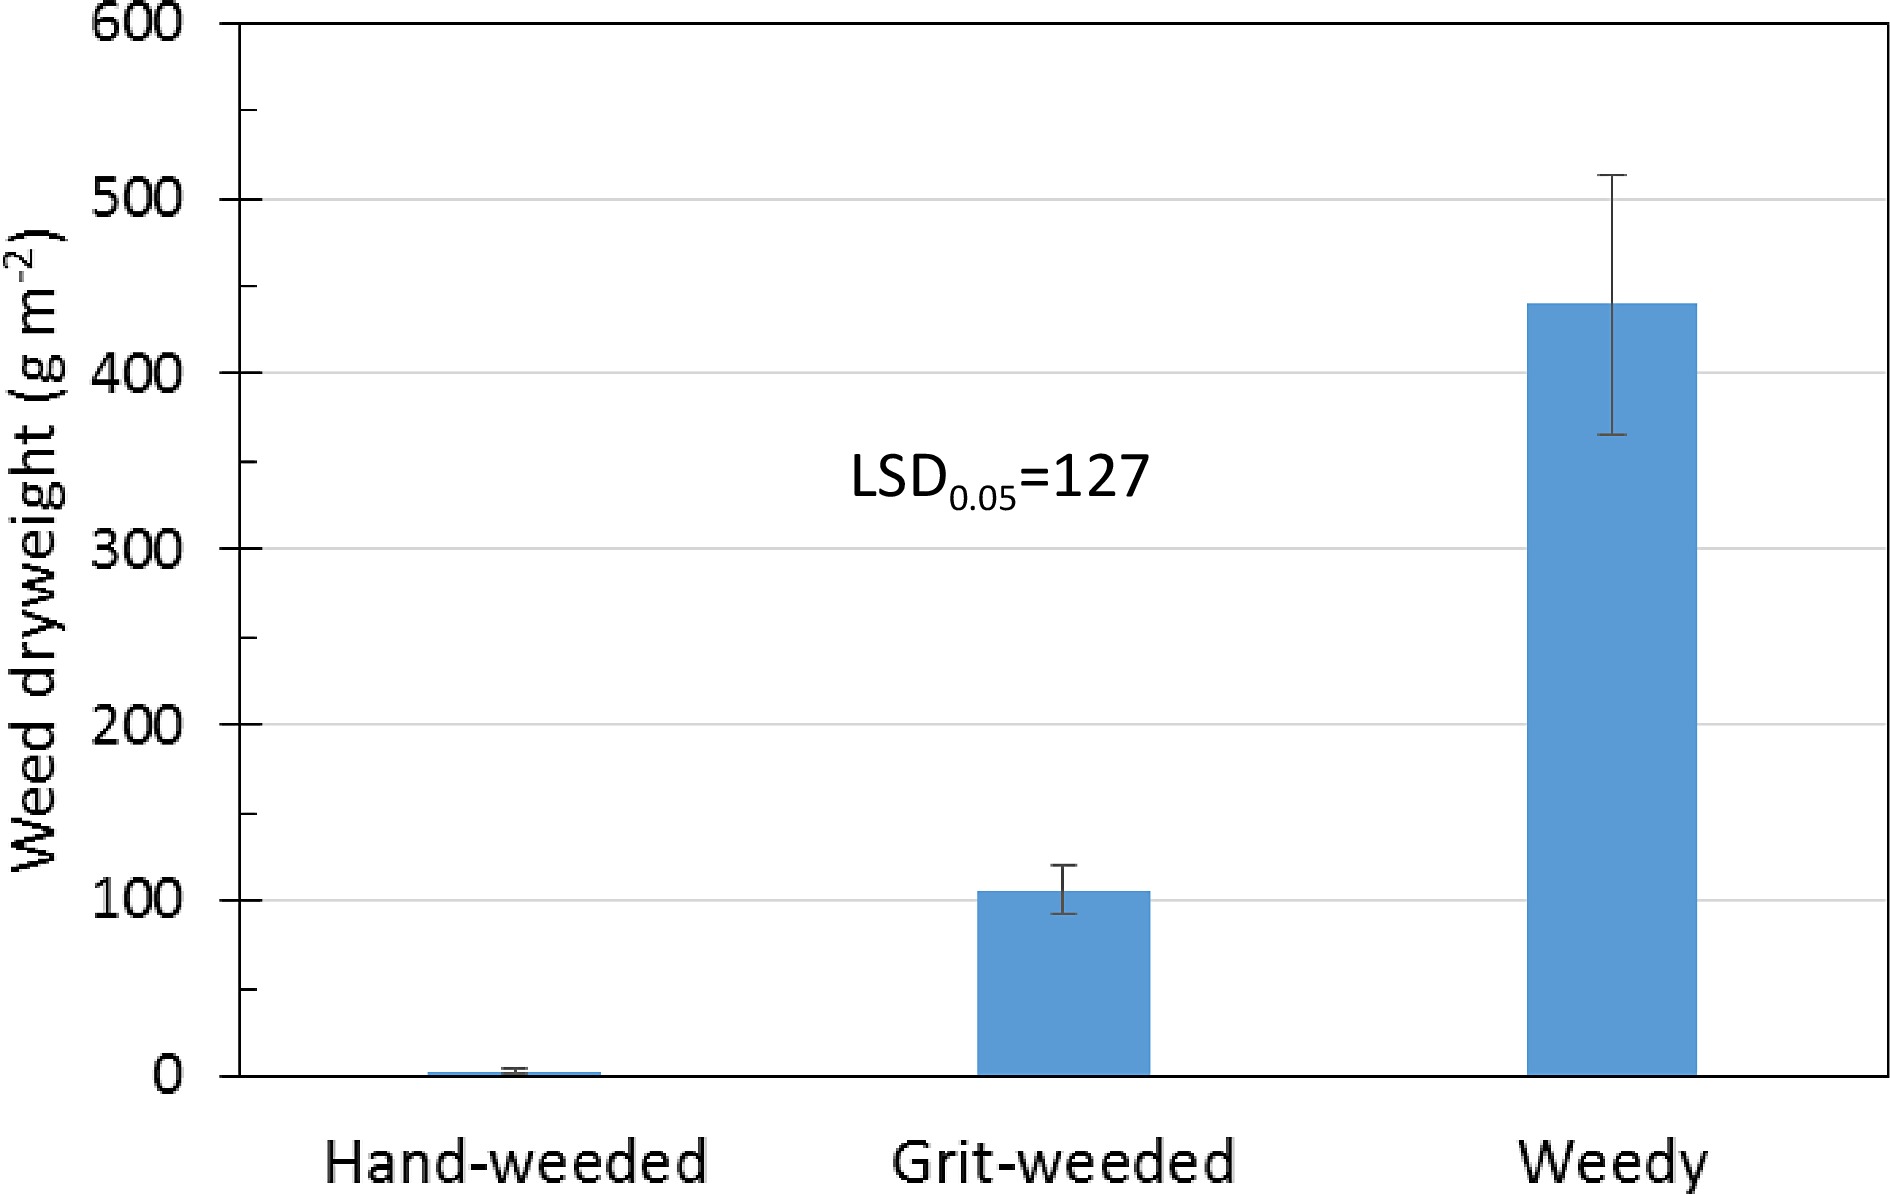
Figure 1.
Weed dry weights (mean ± s.e.) as affected by three weed control treatments in late July in an apple orchard over two years
(2018 and 2019). LSD = least significant difference (P = 0.05). -

Figure 2.
Annual growth (mean ± s.e.) of longest leader shoot of apple as affected by three weed management treatments. Slashed bars, 2018; solid bars, 2019.
-
Years Treatments Hand-weeded Grit-weeded Events Time (min) Events Time (min) Grit (kg) 2018 11 ± 0 7.0 ± 0.38 11 ± 0 17.6 ± 0.50 4.6 ± 0.11 2019 13 ± 0 5.0 ± 0.74 12 ± 0 6.9 ± 0.70 1.9 ± 0.20 Table 1.
Number of weeding events, time spent weeding, and amounts of grit applied during experiments conducted over two years. Values for times and grit amounts represent cumulative means ± standard errors per m2 of plot area.
Figures
(2)
Tables
(1)