-
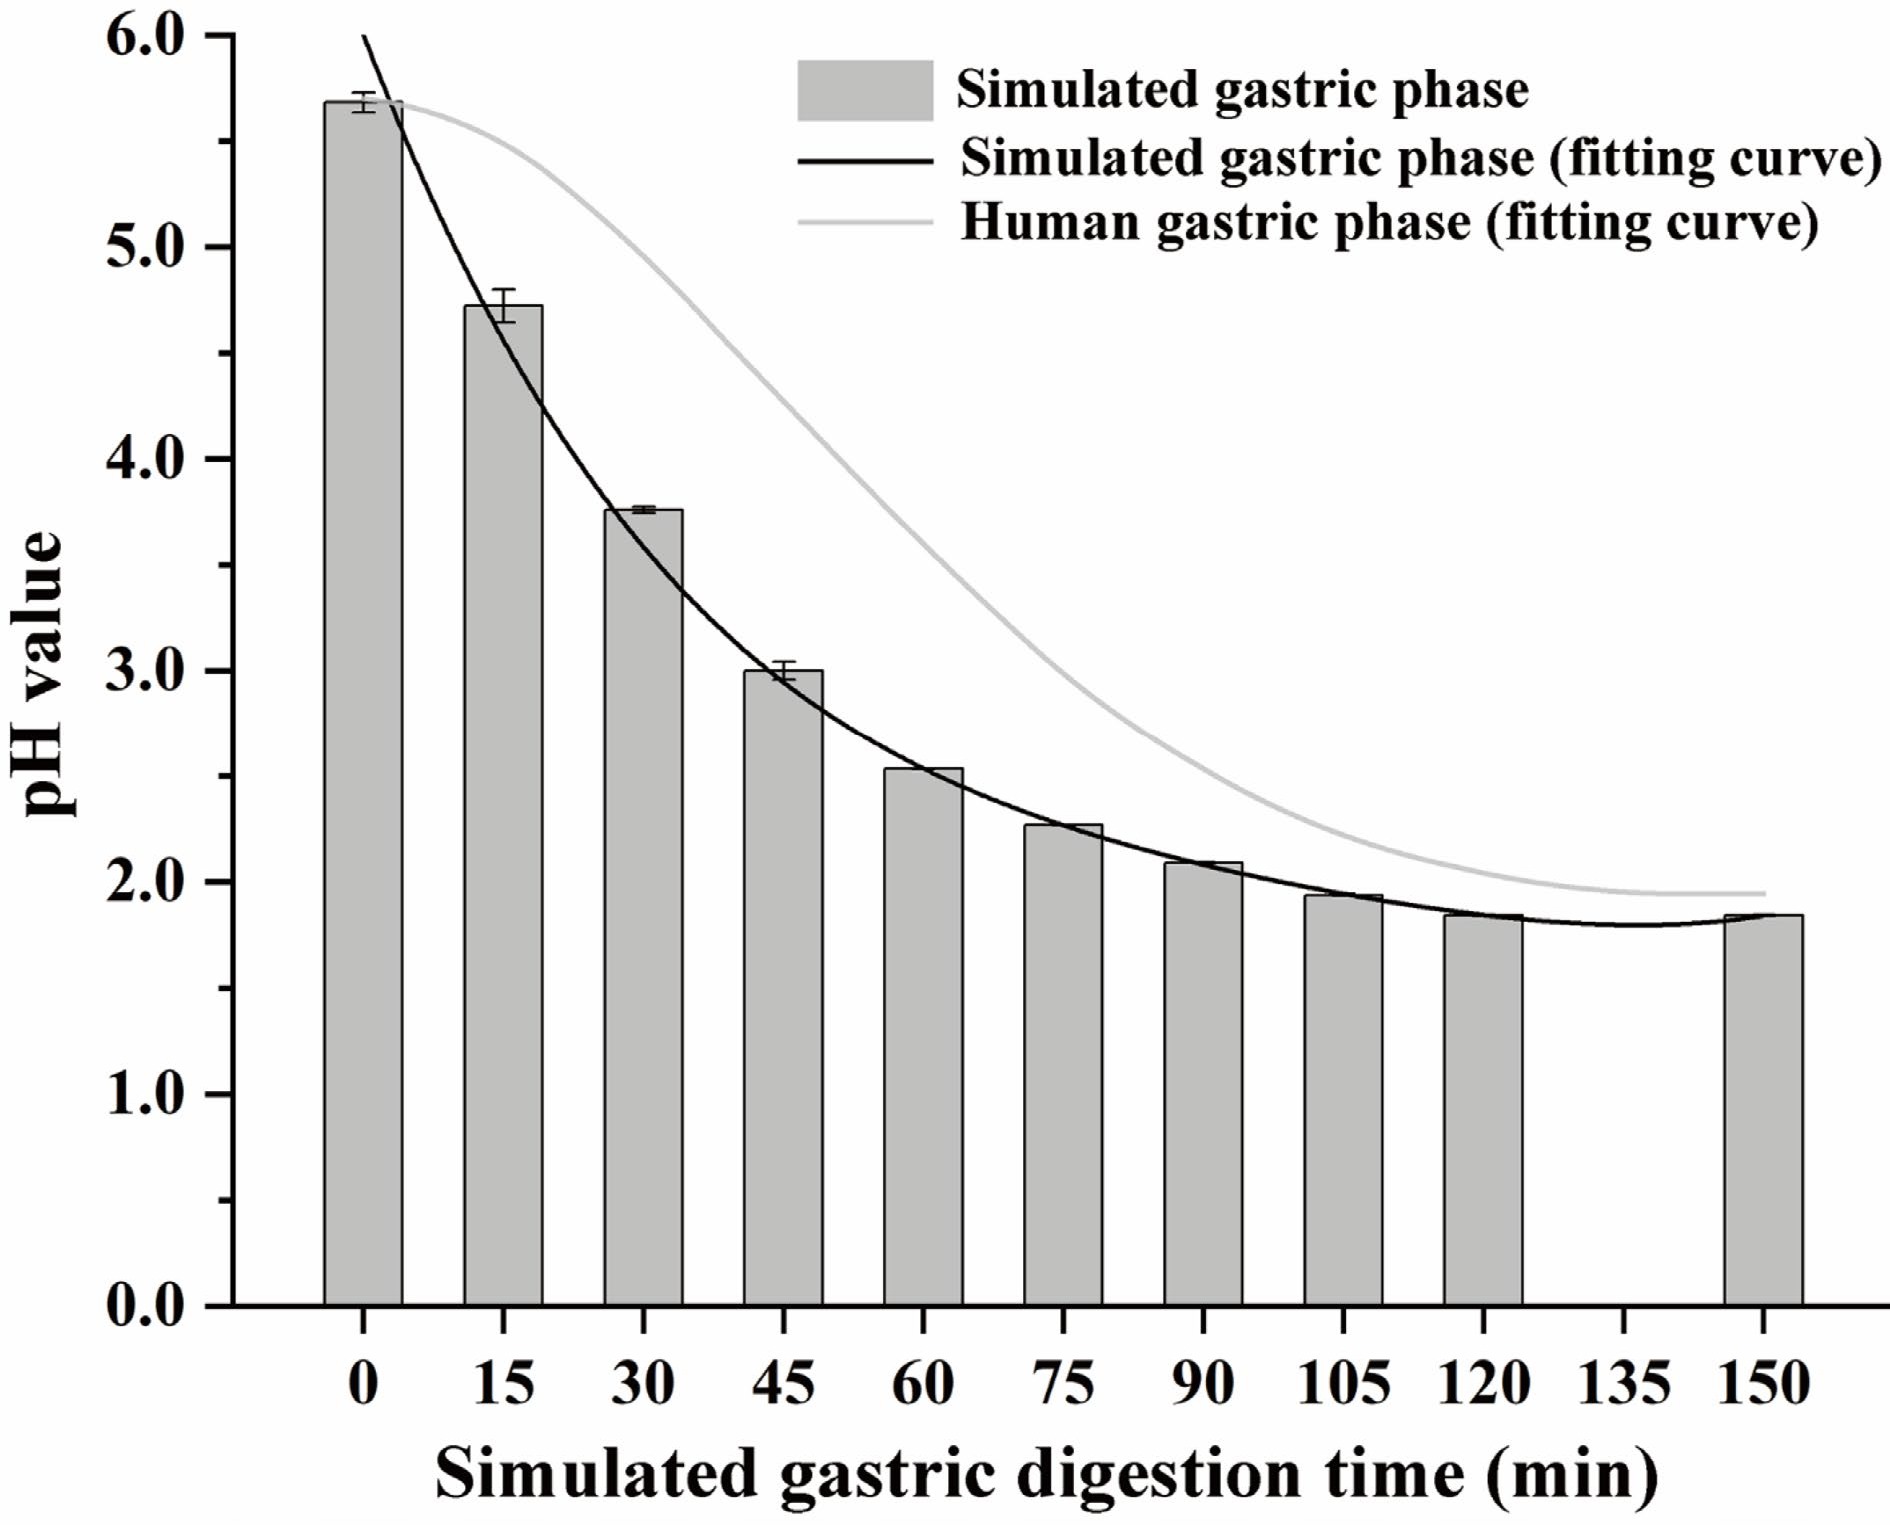
Figure 1.
The pH relates to the simulated gastric phase and human gastric phase. The fitting curve of human gastric phase pH refers to the conclusion of Sams et al.[26]
-
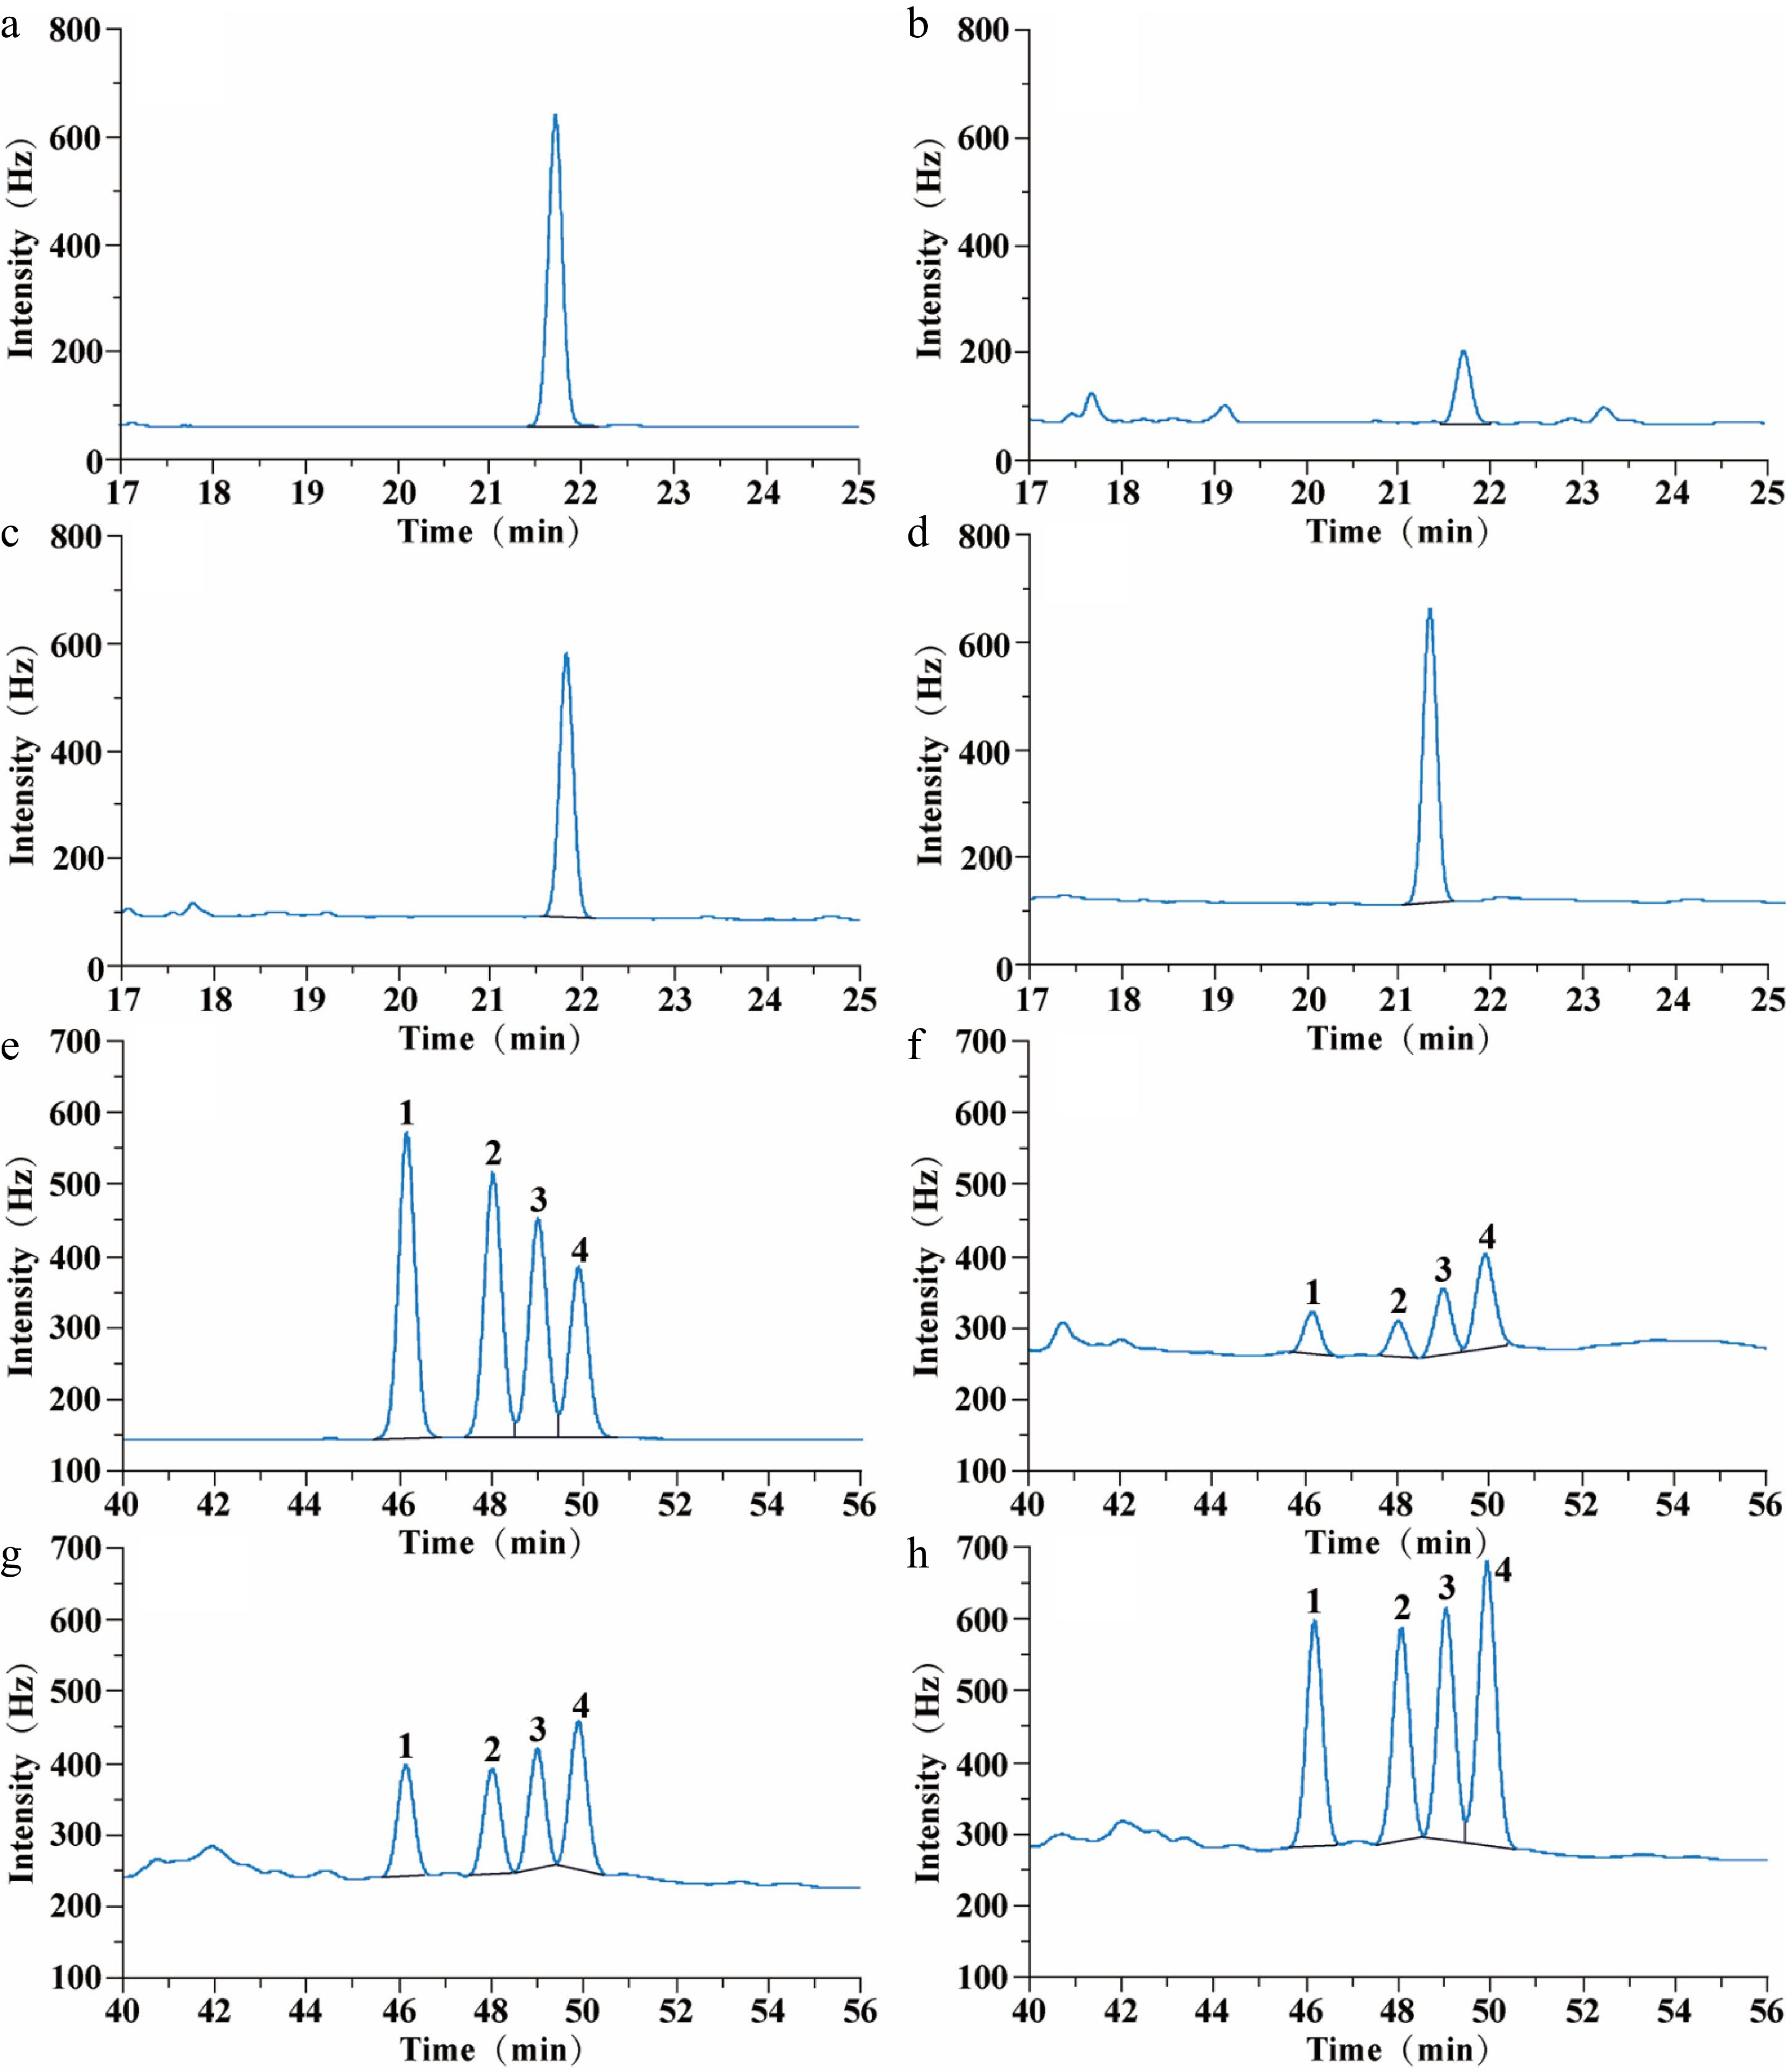
Figure 2.
Gas chromatograms of FP and CP from raw, steamed, and roasted oyster meat: (a) 0.5 µg·mL−1 FP standard chromatogram; (b) FP chromatogram of raw oysters; (c) FP chromatogram of steamed oysters; (d) FP chromatogram of roasted oysters; (e) 1 µg·mL−1 CP standard chromatogram; (f) CP chromatogram of raw oysters; (g) CP chromatogram of steamed oysters; (h) CP chromatogram of roasted oysters. The FP retention time was 21.8 min. CP retention time was 46.2 min (Low-efficiency cis-CP, peak 1); 48.0 min (Low-efficiency trans-CP, peak 2); 49.0 min (High-efficiency cis-CP, peak 3), and 49.8 min (High-efficiency trans-CP, peak 4).
-
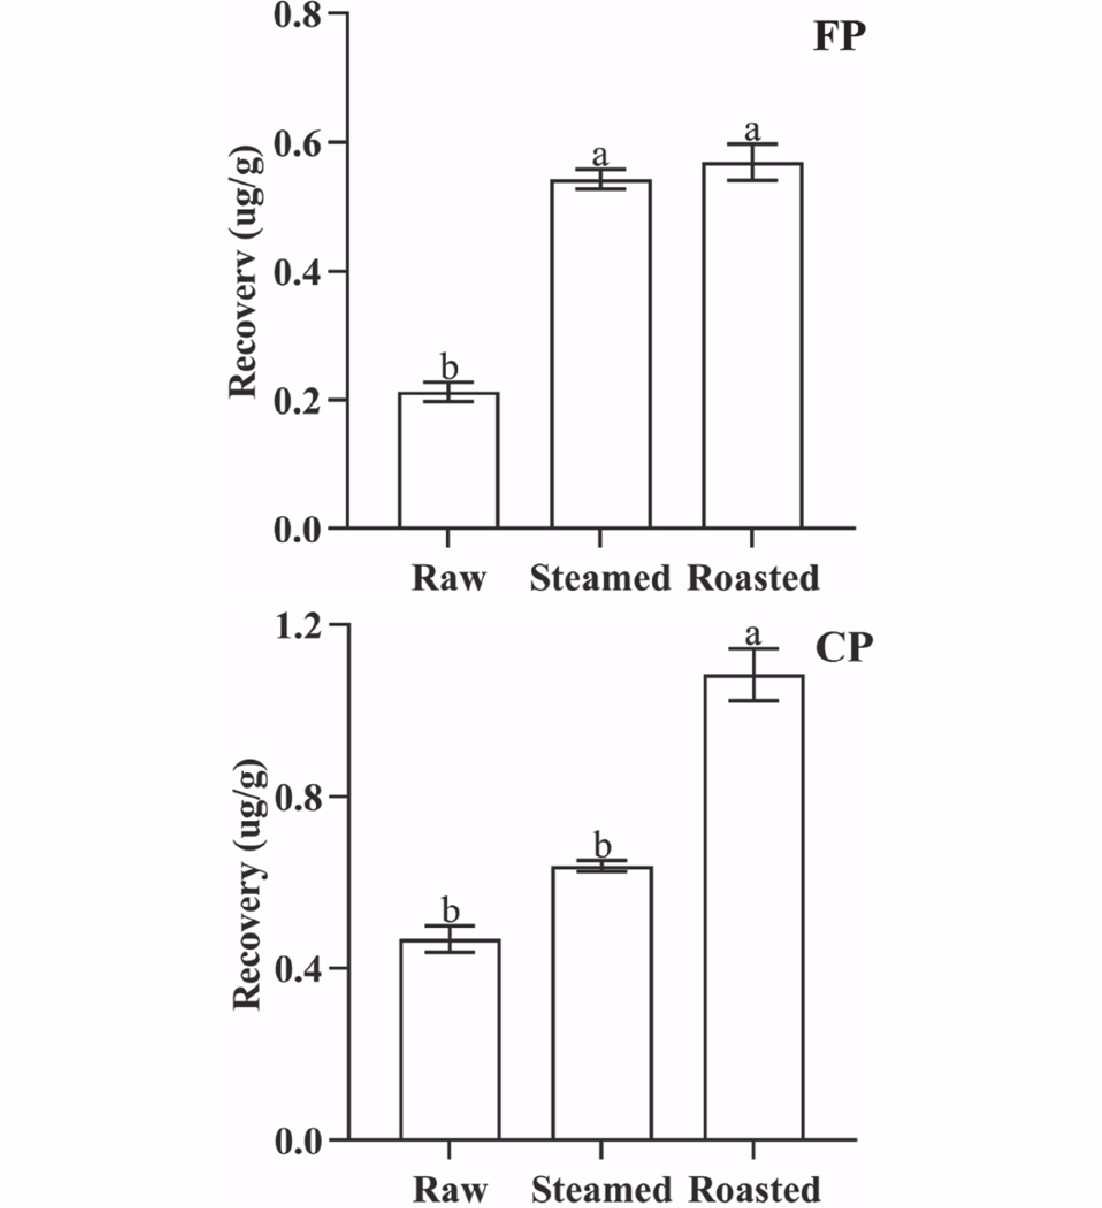
Figure 3.
QuEChERS recovery of FP and CP from 1 g oyster meat exposed to different cooking methods (steamed and roasted). Raw was uncooked. (Same lowercase letters (a, b) indicate no significant (ANOVA, p > 0.05) difference between the two groups of data).
-
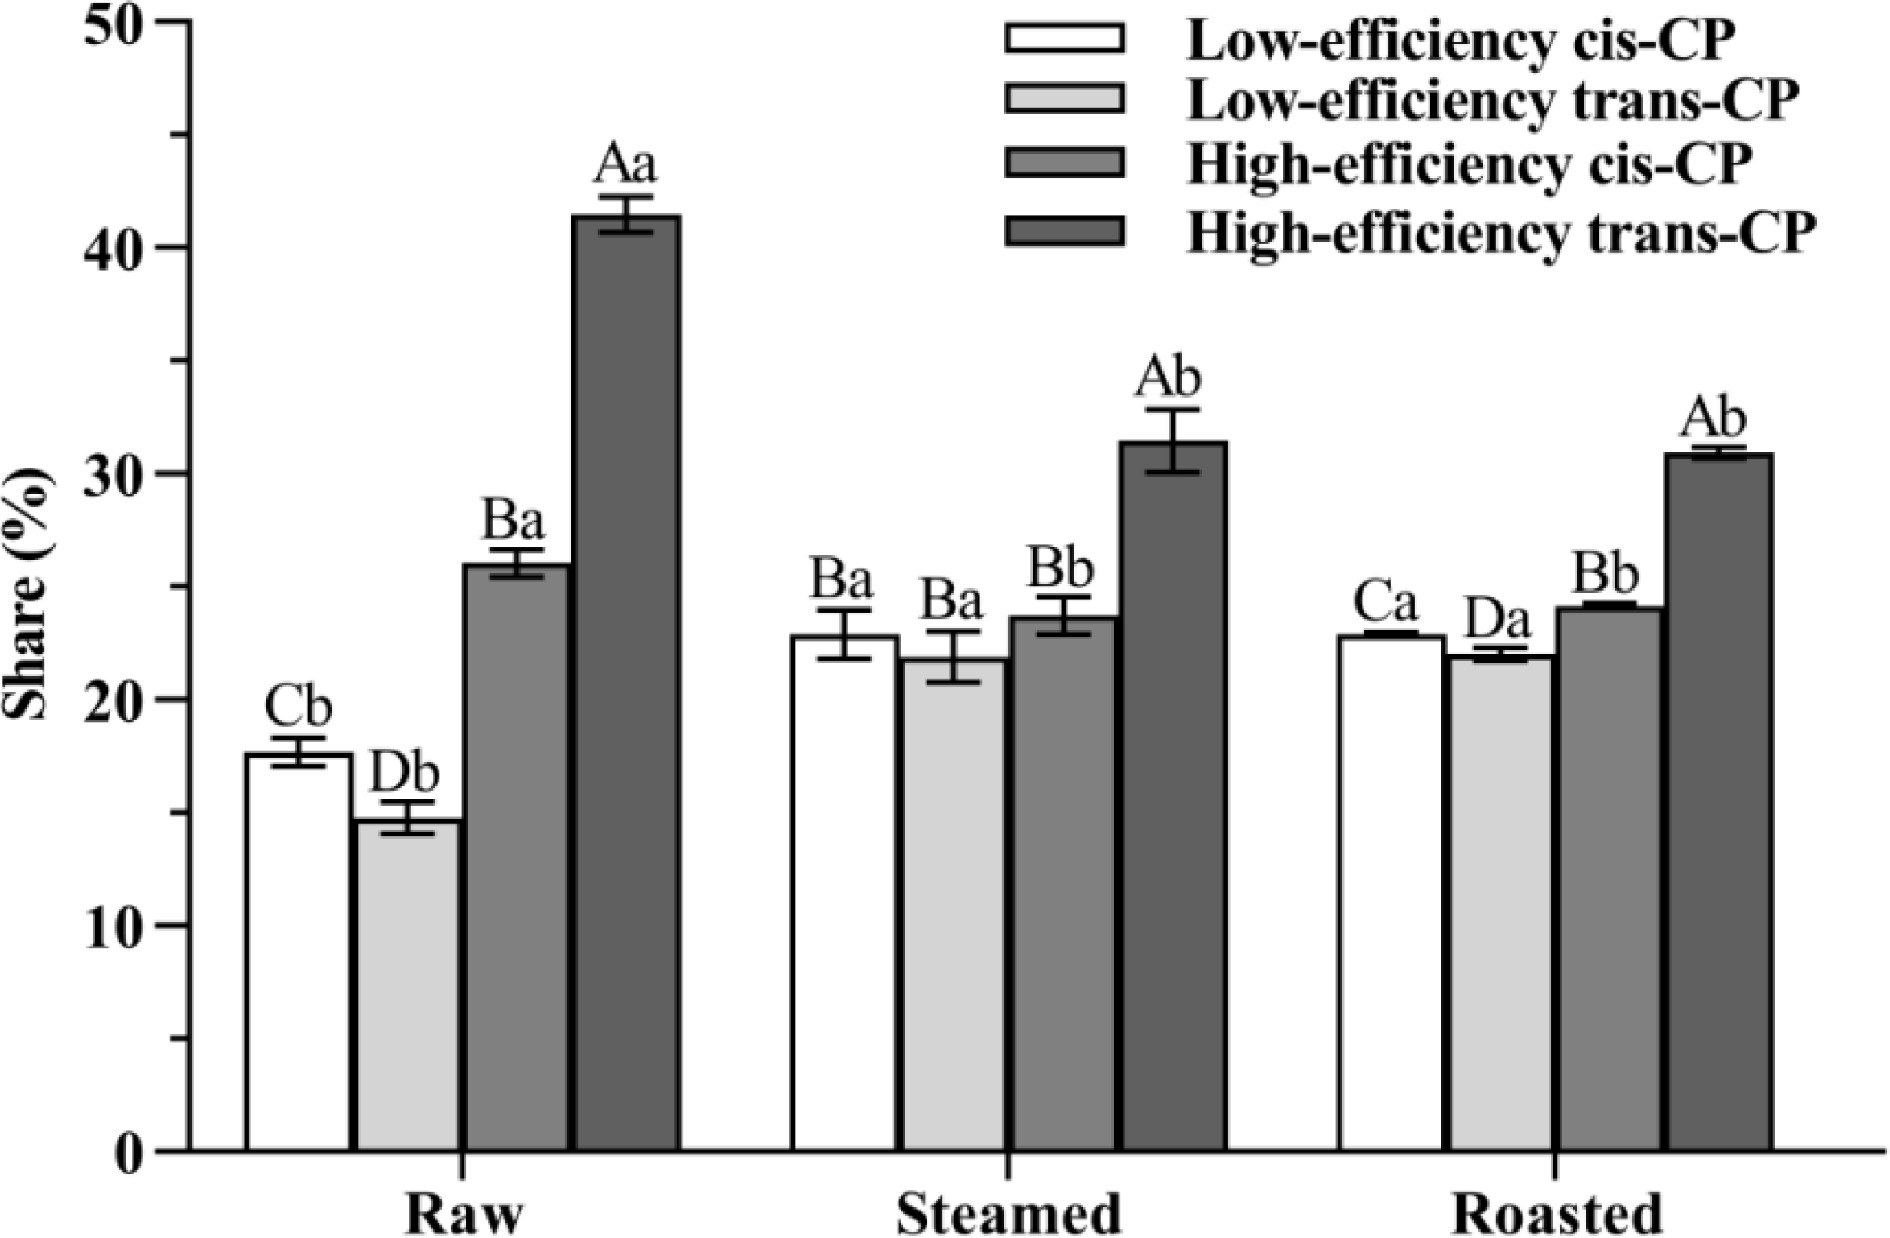
Figure 4.
The share of CP isomers is from oyster meat (raw, steamed, and roasted). Different uppercase letters represent differences in CP isomer shares from oyster meat with the same cooking methods (ANOVA, p < 0.05). Different lowercase letters represent differences in each pair of CP isomers from oyster meat with different cooking methods (ANOVA, p < 0.05).
-
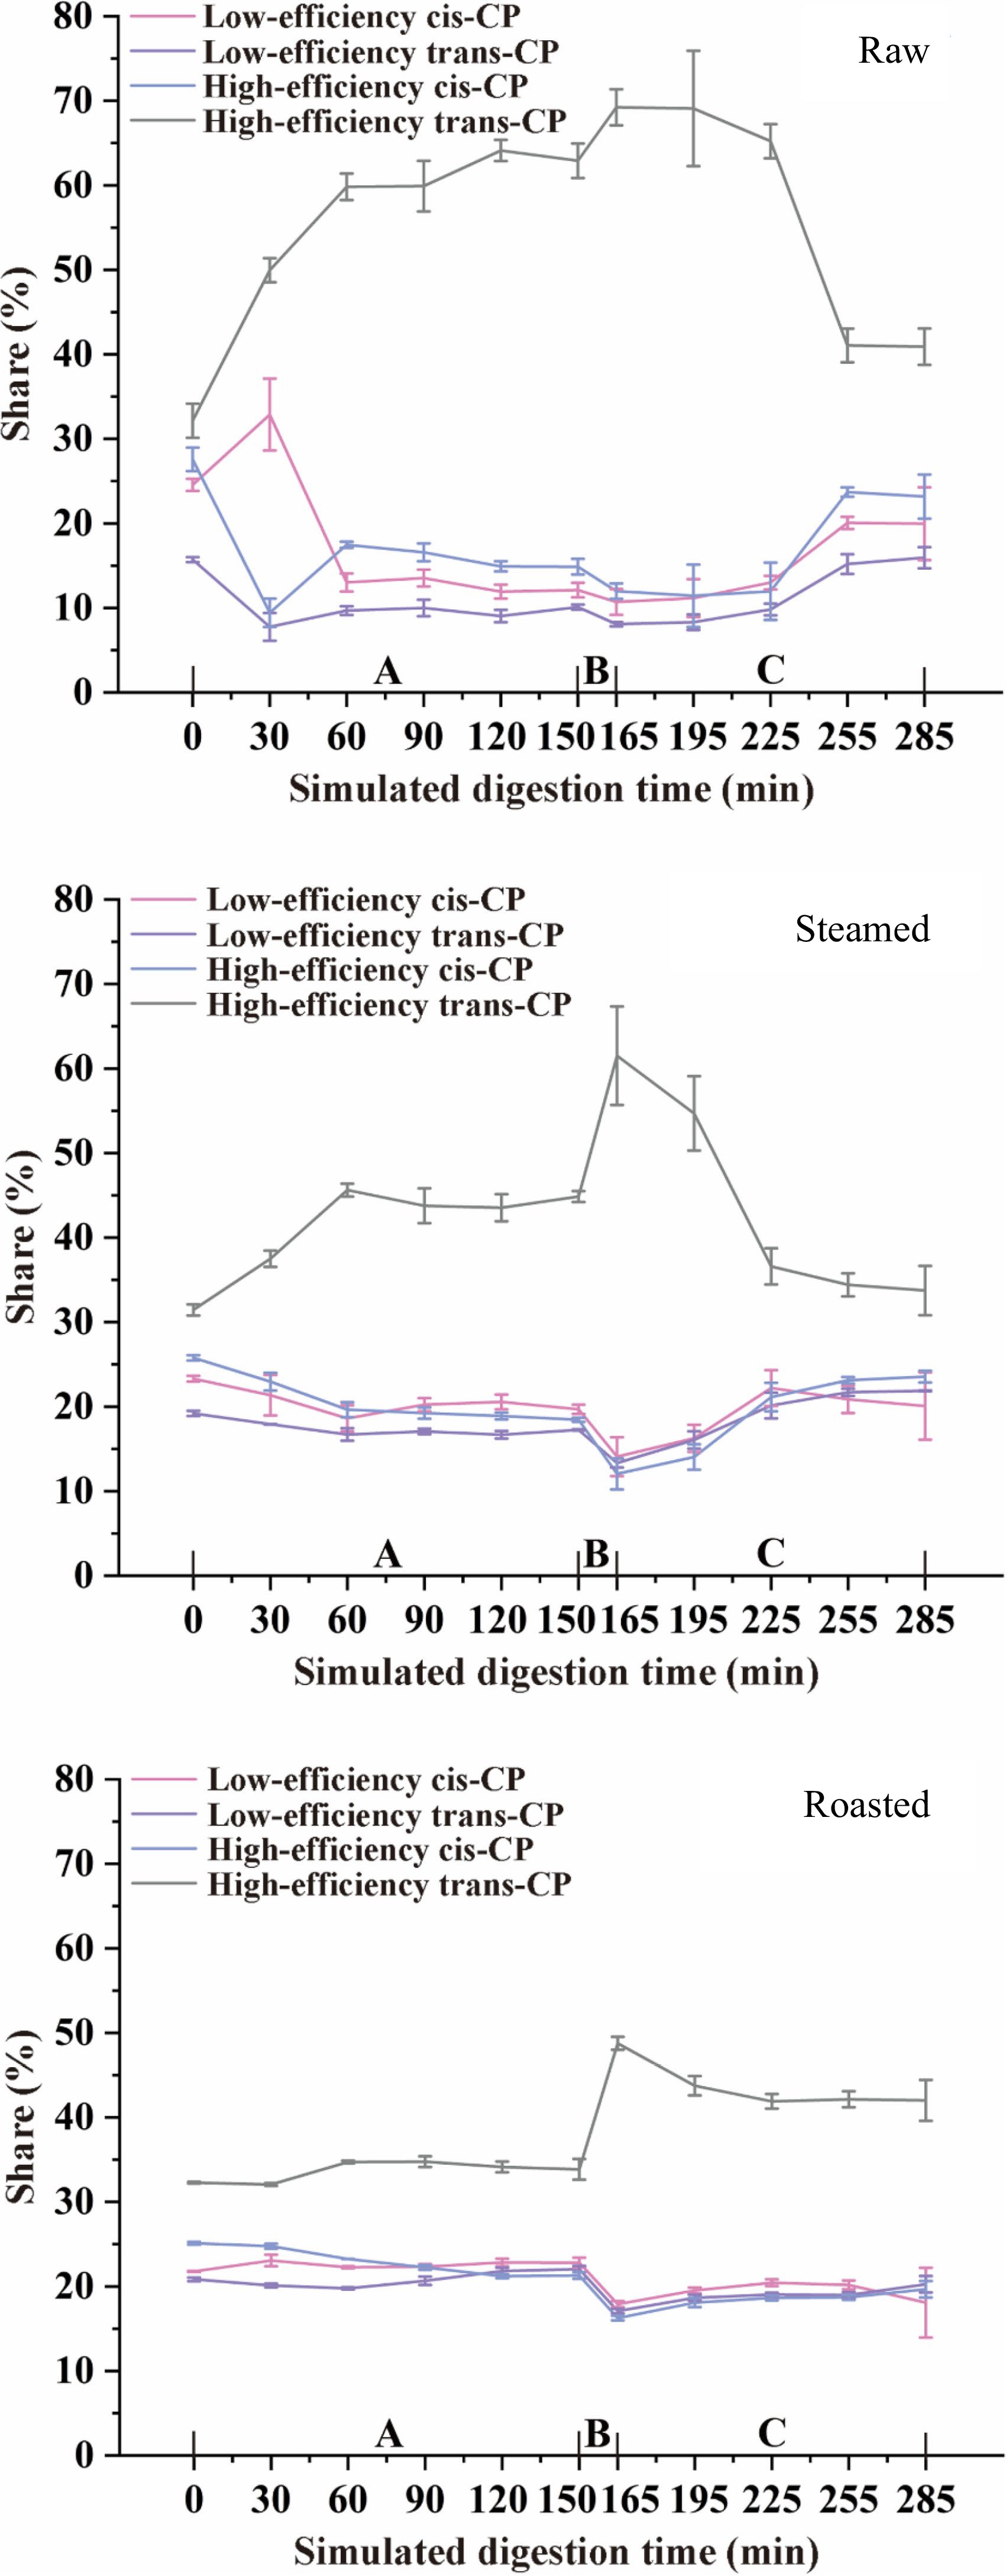
Figure 5.
CP isomers transformation during simulated digestion of raw, steamed, and roasted oysters. A, Gastric phase; B, Small intestinal buffer phase; C, Small intestinal phase.
-
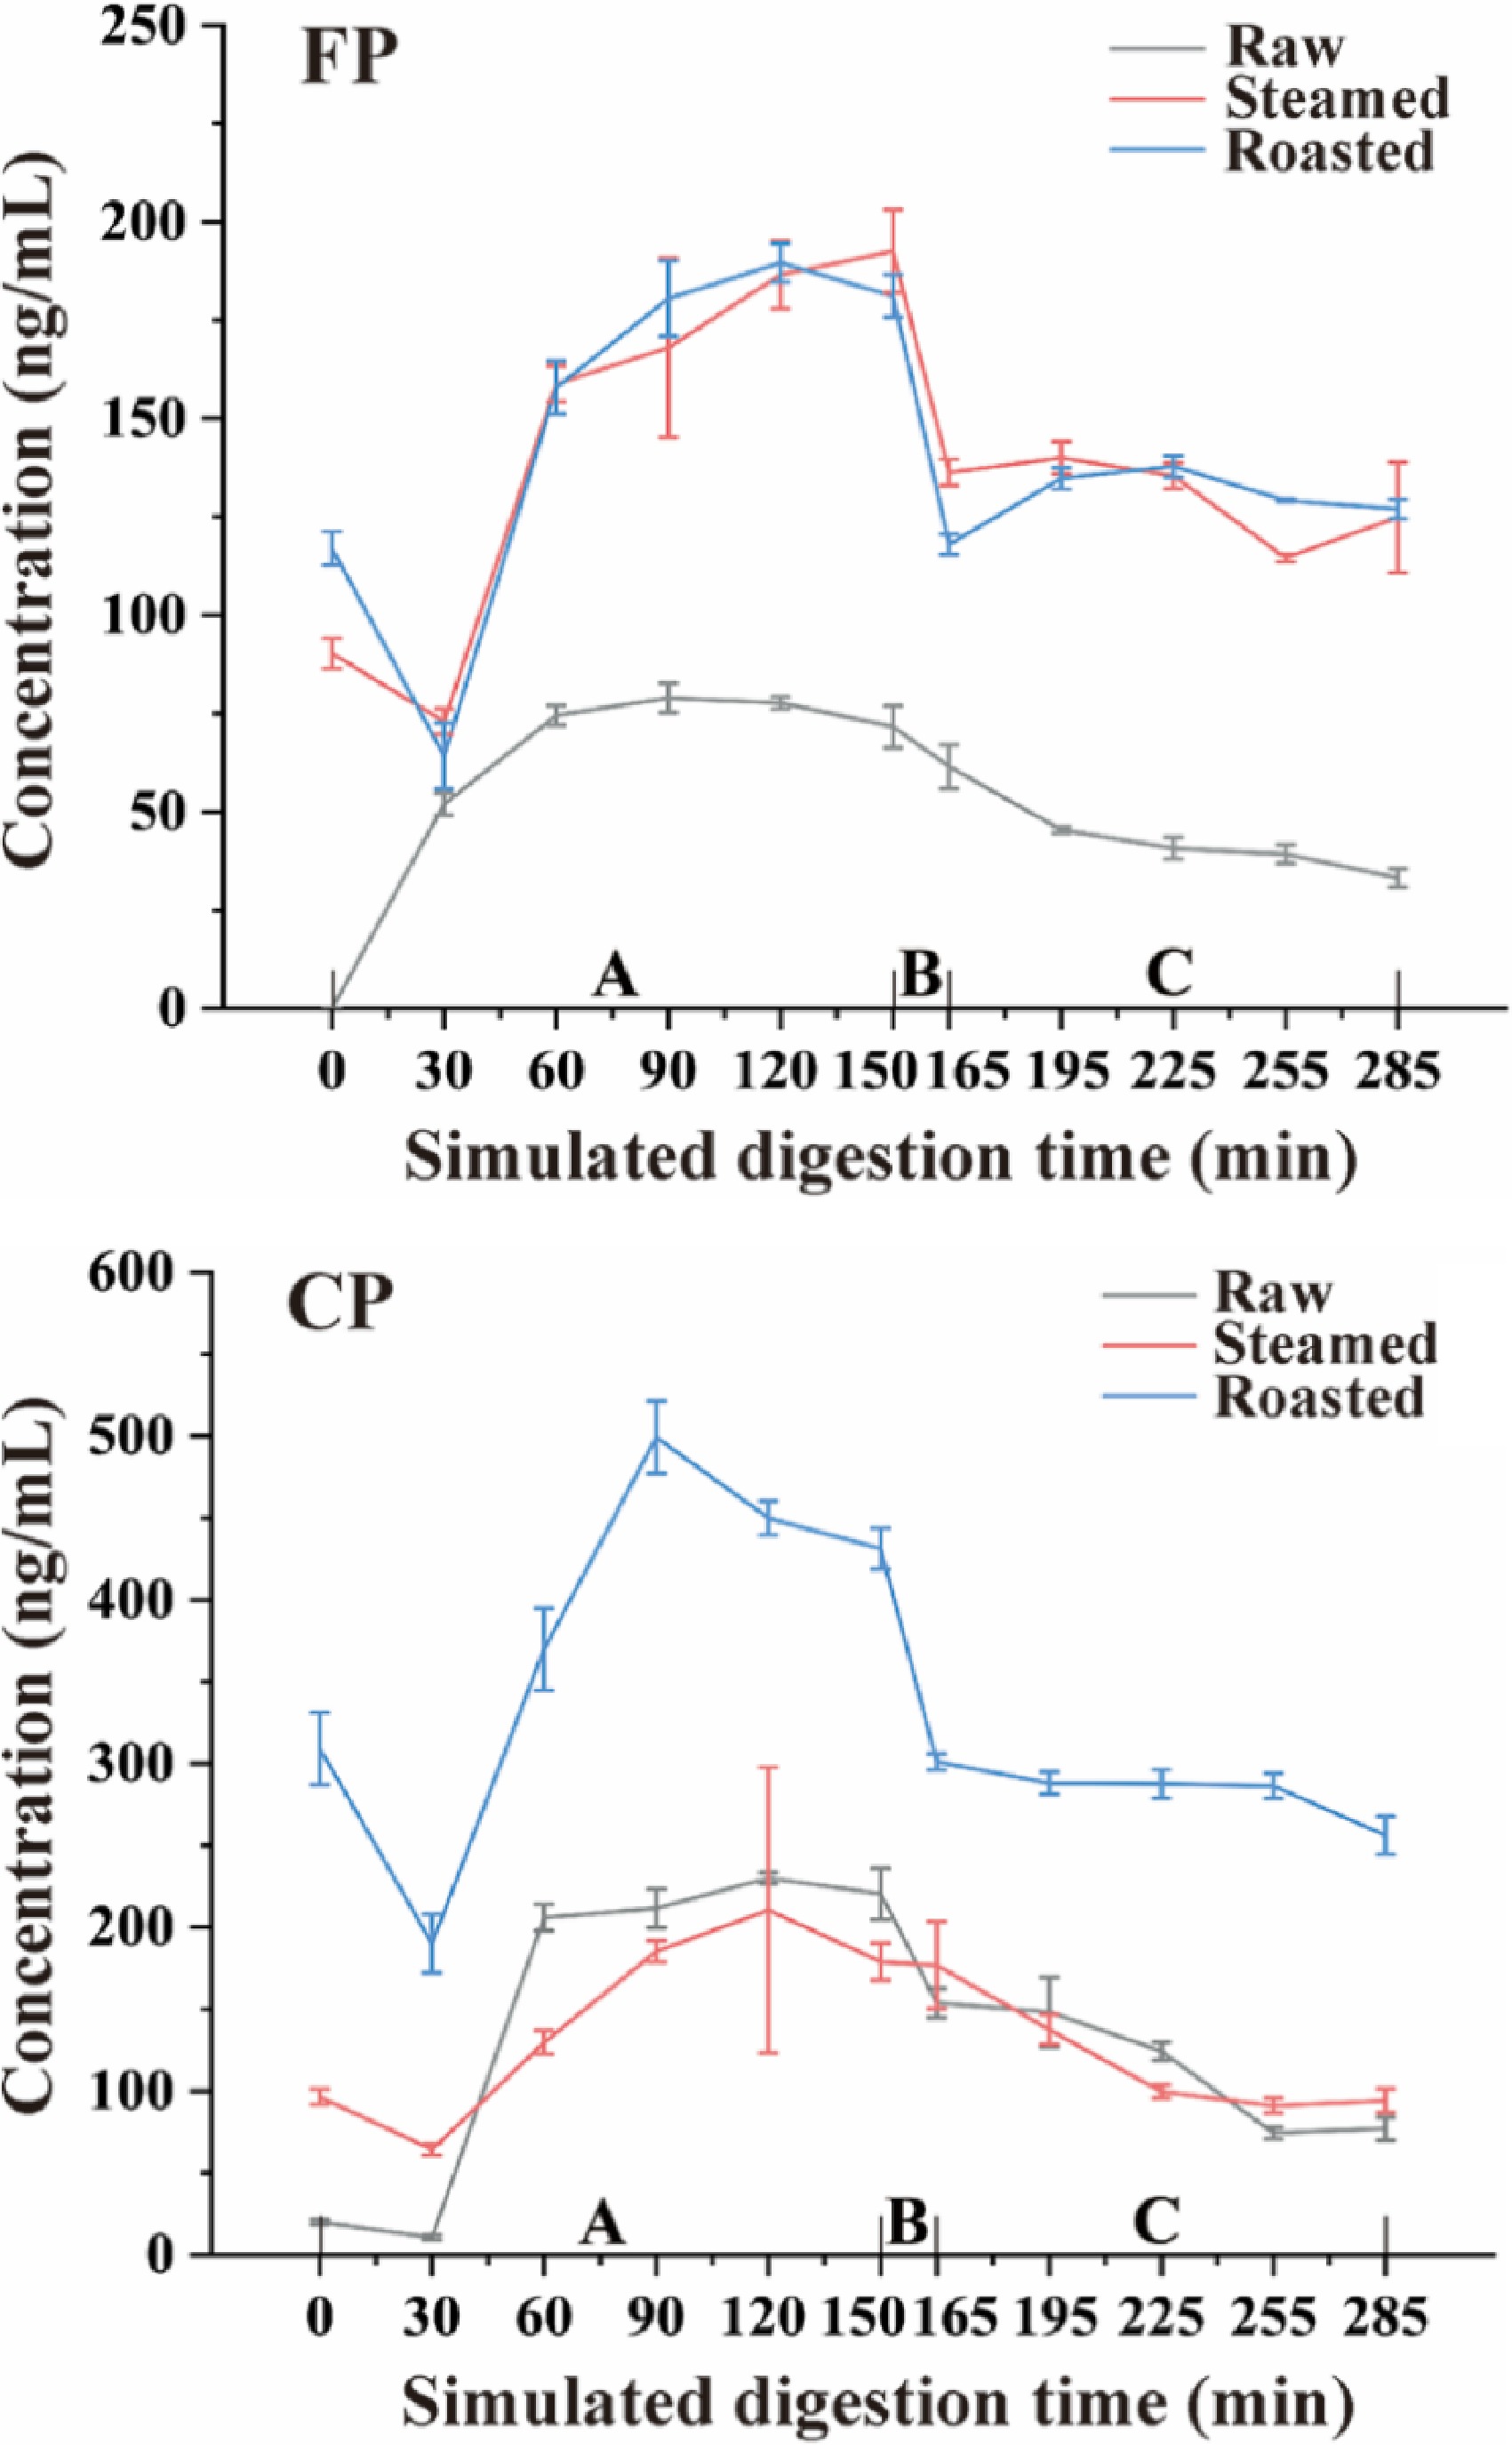
Figure 6.
CP and FP concentration change tendency during simulated digestion after different cooking methods (steamed and roasted). Raw was uncooked. A, Gastric phase; B, Small intestinal buffer phase; C, Small intestinal phase.
-
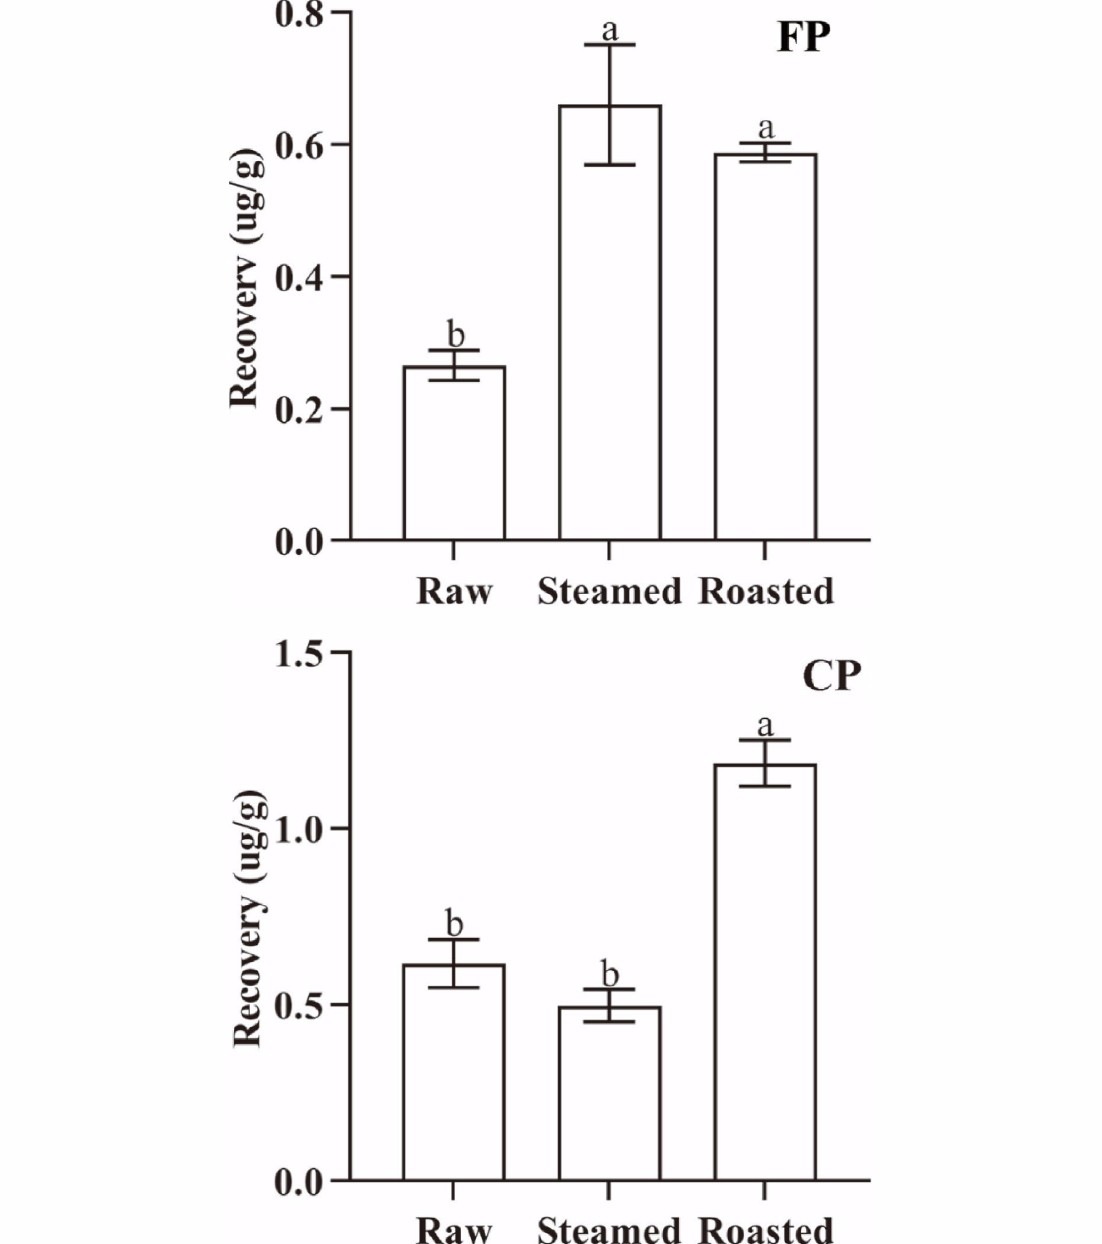
Figure 7.
The amount of released FP and CP from 1 g oyster meat at the end of simulated digestion with different cooking methods (steamed and roasted). Raw was uncooked. (Same lowercase letters (a-b) indicate no significant (ANOVA, p > 0.05) difference between the two groups of data).
-
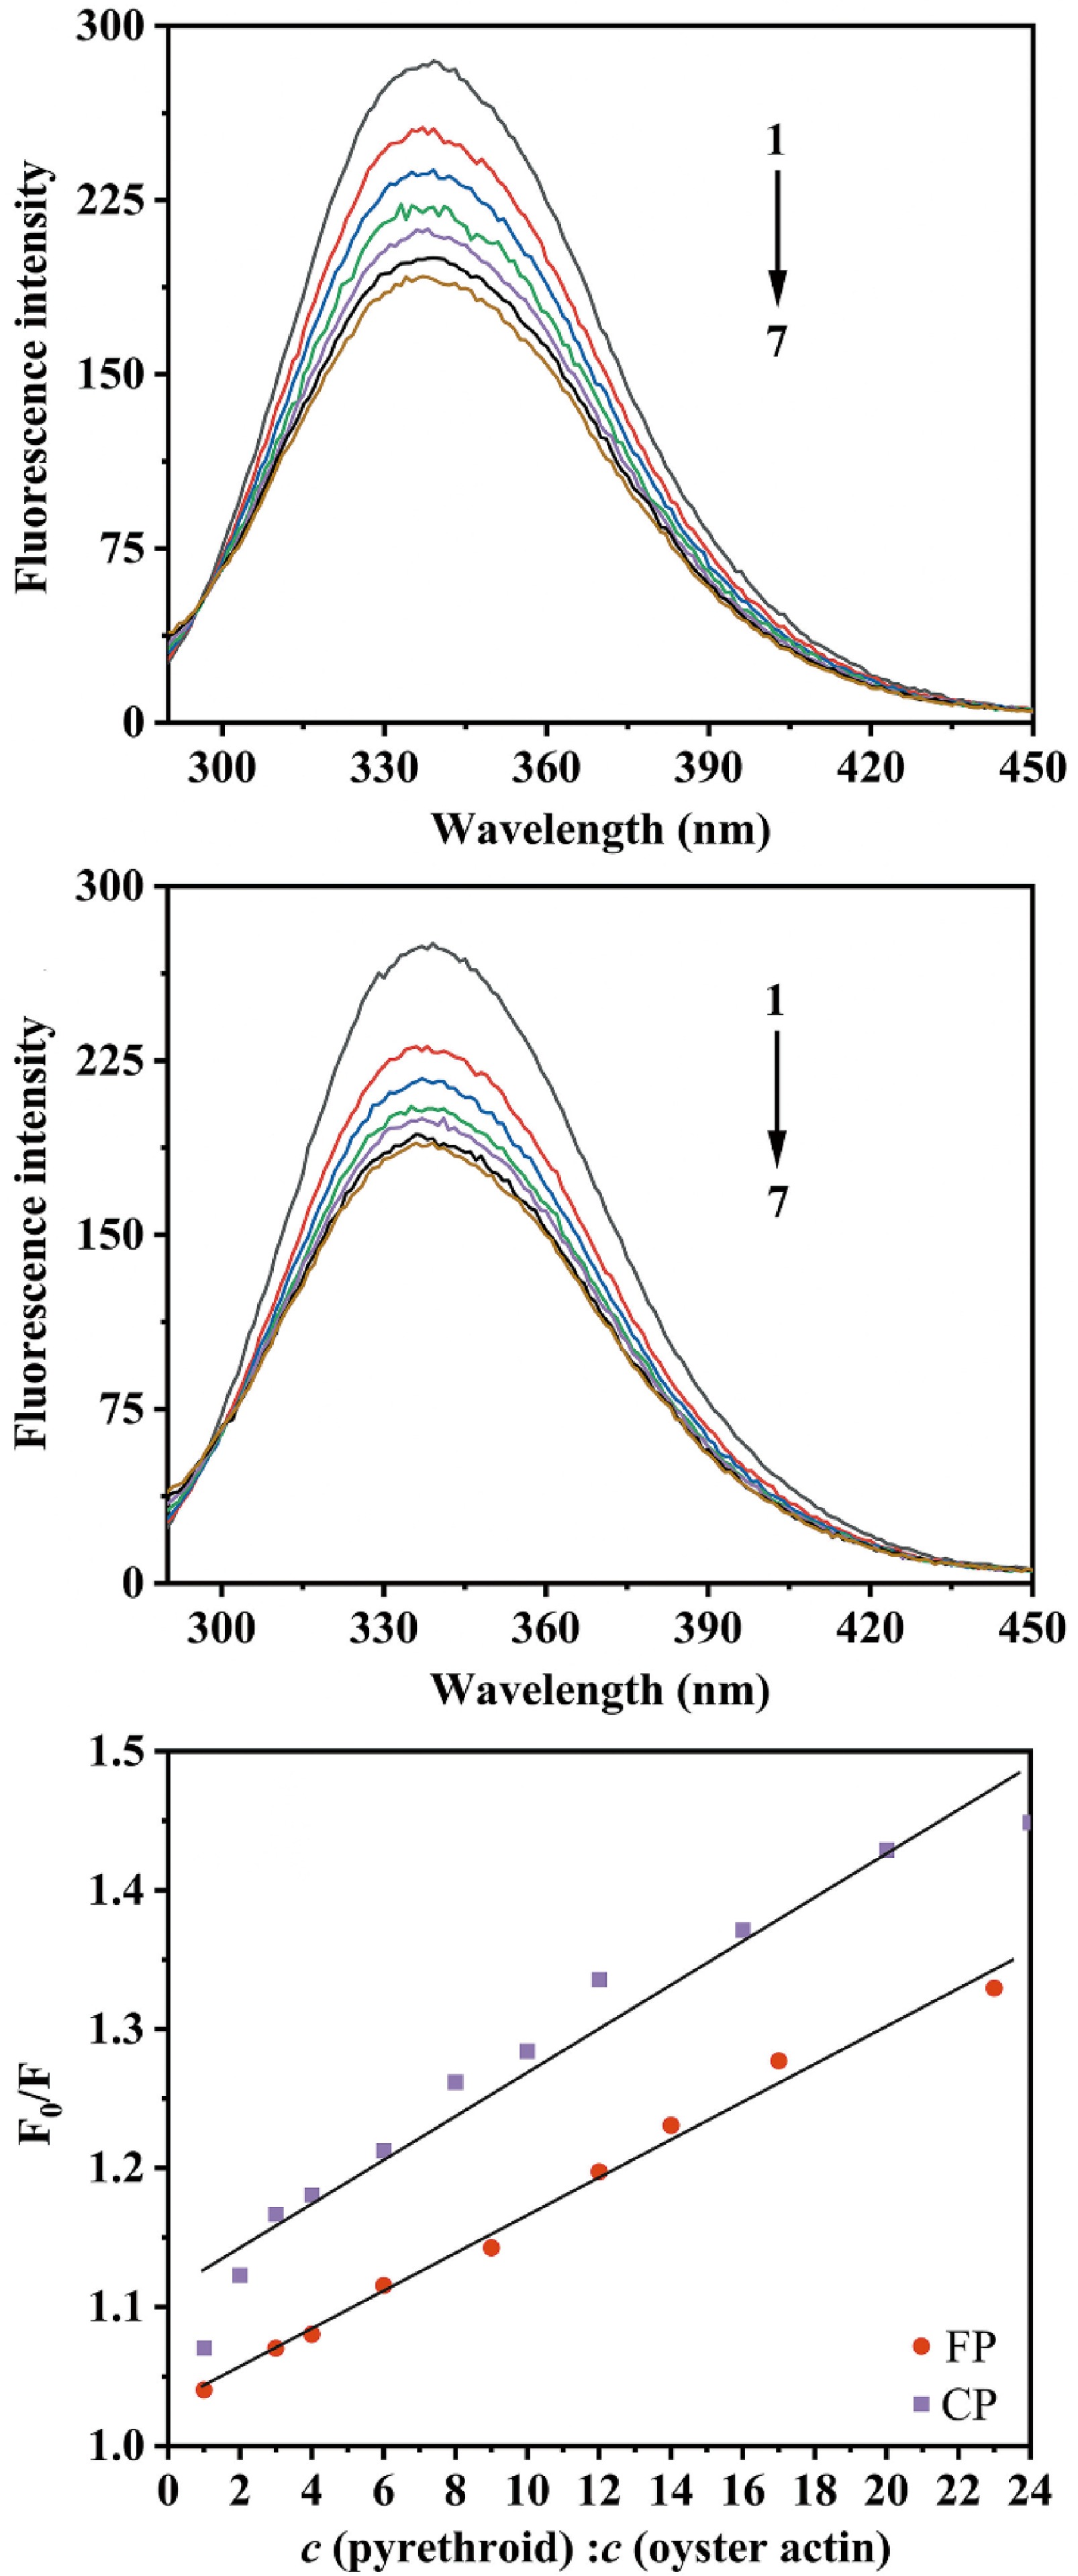
Figure 8.
(a) The fluorescence quenching spectra of oyster actin in the presence of FP, c (FP: oyster actin) = 0, 6:1, 12:1, 17:1, 23:1, 29:1, 35:1 for curves 1−7, respectively. (b) The fluorescence quenching spectra of oyster actin in the presence of CP, c (CP: oyster actin) = 0, 10:1, 19:1, 29:1, 39:1, 48:1, 58:1 for curves 1−7, respectively. (c) Effects of CP and FP concentrations on the fluorescence quenching of oyster actin at 338 nm, where F0 is the fluorescence intensities of oyster actin without CP or FP; F is the fluorescence intensities of oyster actin under the influence of CP or FP; c (pyrethroid) : c (oyster action) is the molar ratio of CP or FP to oyster actin.
-
Parameter FP CP Ka (association constant, M−1) Ka1 7.12 × 10⁴ 1.09 × 10⁷ Ka2 2.84 × 10⁴ 8.20 × 10⁵ n (binding stoichiometry) n1 7.83 3.43 n2 10.00 12.41 ΔH (binding enthalpy, J·mol−1) ΔH1 2.00 × 10⁵ 7.17 × 10⁴ ΔH2 2.00 × 10⁵ 2.57 × 10⁴ ΔS (entropy, J·mol−1·K−1) ΔS1 7.64 × 10² 3.75 × 10² ΔS2 7.56 × 10² 2.00 × 10² ΔG (Gibbs free energy, J·mol−1) ΔG1 −2.77 × 10⁴ −4.01 × 10⁴ ΔG2 −2.25 × 10⁴ −3.39 × 10⁴ Table 1.
Binding and thermodynamic parameters of oyster actin and CP or FP obtained from ITC.
Figures
(8)
Tables
(1)