-
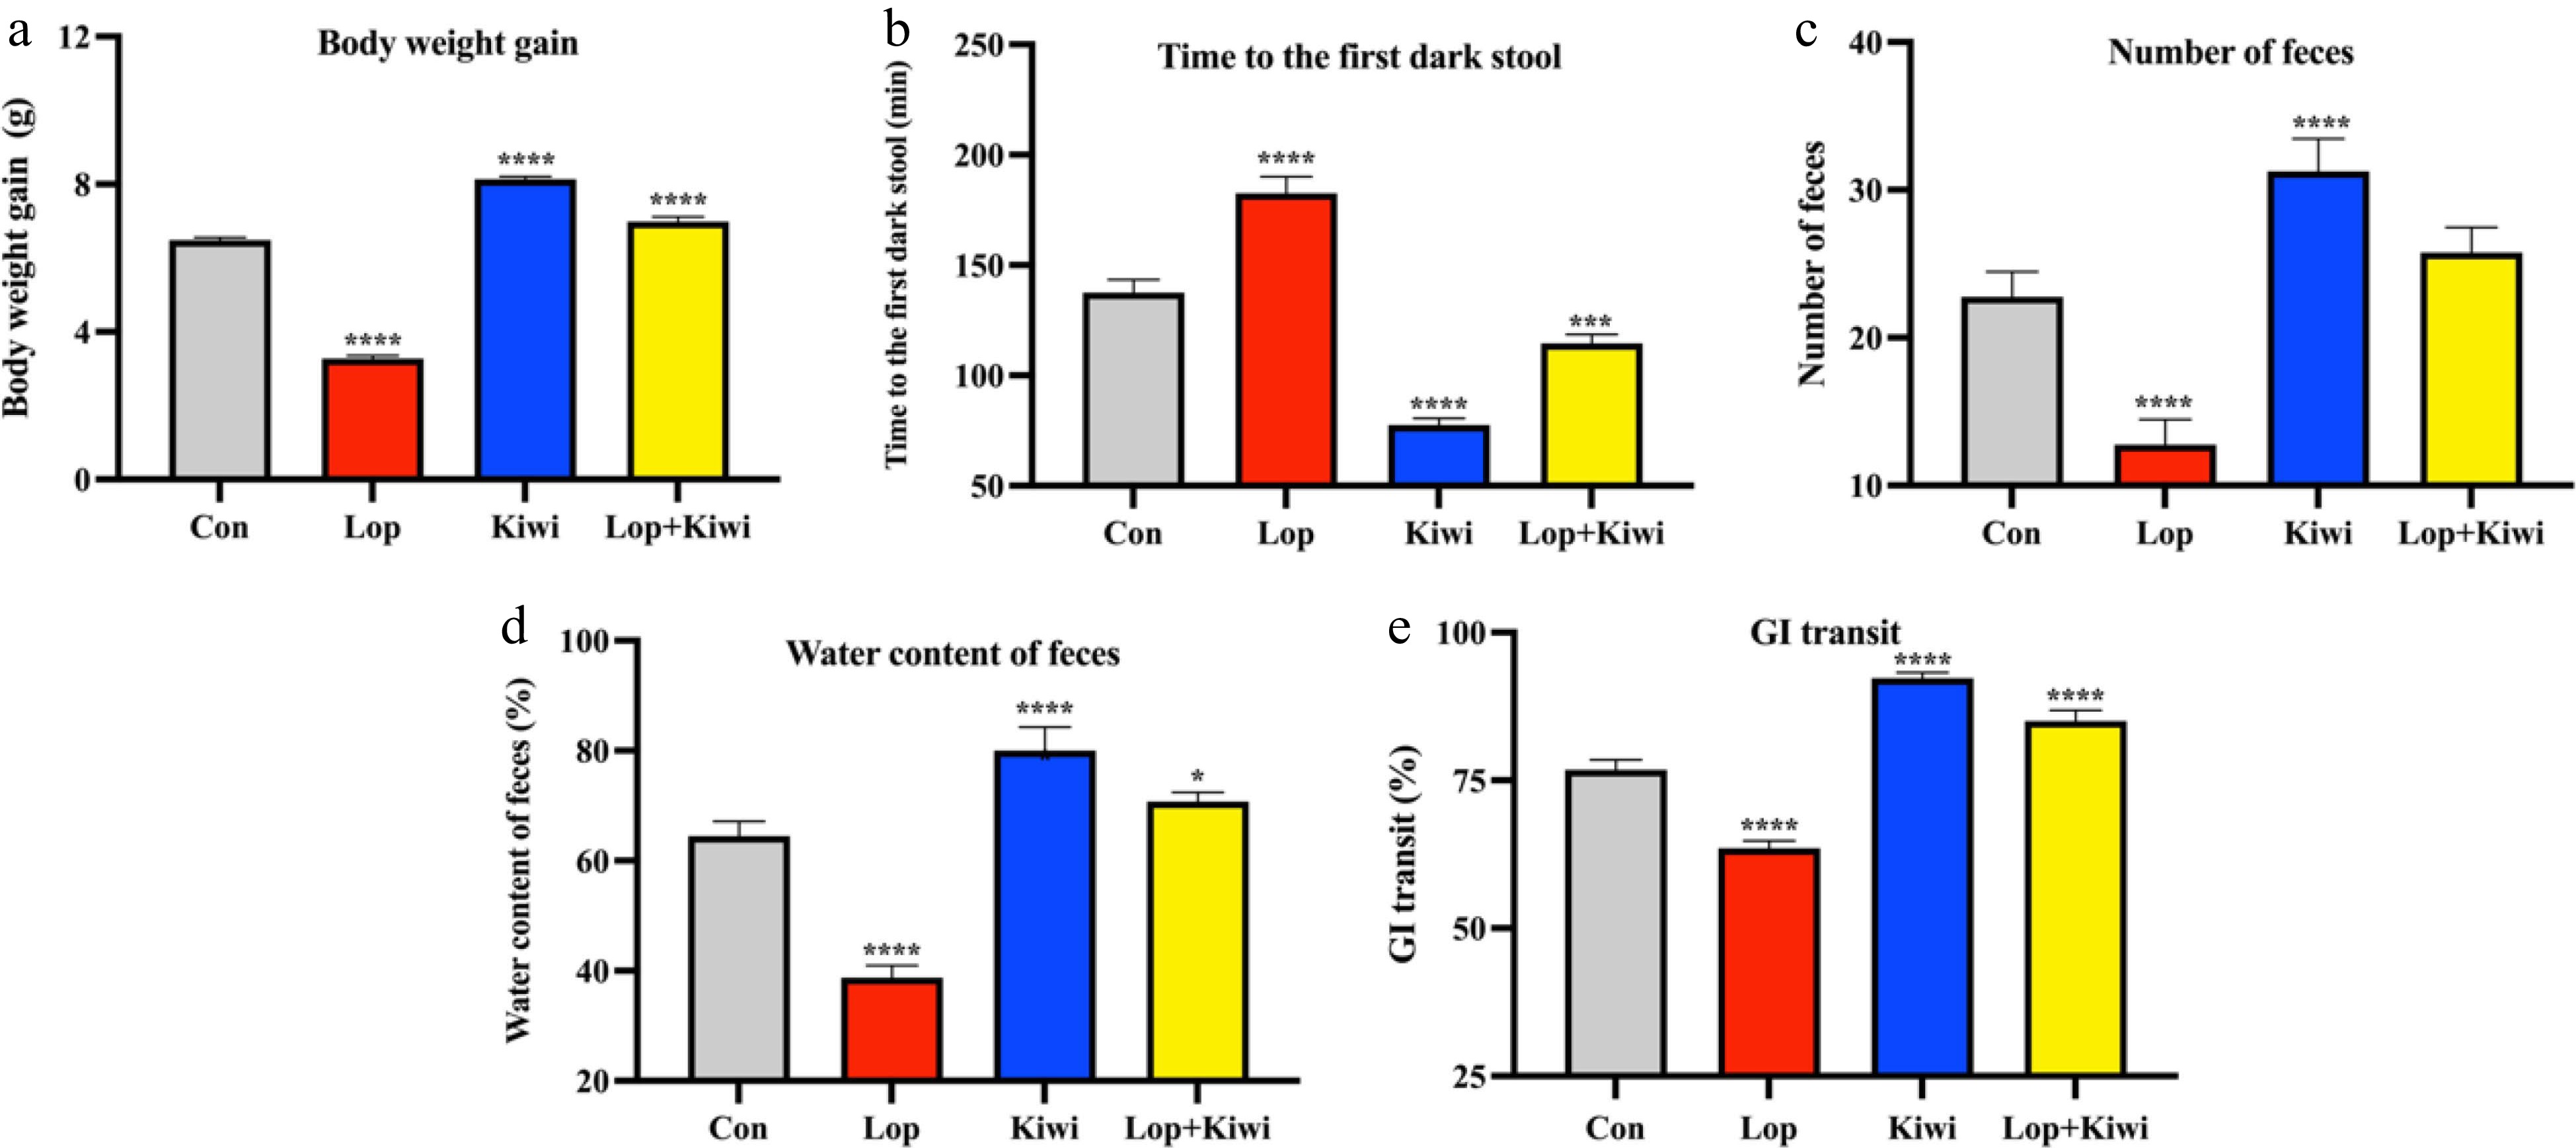
Figure 1.
Changes of constipation-related parameters by kiwi berry. (a) Body weight gain; (b) Time to the first dark stool; (c) Number of feces; (d) Water content of feces; (e) Gastrointestinal transit rate. Data were represented as mean ± SD. **** P < 0.0001, 0.0001 ≤ *** P < 0.001, 0.001 ≤ ** P < 0.01, 0.01 ≤ * P < 0.05, vs Con group.
-
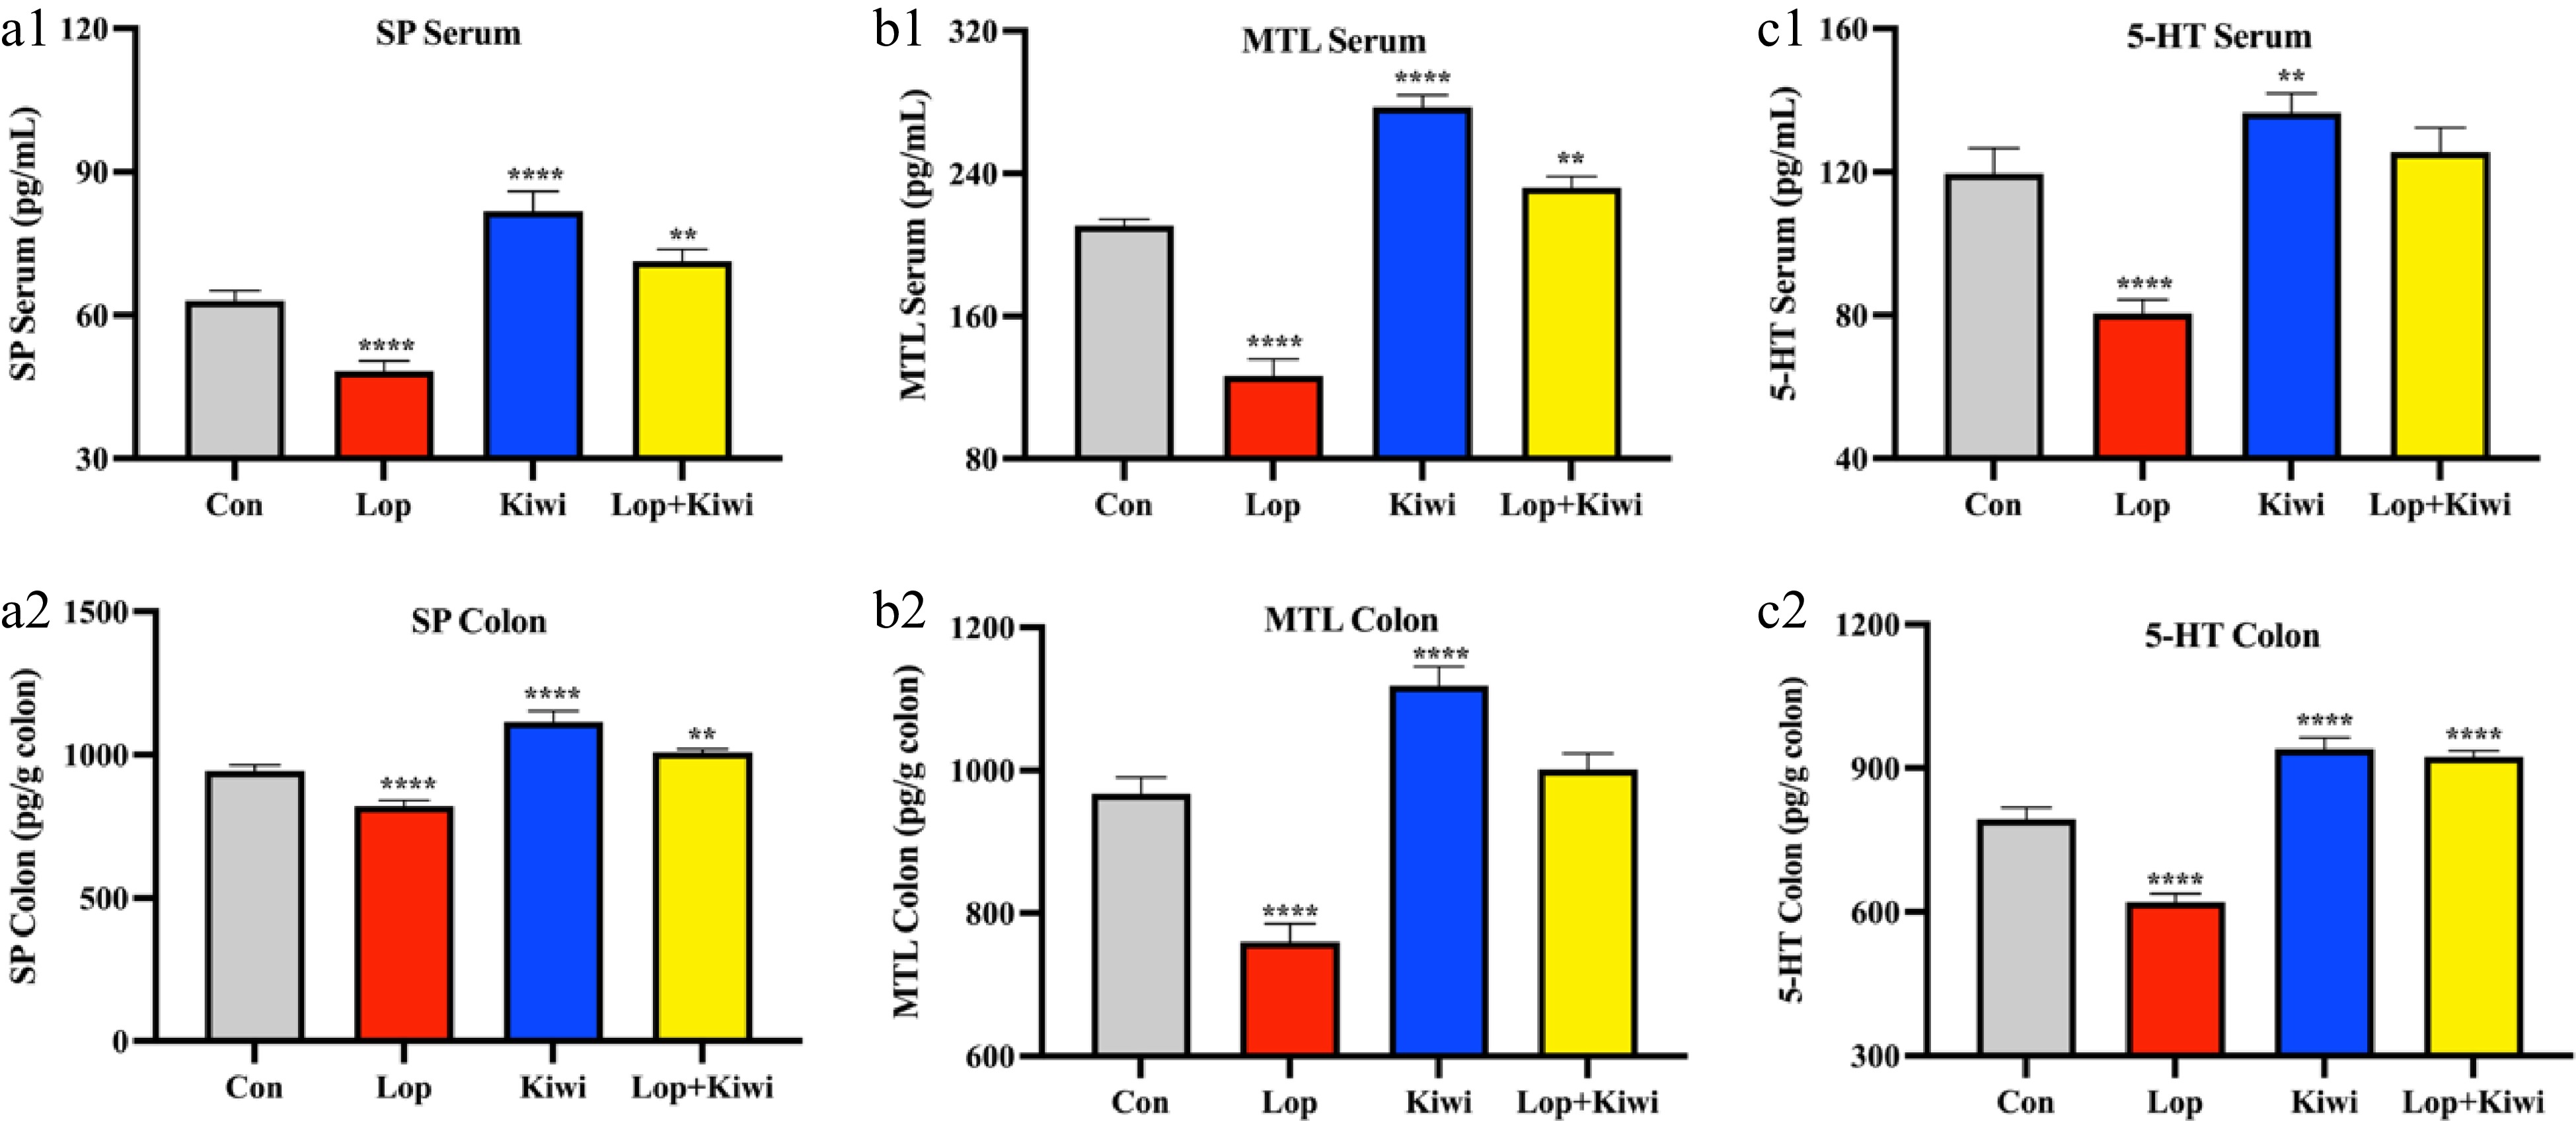
Figure 2.
Effects of kiwi berry on neurotransmitters. Levels of (a) substance P (SP), (b) motilin (MTL) and (c) 5-hydroxytryptamine (5-HT) in serum and colon tissue. Data were represented as mean ± SD. **** P < 0.0001, 0.0001 ≤ *** P < 0.001, 0.001 ≤ ** P < 0.01, 0.01 ≤ * P < 0.05, vs Con group.
-
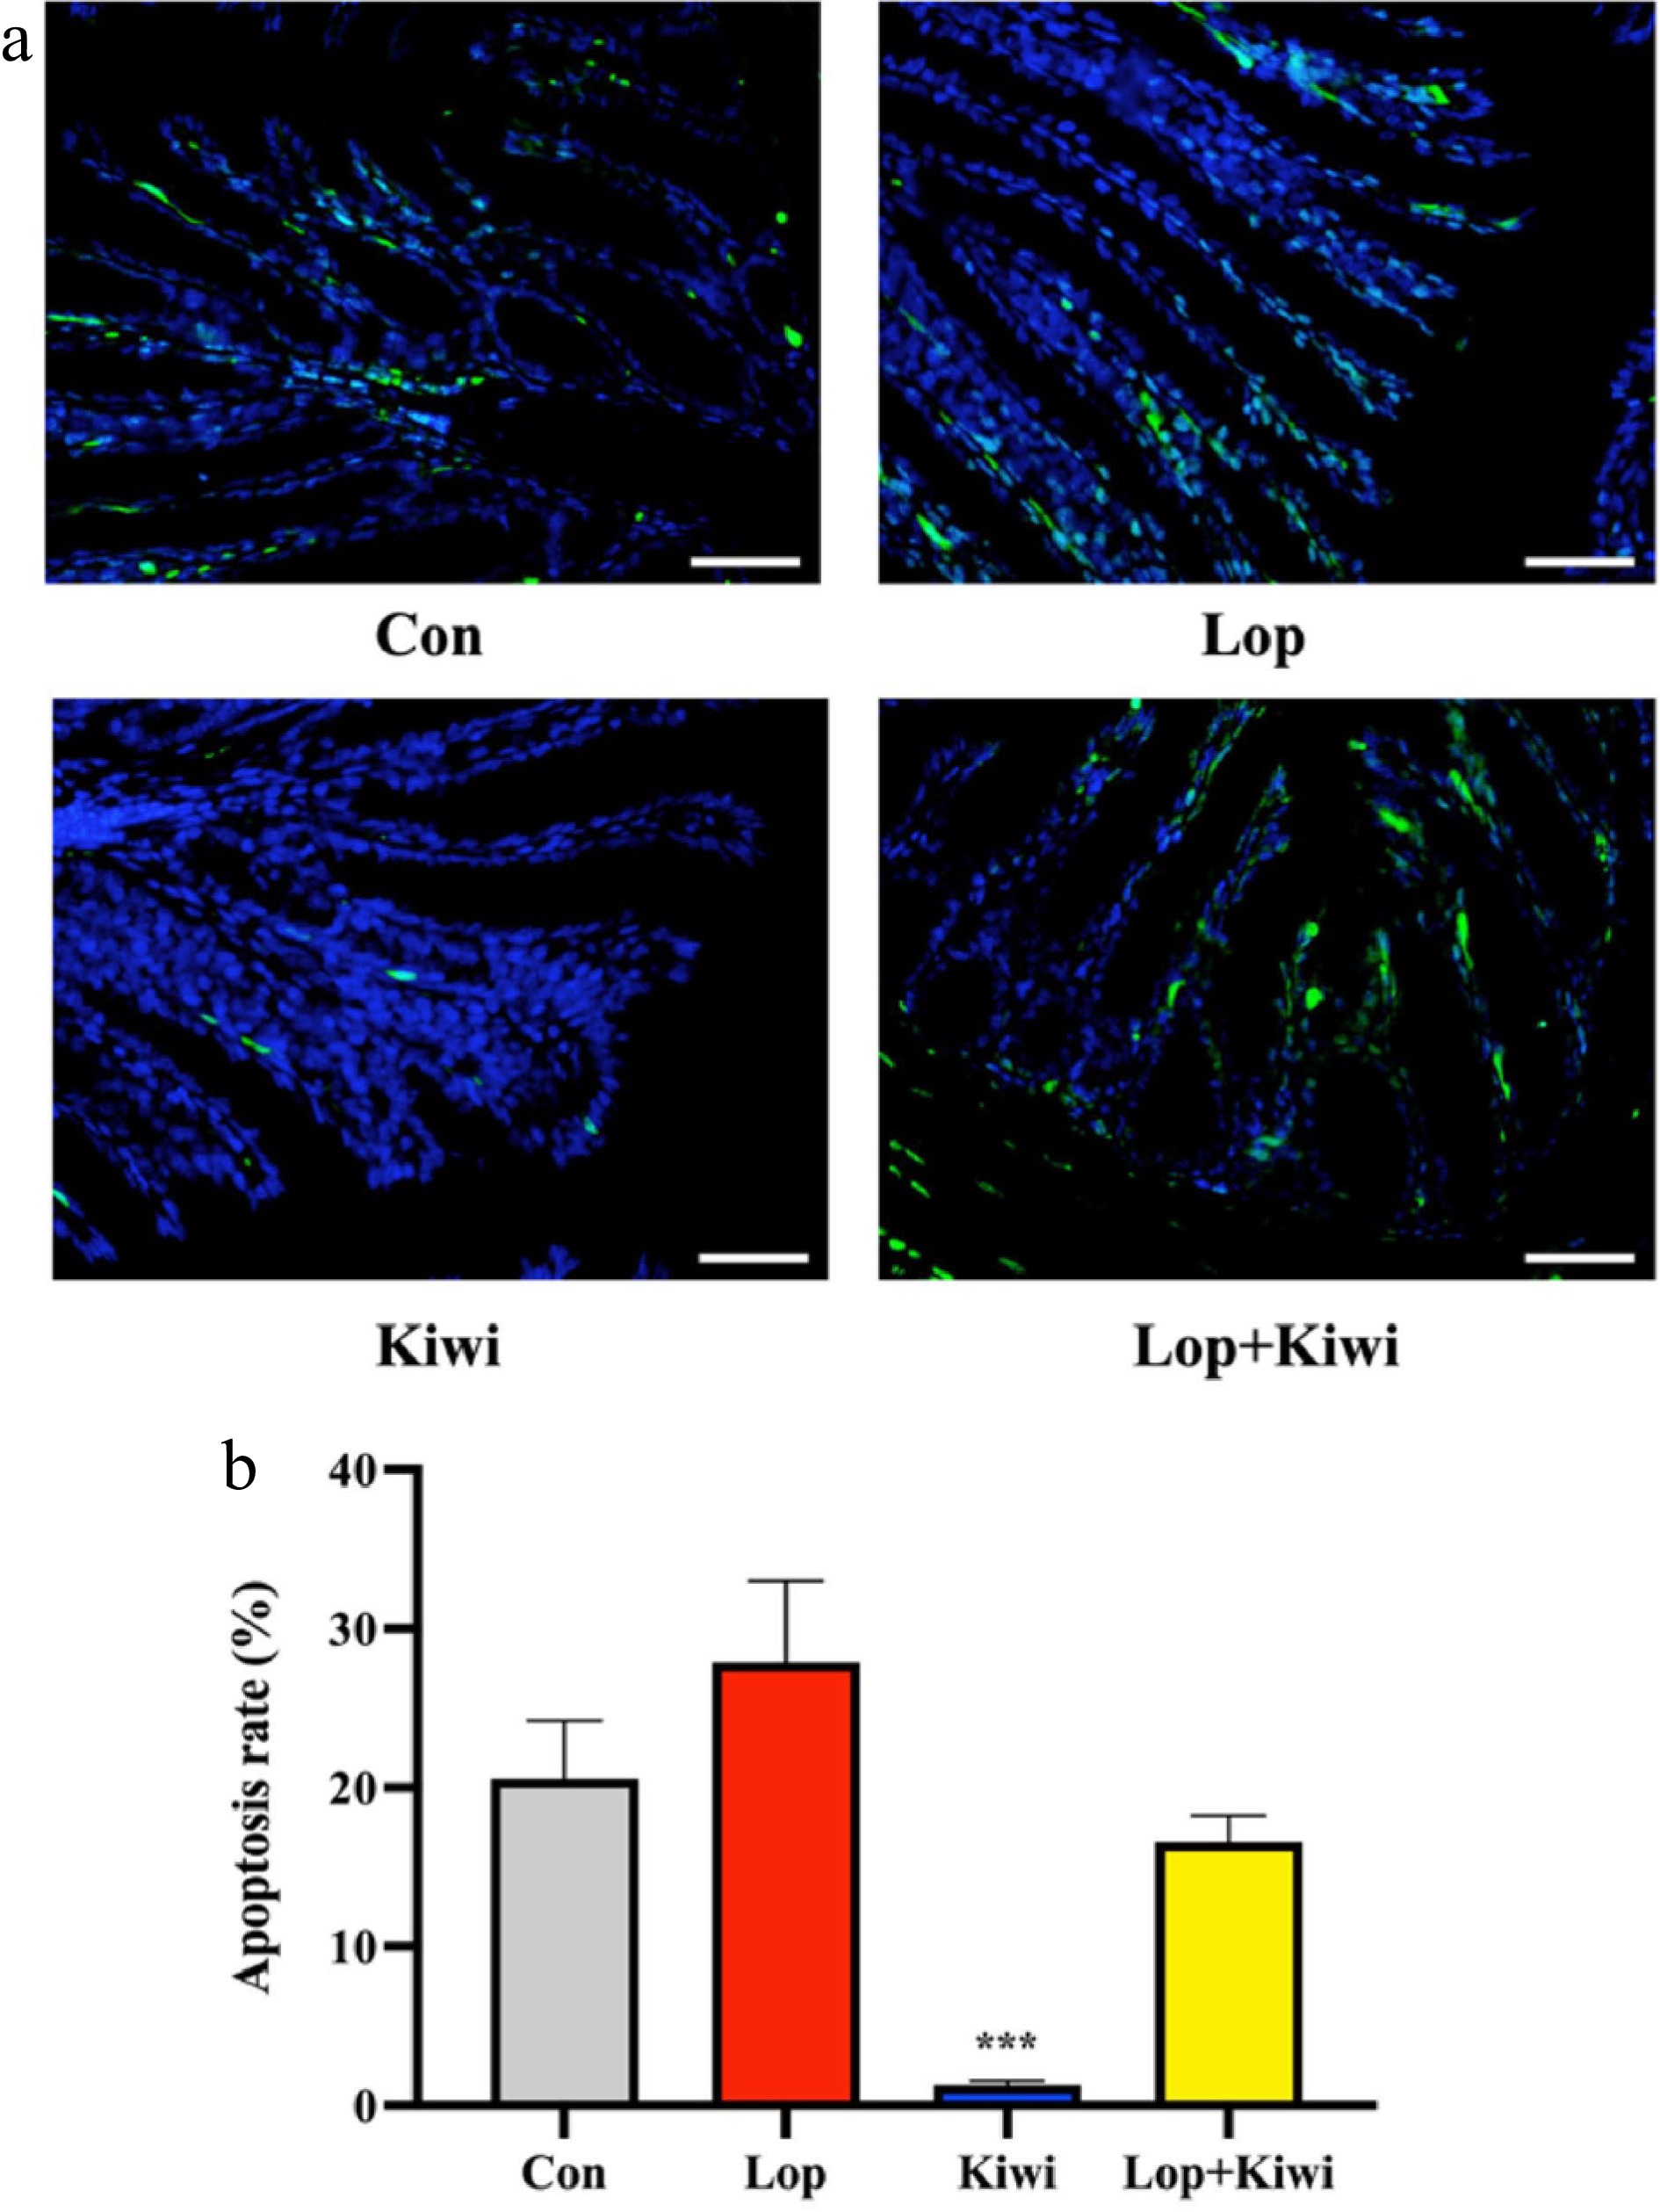
Figure 3.
Cell apoptosis in mice colon tissue. (a) Apoptotic cells showed green fluorescence (the non-apoptotic cells showed blue fluorescence, the pictures are displayed at 400× magnification, scale bar = 50 μm); (b) Apoptosis rate (%). Data were represented as mean ± SD. **** P < 0.0001, 0.0001 ≤ *** P < 0.001, 0.001 ≤ ** P < 0.01, 0.01 ≤ * P < 0.05, vs Con group.
-
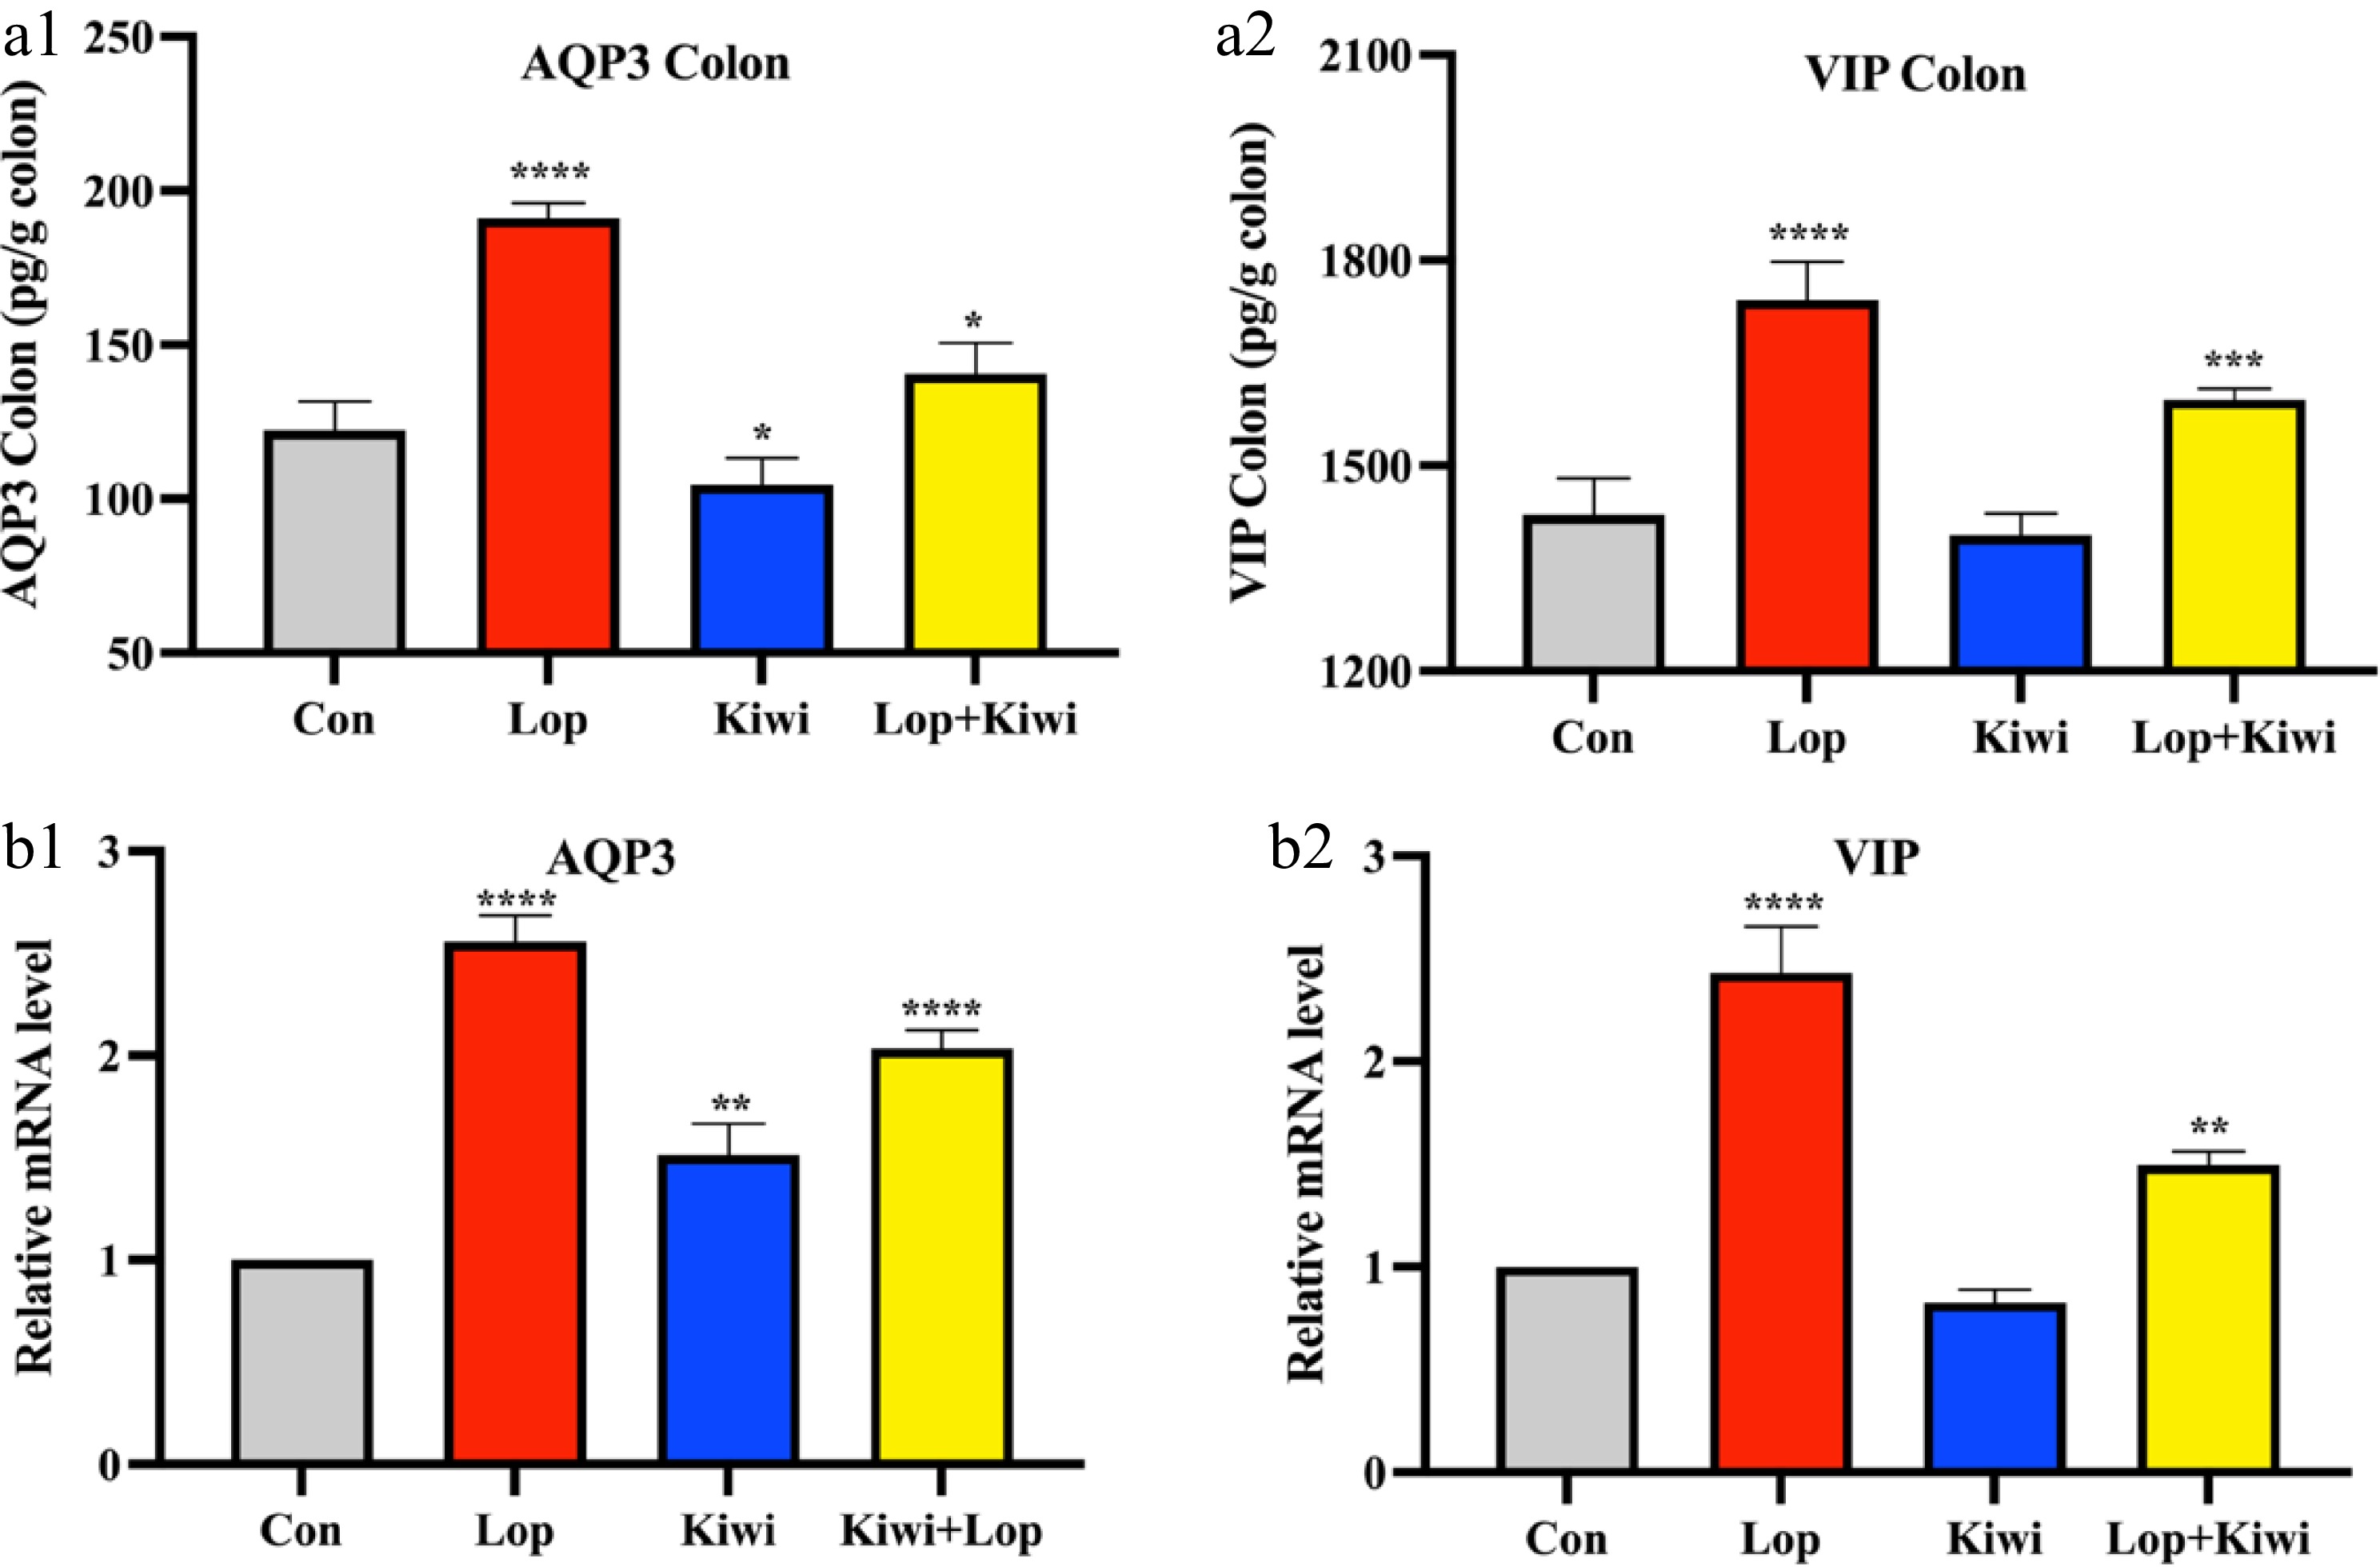
Figure 4.
Effect of kiwi berry on (a1) aquaporin-3 (AQP3) and (a2) vasoactive intestinal peptide (VIP) levels in colon tissue. Relative mRNA levels of (b1) AQP3 and (b2) VIP. Data were represented as mean ± SD. **** P < 0.0001, 0.0001 ≤ *** P < 0.001, 0.001 ≤ ** P < 0.01, 0.01 ≤ * P < 0.05, vs Con group.
-
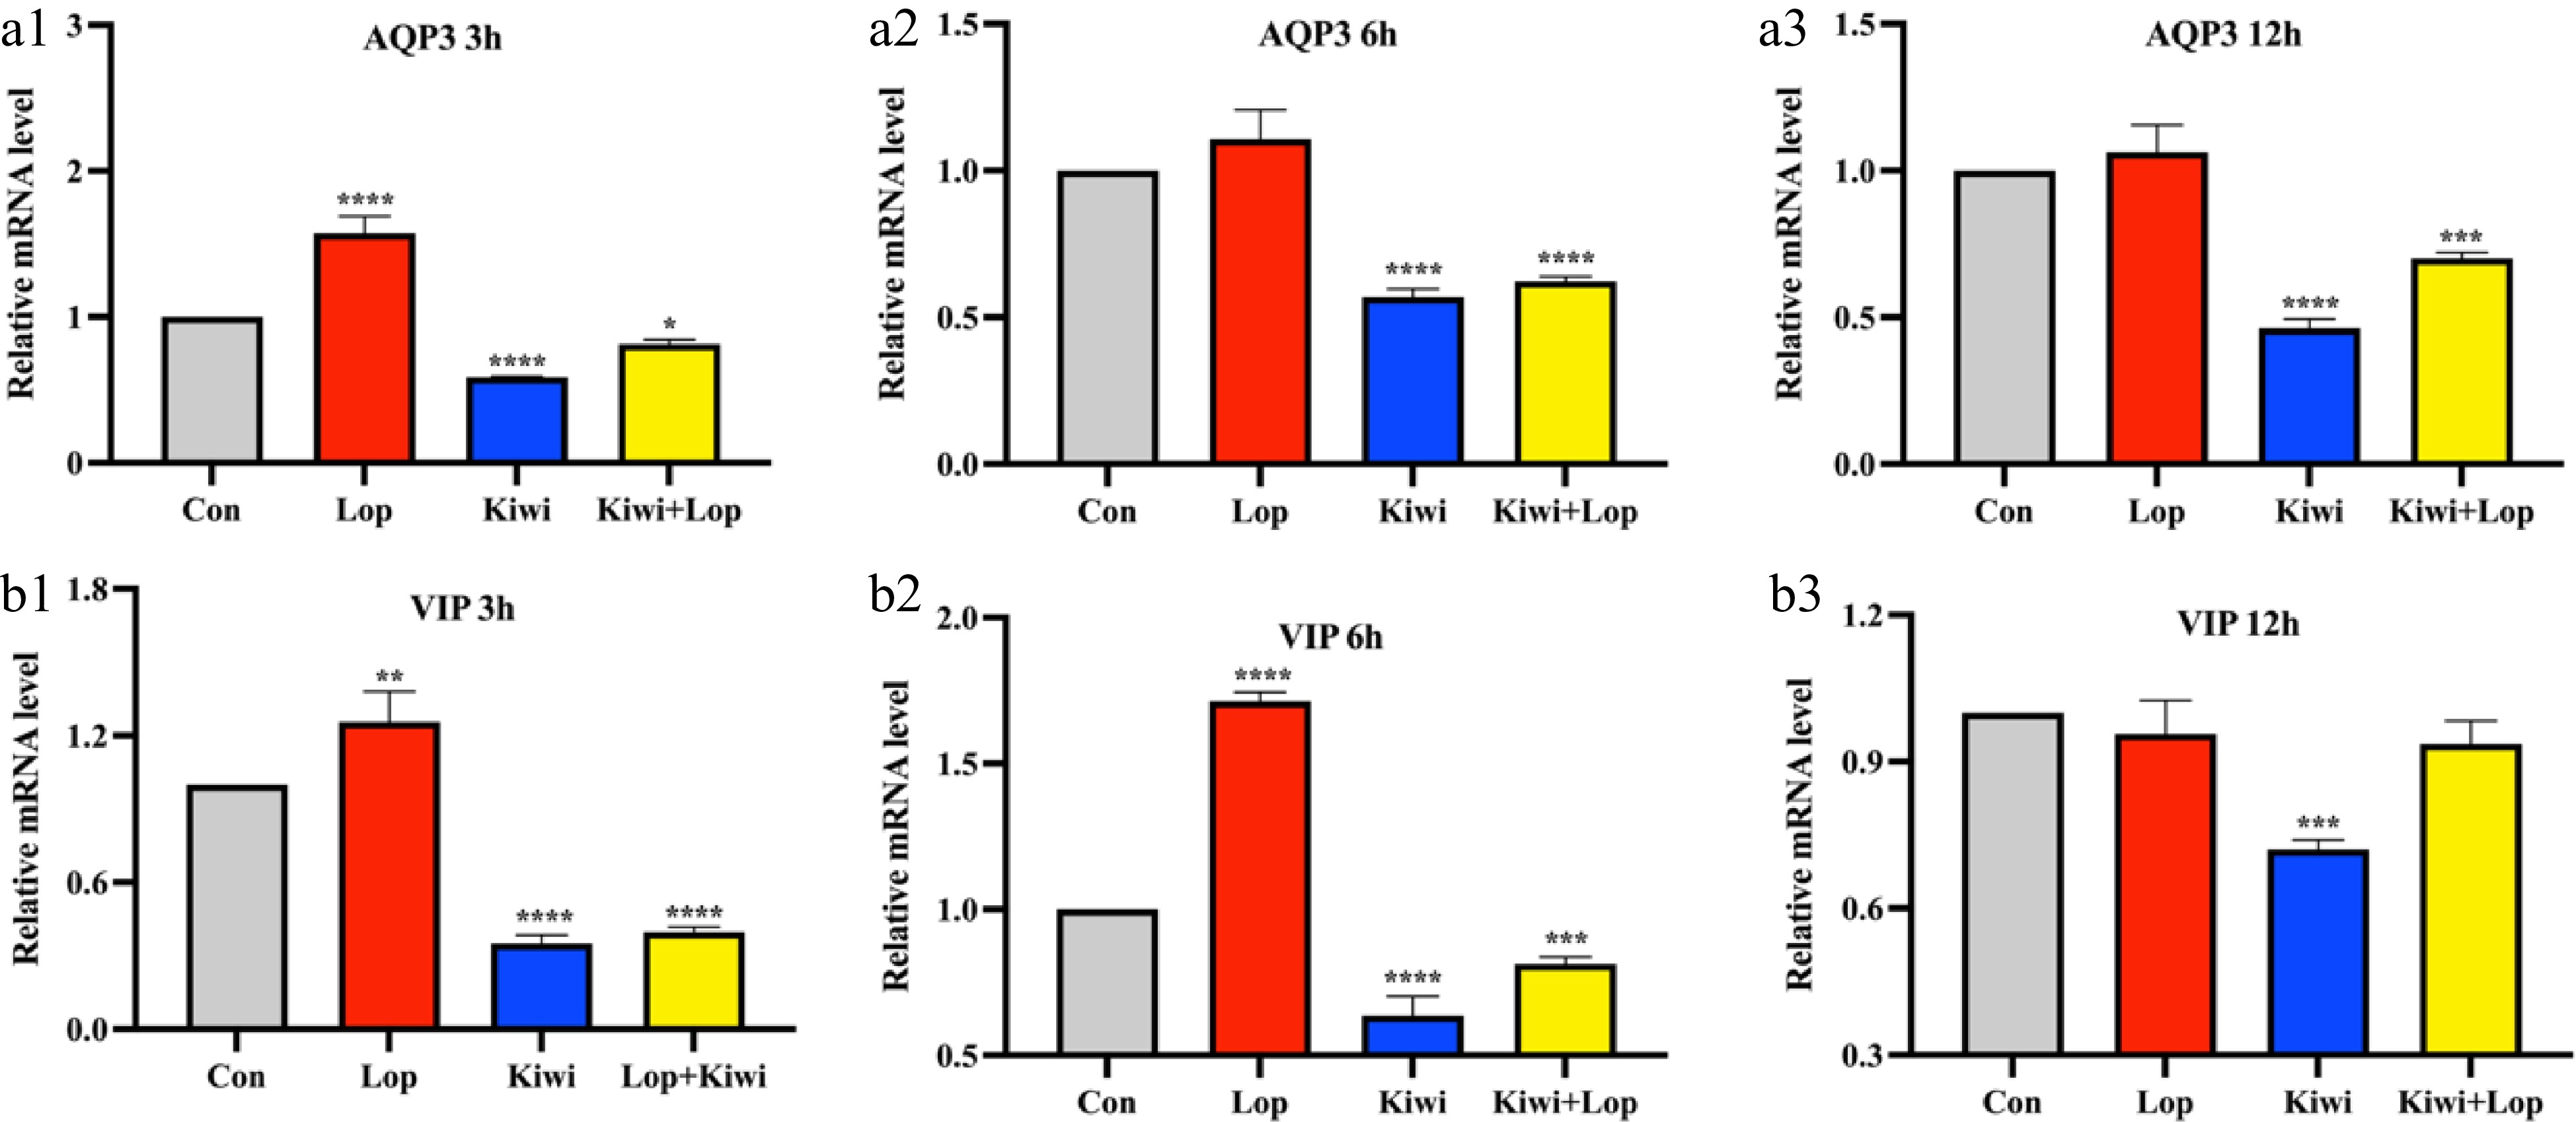
Figure 5.
Kiwi berry alleviated constipation by reducing AQP3 and VIP content. Relative mRNA level of (a) AQP3 and (b) VIP in interstitial cells of Cajal (ICC) experiments. Data were represented as mean ± SD. **** P < 0.0001, 0.0001 ≤ *** P < 0.001, 0.001 ≤ ** P < 0.01, 0.01 ≤ * P < 0.05, vs Con group.
-
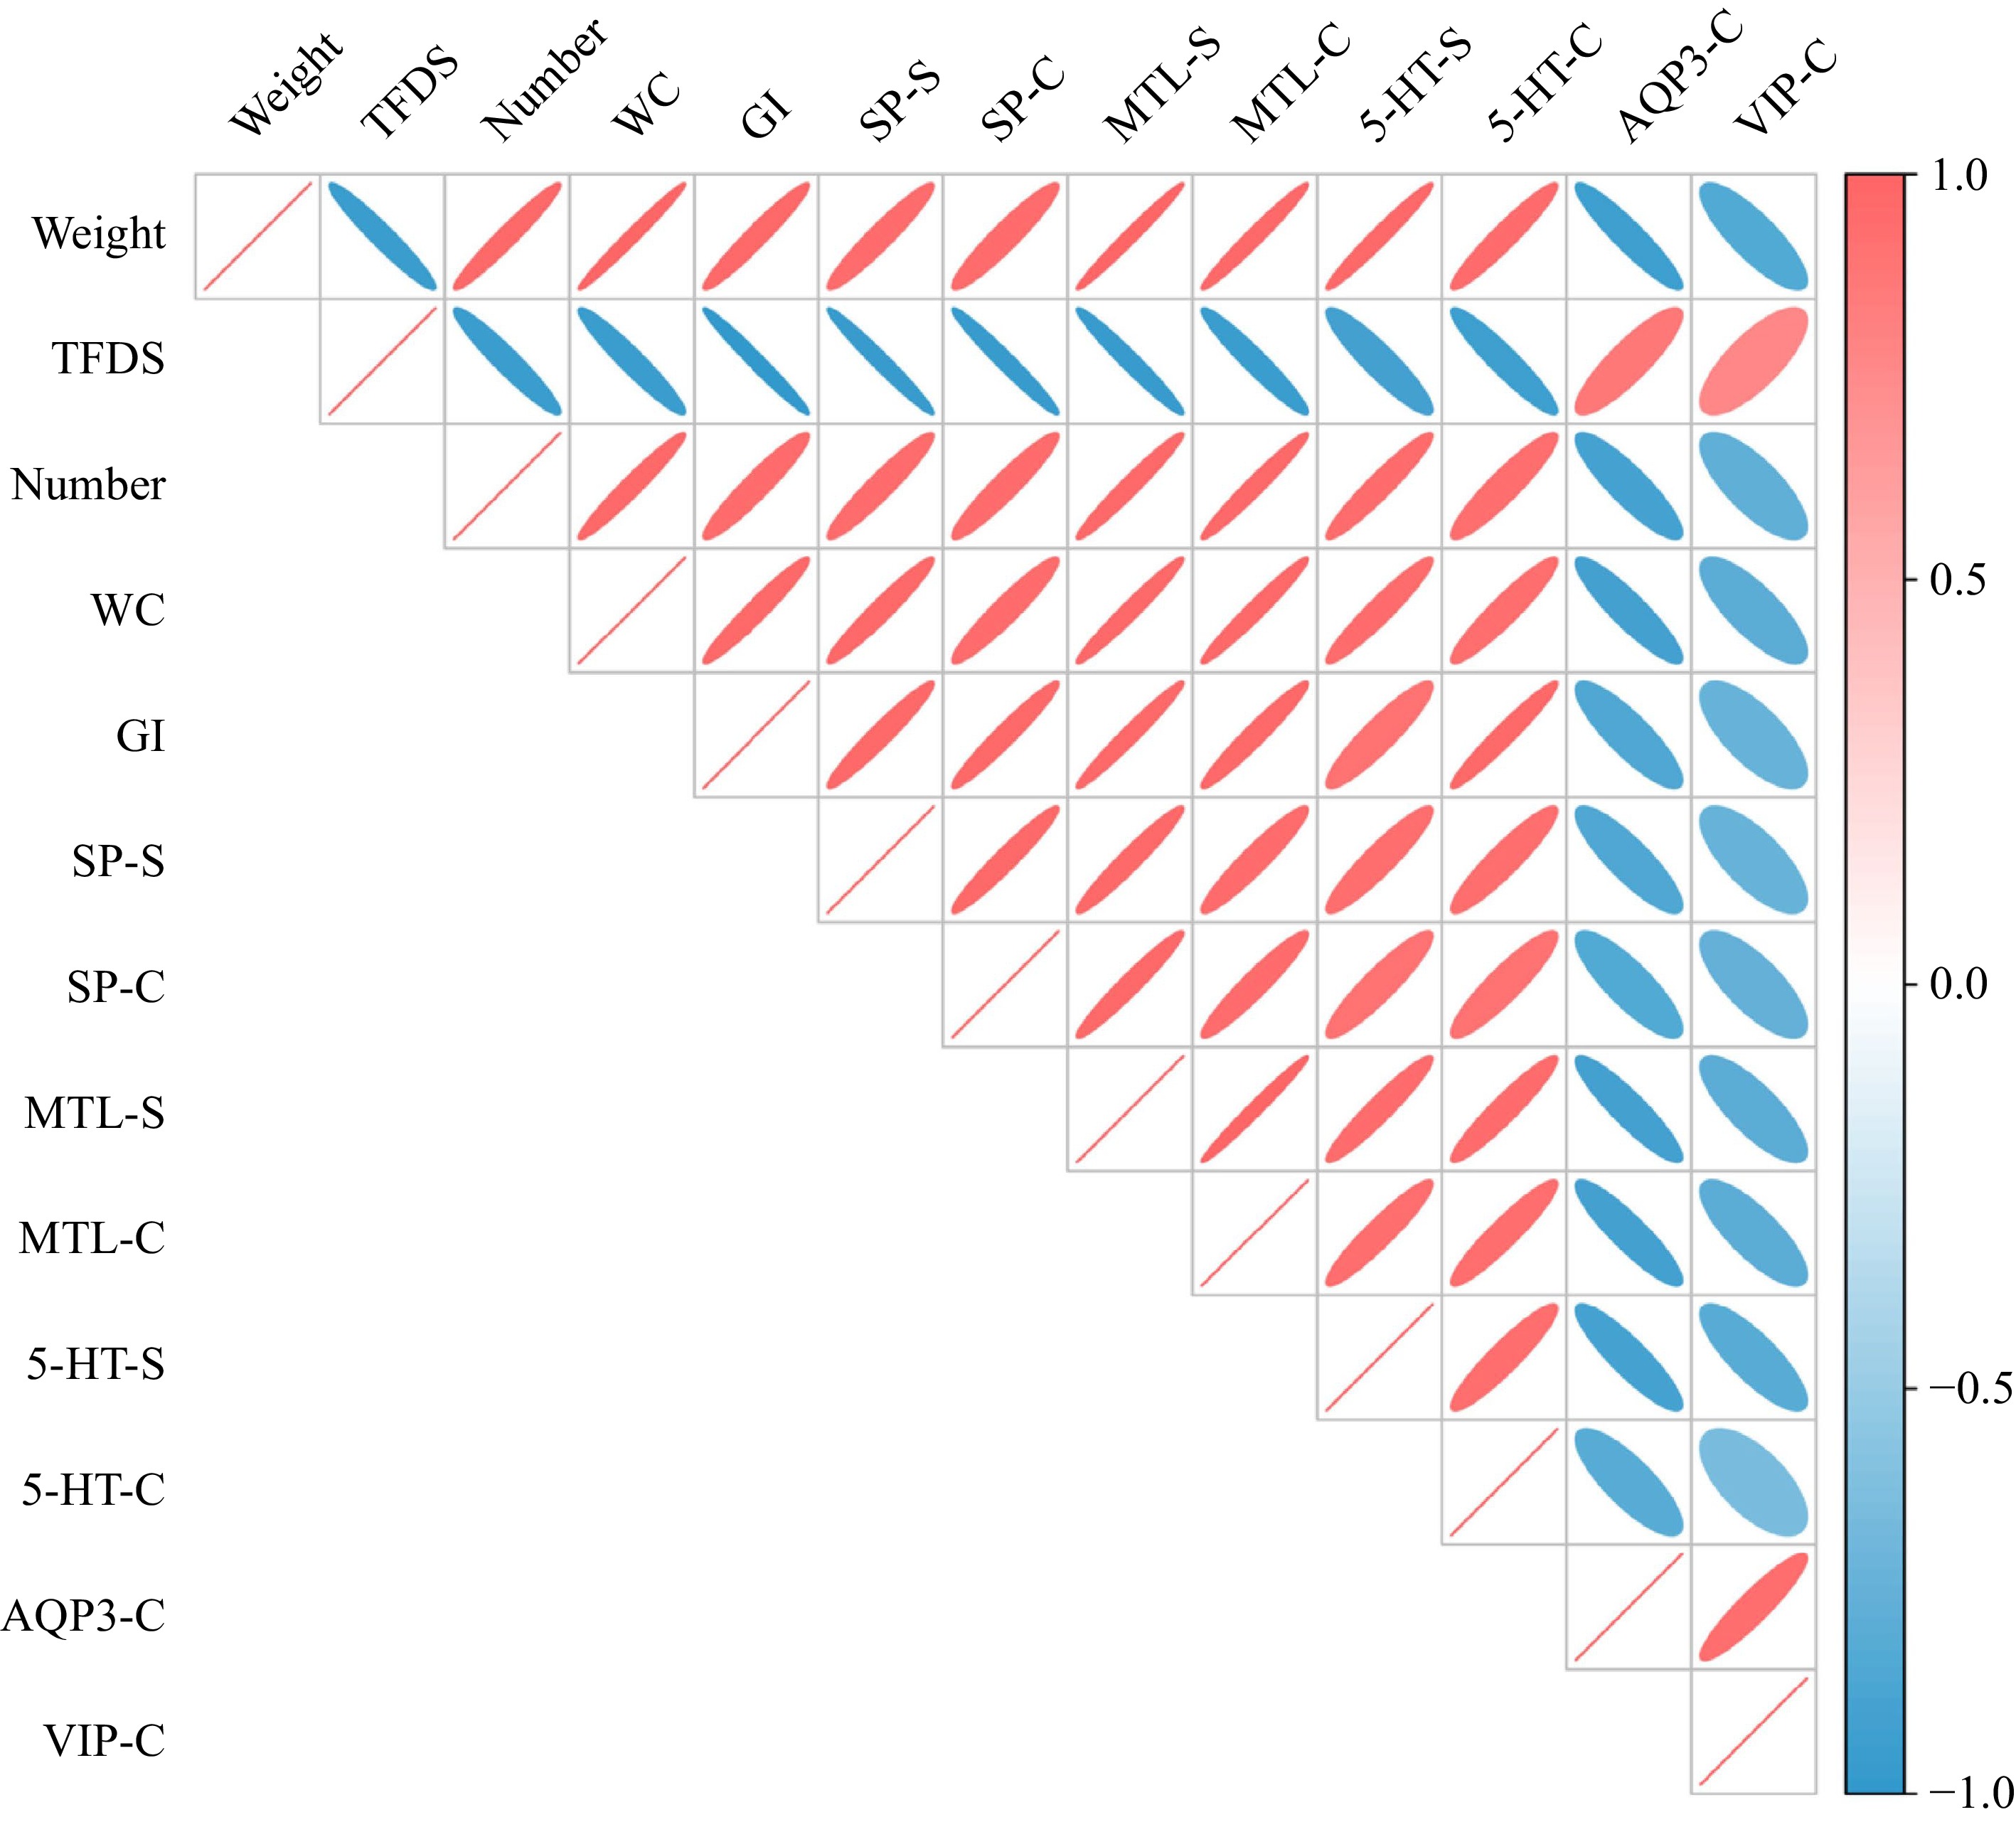
Figure 6.
Correlation between constipation-related indicators and neurotransmitters in animal experiment. (TFDS is time to the first dark stool, WC is water content of feces, GI is gastrointestinal transit rate, SP-S is SP level in the serum, SP-C is SP level in the colon). The pink and blue colors represent the positive and negative correlation between two indicators.
-
Primer Forward primer Reverse primer Product size (bp) AQP3 5’-ACCCTGCCCGTGACTTTG-3’ 5’-ACACCAGCGATGGAACCC-3’ 130 VIP 5’-TTCACCAGCGATTACAGC-3’ 5’-GTCGTTTGATTGGCACAG-3’ 118 β-actin 5’-CTGTGCCCATCTACGAGGGCTAT-3’ 5’-TTTGATGTCACGCACGATTTCC-3’ 155 Table 1.
Primer sequences.
Figures
(6)
Tables
(1)