-

Figure 1.
(a) Establishment of shading treatments. (b) SCZ tea plants, (c) diurnal PAR intensity and (d) diurnal temperature under different treatments in April and August. The PAR and temperature were measured at the 7 d of shading treatments. Control, tea plants are grown naturally without shade; MS, medium shading where 40%−50% of natural sunlight can be transmitted through the nets; HS, heavy shading where 10%−20% of natural sunlight can be transmitted; PAR, photosynthetically active radiation. Data shown are conducted by at least three independent biological replicates (n = 3). Same thereafter for abbreviation and statistical analysis.
-

Figure 2.
OPLS-DA analysis for major catechins of tender tea leaves under different treatments in (a), (b) April and (c), (d) August. 1 d, 7 d and 14 d represent 1 day, 7 days and 14 days under shading conditions, respectively. OPLS-DA analysis was conducted by SIMCA 13.0 (UMETRICS,
https://umetrics.com/ ). △ shows catechins in different treatments (black, Control; red, Medium Shading; blue, Heavy Shading); PC1 shows variance between treatments; PC2 shows variance between catechins. -
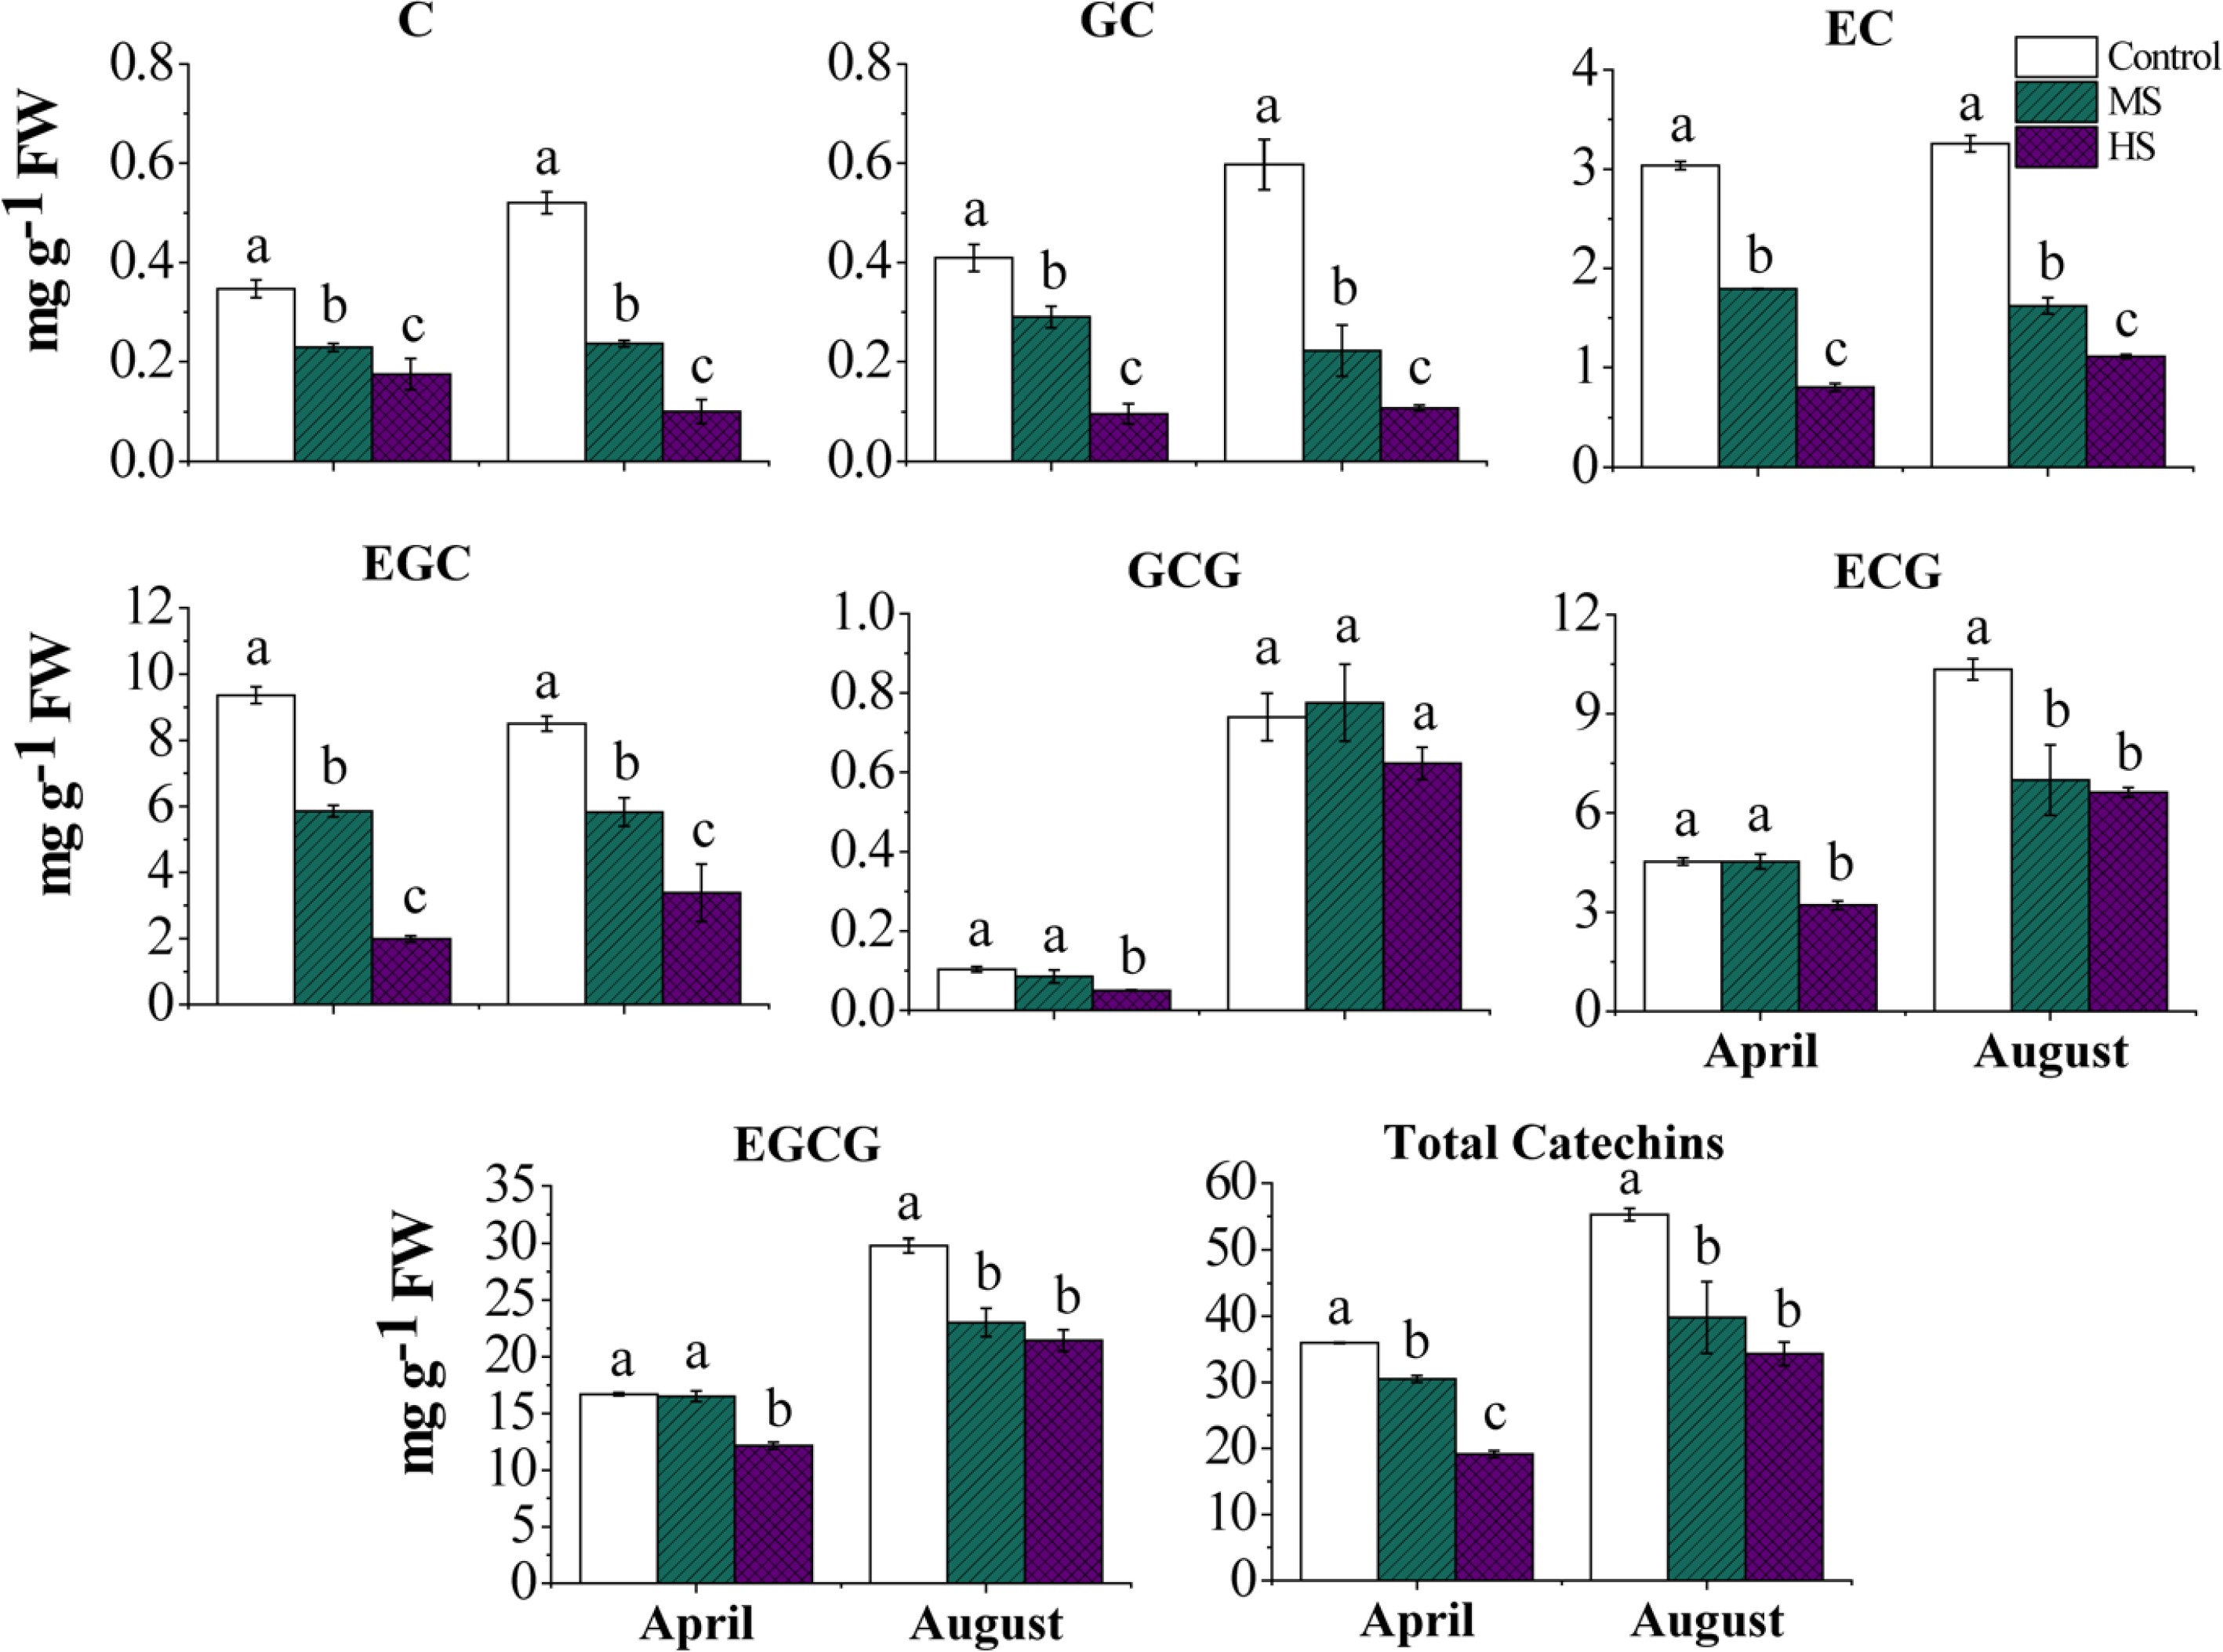
Figure 3.
Catechin accumulations of tender tea leaves at 14 d under different treatments in April and August. C, catechin; GC, gallocatechin; EC, epicatechin; EGC, epigallocatechin; GCG, gallocatechin gallate; ECG, epicatechin gallate; EGCG, epigallocatechin gallate. Letters (a, b, c) show significant differences and grouping information comparing different treatments according to one-way ANOVA and Fisher’s LSD test at the 5% level.
-
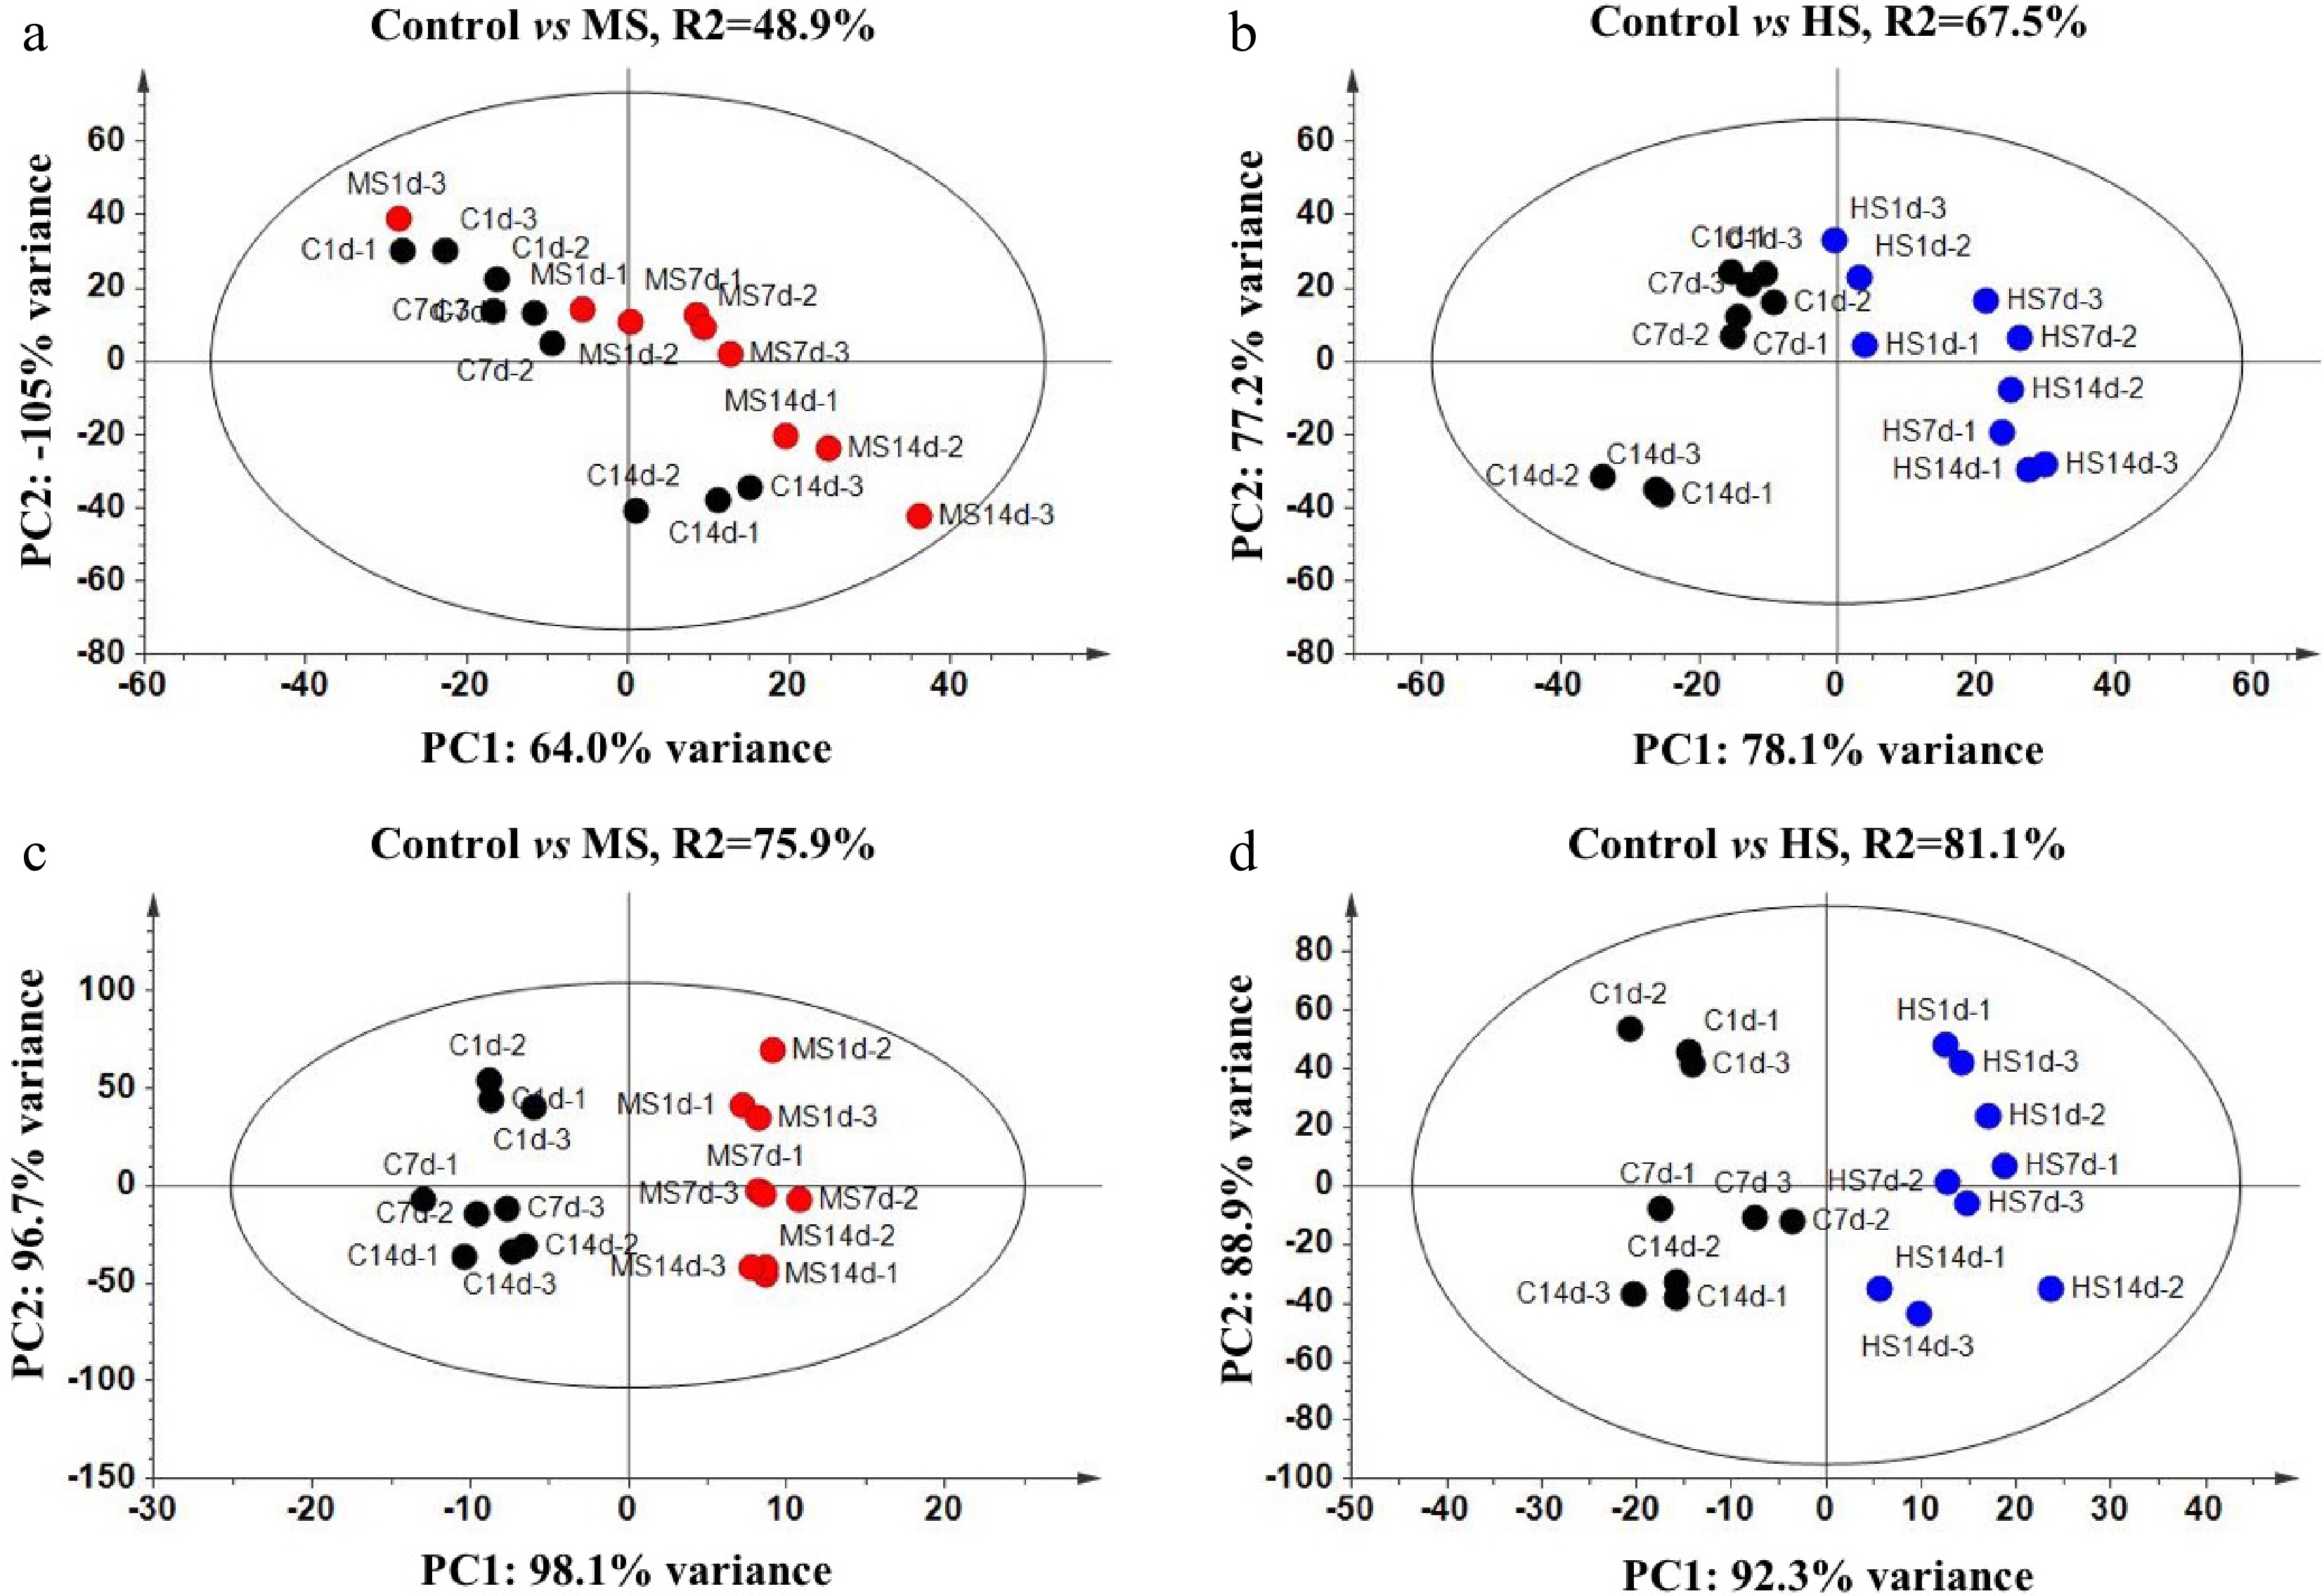
Figure 4.
OPLS-DA analysis for major free amino acids of tender tea leaves under different treatments in (a), (b) April and (c), (d) August. ○ shows amino acids in different treatments (black, Control; red, Medium Shading; blue, Heavy Shading); PC1 shows variance between treatments; PC2 shows variance between amino acids.
-
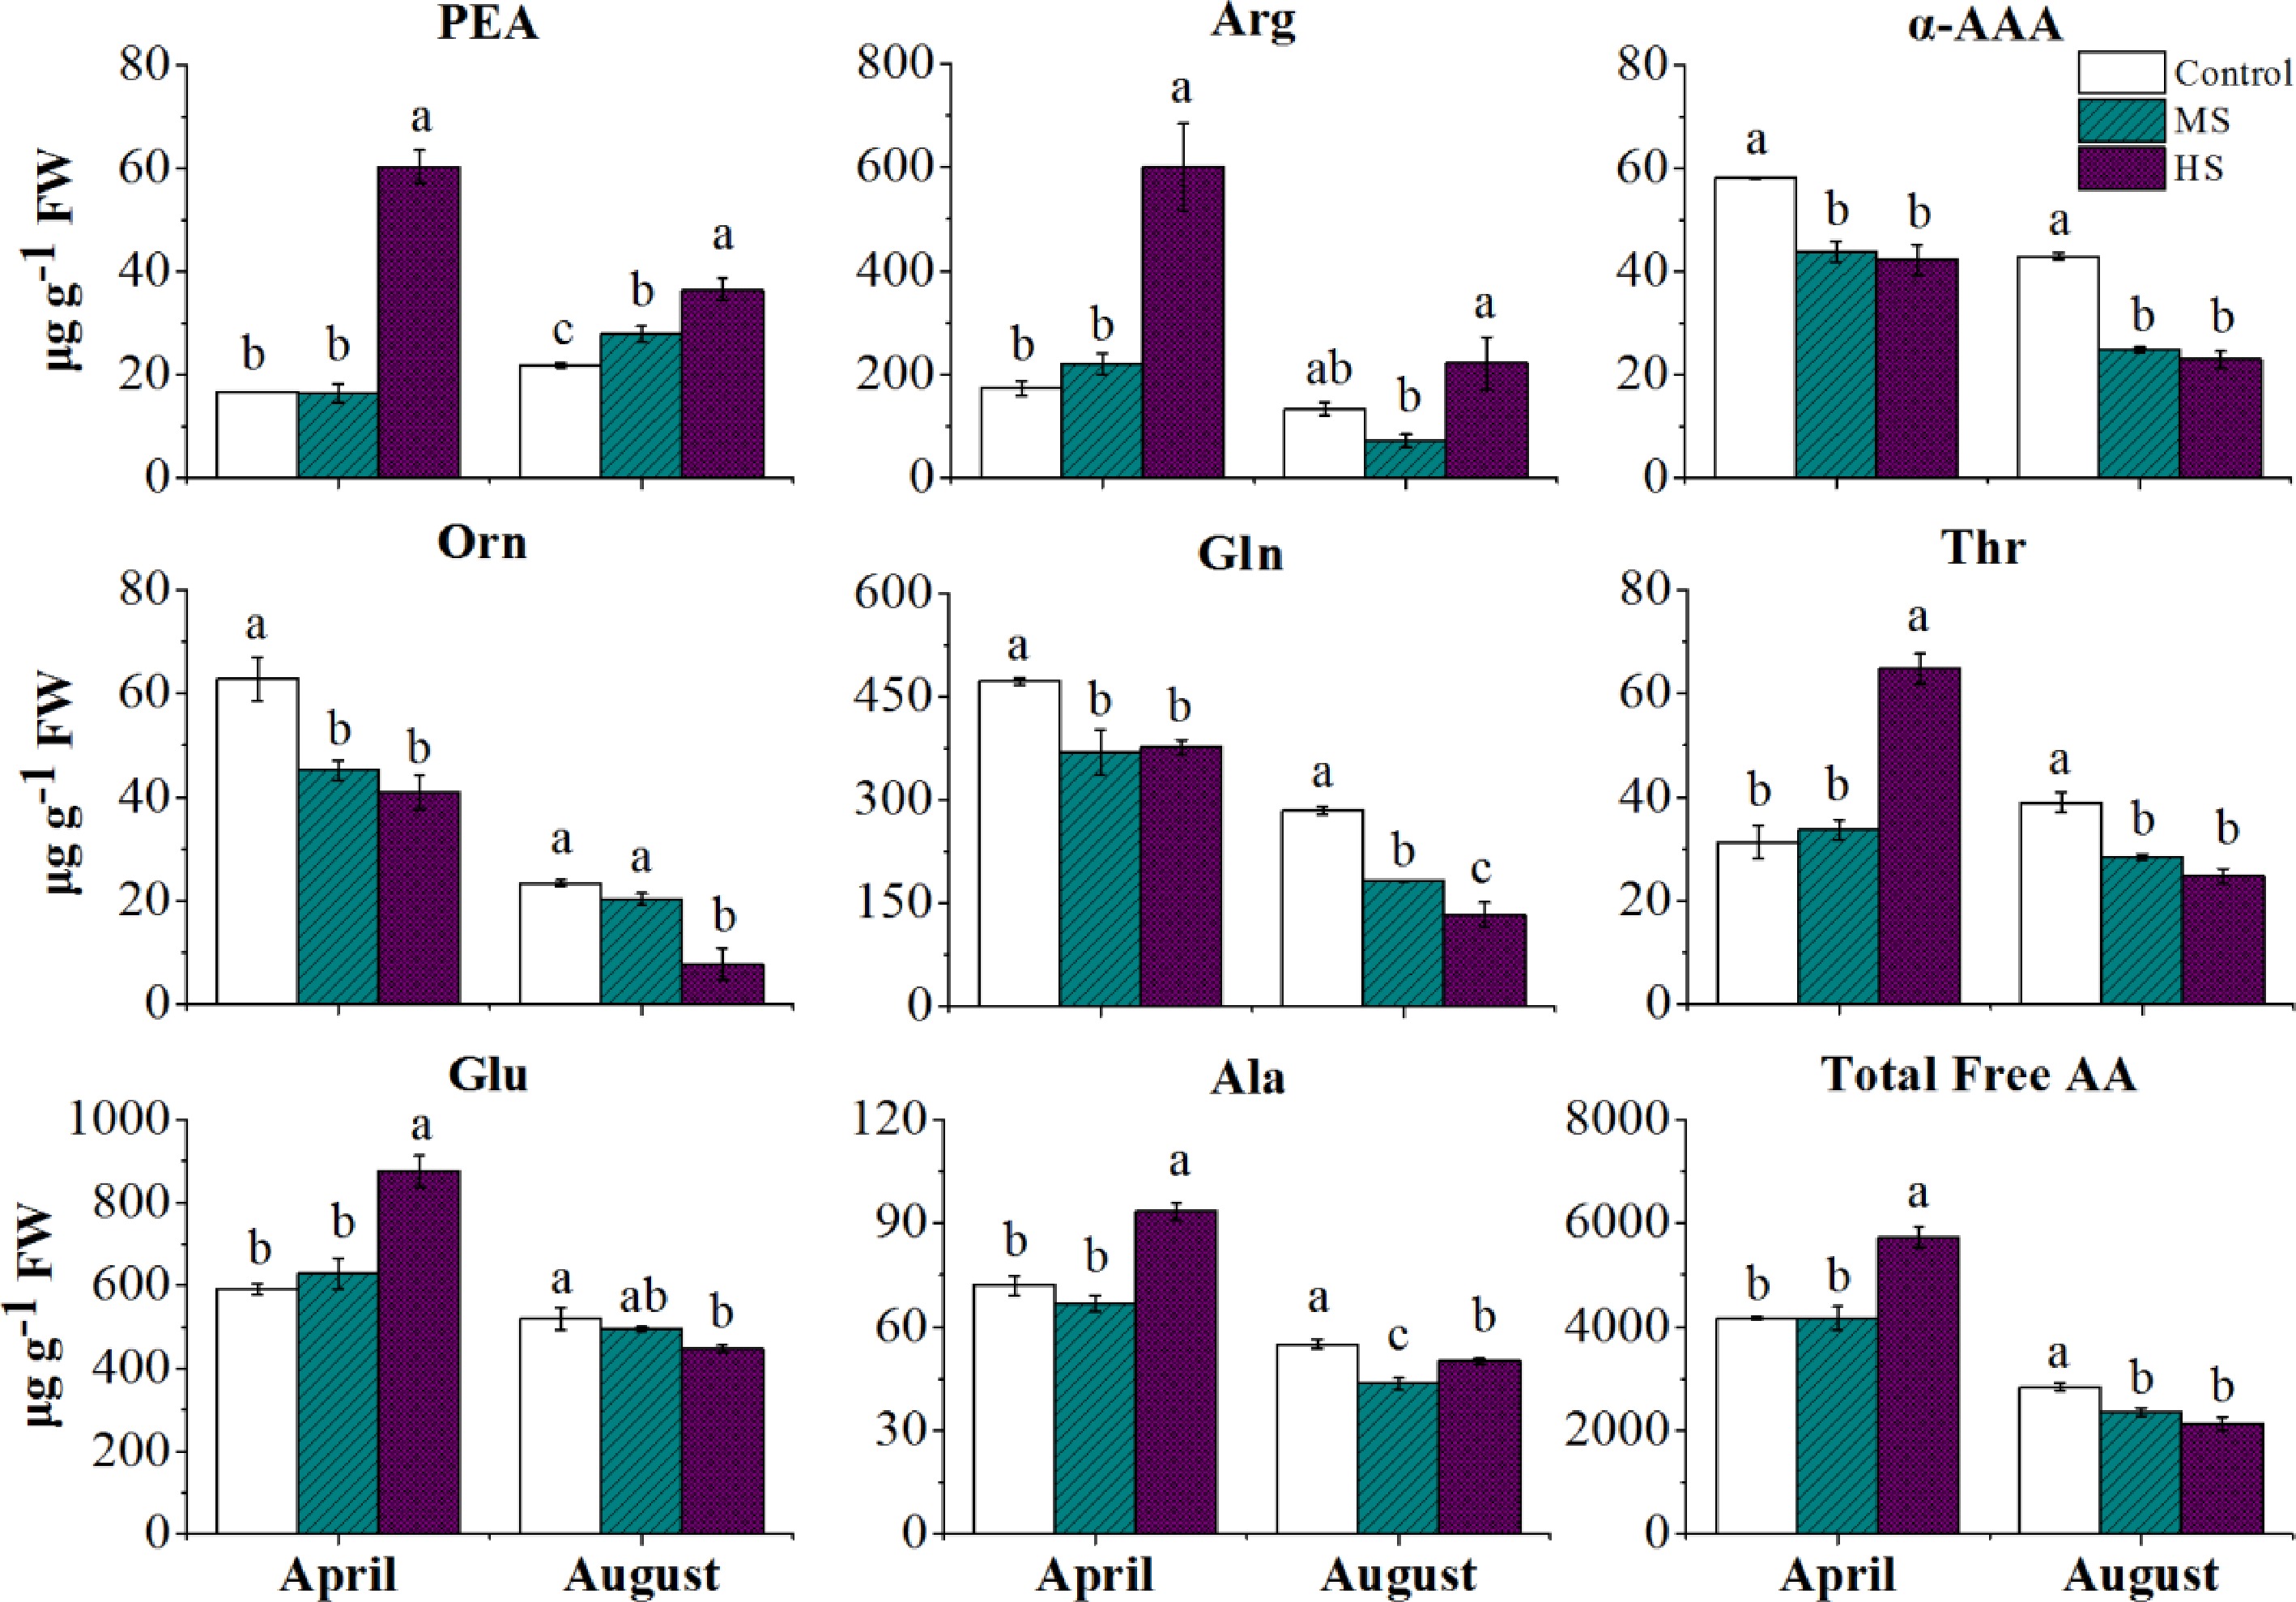
Figure 5.
The free AA accumulations of tender tea leaves at 14 d under different treatments in April and August. Letters (a, b, c) show significant differences and grouping information comparing different treatments according to one-way ANOVA and Fisher’s LSD test at the 5% level.
-
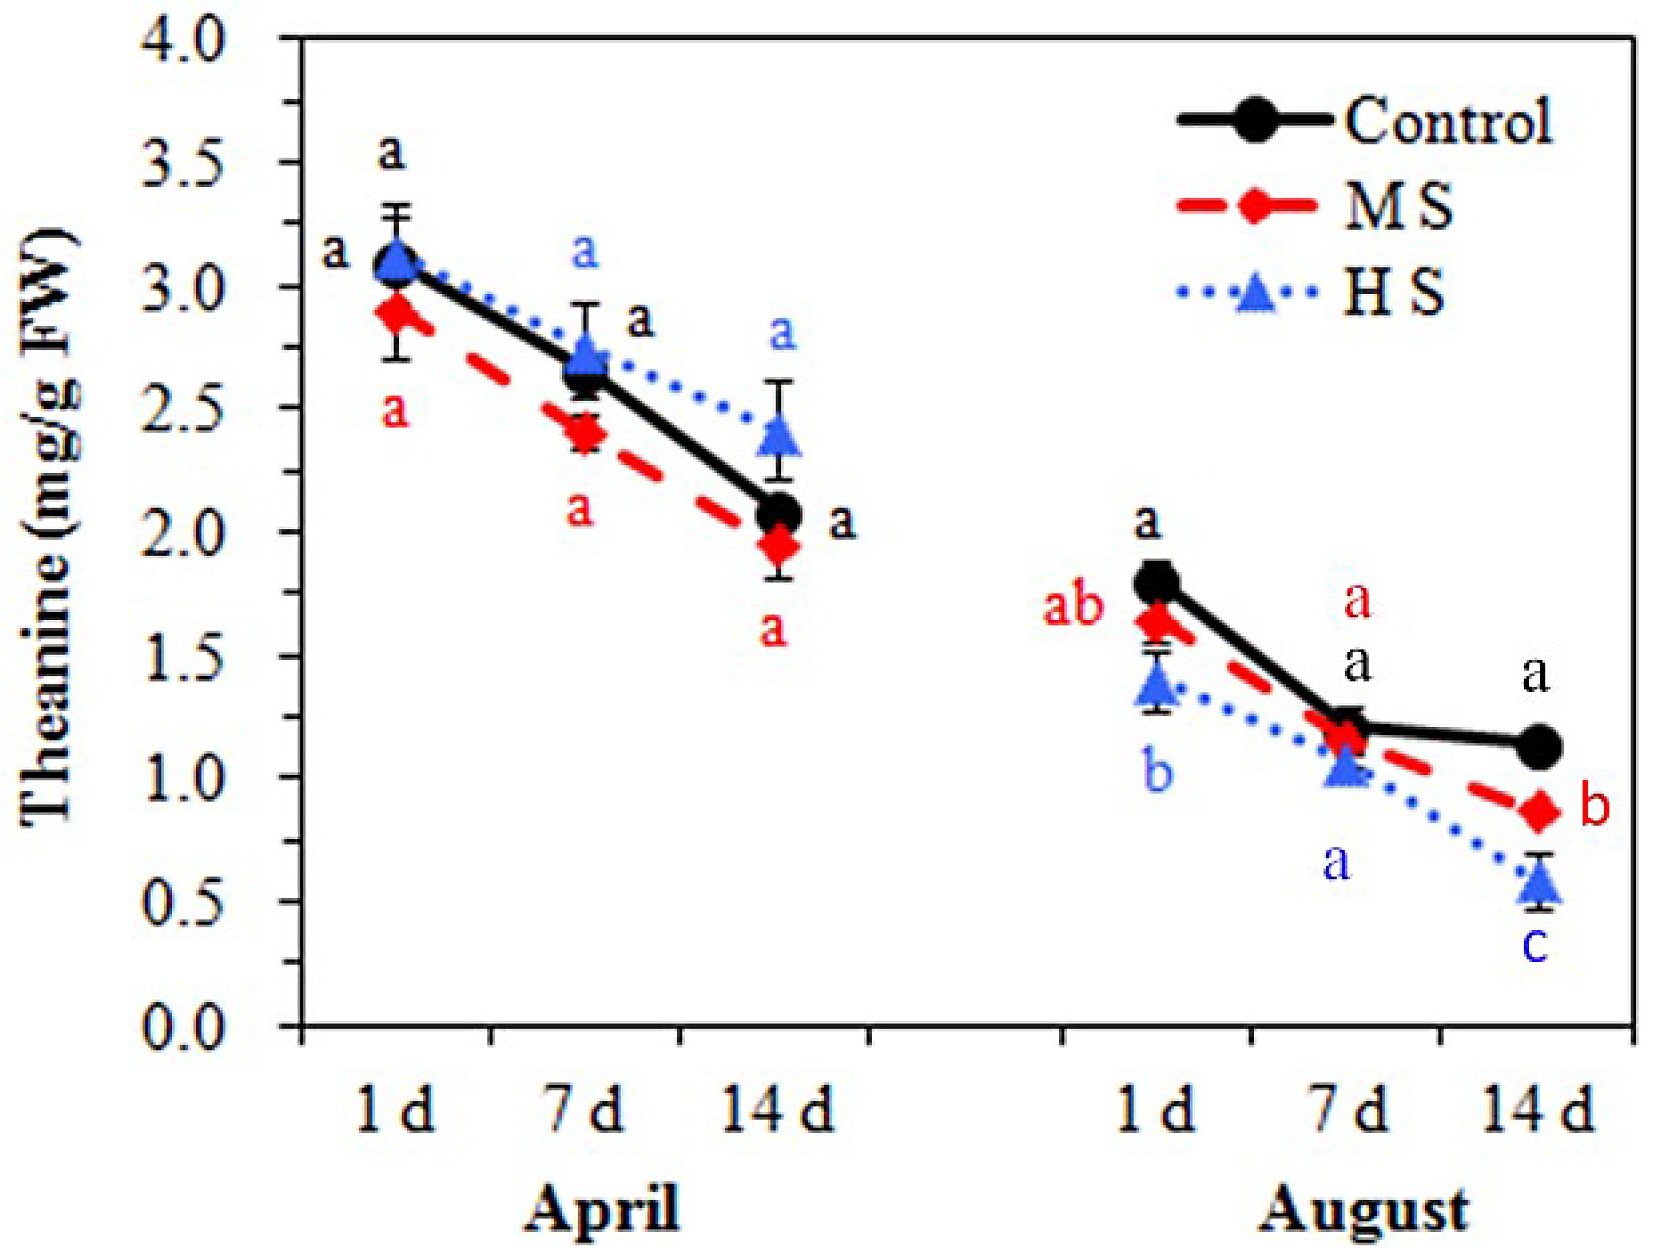
Figure 6.
The theanine accumulation of tender tea leaves under different treatments during the experimental periods in April and August. Letters (a, b, c) show significant differences and grouping information comparing different treatments according to one-way ANOVA and Fisher’s LSD test at the 5% level.
-
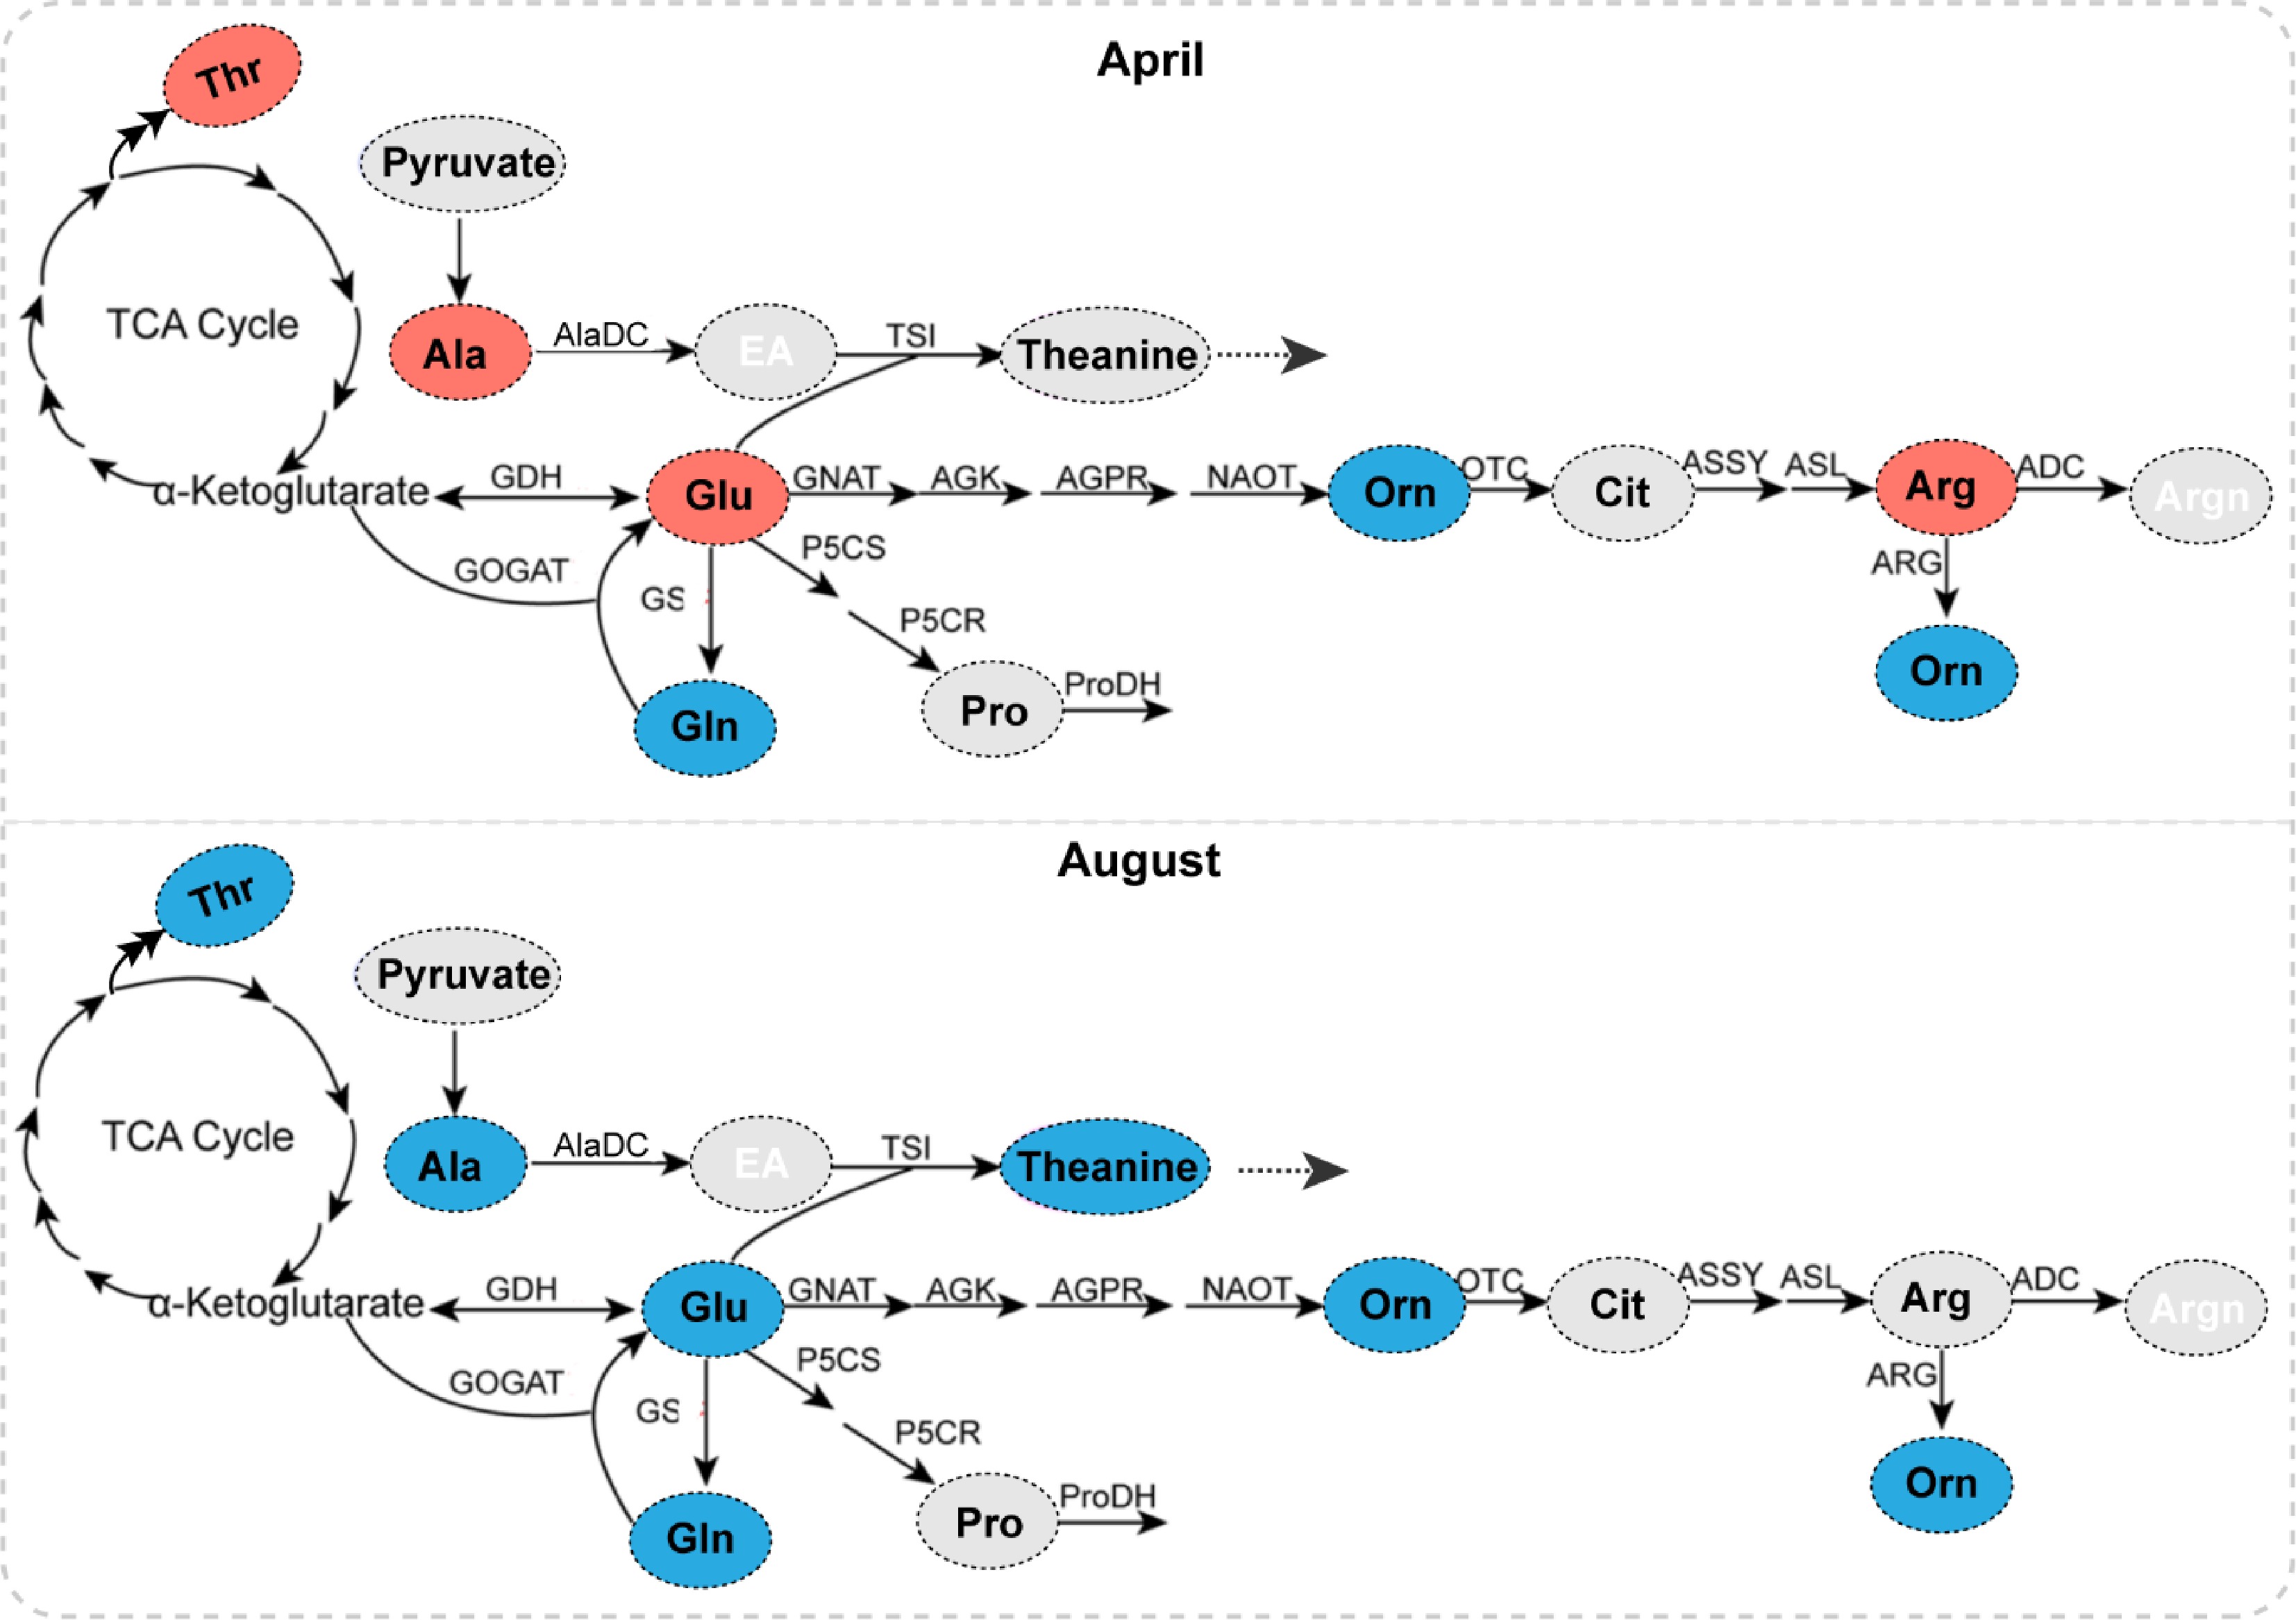
Figure 7.
The effects of heavy shading on AA accumulation of tender leaves in April and August. The predicted Glu pathway in tea plants is modulated from a previous study with permission[44]. AA with a shading-induced increase, decrease and no change is shown in red, blue, and grey, respectively. GDH, glutamate dehydrogenase; GS, glutamine synthetase; GOGAT, glutamate synthase; AlaDC, alanine decarboxylase; TSI, theanine synthetase; P5CS, 1-pyrroline-5-carboxylate dehydrogenase; GNAT, glutamate N-acetyltransferase; OCT, N-ornithine carbamoyltransferase; ASSY, argininosuccinate synthase; ARG, arginase; ADC, arginine decarboxylase.
-
April, Proponent (%) August, Proponent (%) Control MS HS Control MS HS P-Ser 2.36 2.57 2.38 2.59 2.23 2.58 PEA 0.40 0.40 1.05 0.79 1.18 1.71 Asp 4.79 8.42 10.77 7.46 8.39 9.40 Thr 0.75 0.81 1.13 1.37 1.20 1.16 Ser 2.02 1.68 1.48 2.46 2.67 3.92 Pro 0.34 0.25 0.31 0.52 0.54 0.81 Glu 14.18 15.09 15.28 18.25 20.93 20.93 Gln 11.33 8.86 6.57 10.01 7.73 6.27 Theanine 50.35 46.94 42.06 40.09 36.77 27.81 α-AAA 1.39 1.05 0.74 1.51 1.05 1.08 Gly 0.26 0.24 0.16 0.55 0.60 0.65 Ala 1.73 1.60 1.63 1.93 1.84 2.35 Cit 0.54 0.54 0.47 1.01 1.03 1.17 α-ABA 0.18 0.18 0.17 0.21 0.18 0.24 Val 0.26 0.28 0.32 0.47 0.54 0.80 Cys 0.25 0.21 0.13 0.46 0.40 0.58 Ile 0.03 0.06 0.16 0.10 0.25 0.70 Leu 0.06 0.07 0.12 0.16 0.27 0.57 Tyr 0.14 0.16 0.19 0.25 0.28 0.34 Phe 0.13 0.11 0.19 0.12 0.19 0.25 β-Ala 0.05 0.04 0.34 0.07 0.08 0.11 β-AiBA 0.11 0.11 0.09 0.16 0.18 0.20 γ-ABA 0.45 0.49 0.47 0.80 0.76 1.00 Trp 1.98 2.42 1.43 2.85 5.97 4.23 Orn 1.51 1.08 0.71 0.82 0.86 0.37 His 0.22 0.28 0.50 0.36 0.31 0.76 Arg 4.17 5.31 10.48 4.68 3.02 10.38 MS, medium shading; HS, heavy shading; P-Ser, o-Phosphoserine; PEA, o-Phosphoethanolamine; Asp, Aspartate; Thr, Threonine; Ser, Serine; Pro, Proline; Glu, Glutamic acid; Gln, Glutamine; α-AAA, α-aminoadipic acid; Gly, Glycine; Ala, Alanine; Cit, Citrulline; α-ABA, α-Aminobutyric acid; Val, Valine; Cys, cysteine; Ile, Isoleucine; Leu, Leucine; Tyr, Tyrosine; Phe, Phenylalanine; β-Ala, β-Alanine; β-AiBA, β-Aminoisobutyric acid; γ-ABA, γ-Aminobutyric acid; Trp, Tryptophan; Orn, Ornithine; His, Histidine; Arg, Arginine. The concentration of amino acids and statistical information are shown in Supplemental Tables S1 & S2. Table 1.
The proponent of amino acid of tender tea leaves at 14 d under different treatments in April and August.
-
April August Catechins
(mg·g−1 FW)AAs
(mg·g−1 FW)Ratio Catechins
(mg·g−1 FW)AAs
(mg·g−1 FW)Ratio Control 35.96a ± 0.08 4.16b ± 0.03 8.64 55.25a ± 0.93 2.85a ± 0.07 19.41 MS 30.49b ± 0.54 4.17b ± 0.02 7.32 39.79b ± 5.42 2.36b ± 0.08 16.83 HS 19.12c ± 0.53 5.73a ± 0.02 3.34 34.29b ± 1.79 2.13b ± 0.01 16.06 Letters (a, b, c) show significant differences and grouping information comparing different treatments according to one-way ANOVA and Fisher’s LSD test at the 5% level. MS, medium shading; HS, heavy shading; AAs, amino acids; FW, fresh weight. Table 2.
The ratio of catechins/amino acids of tender tea leaves at 14 d under different treatments in April and August.
Figures
(7)
Tables
(2)