-
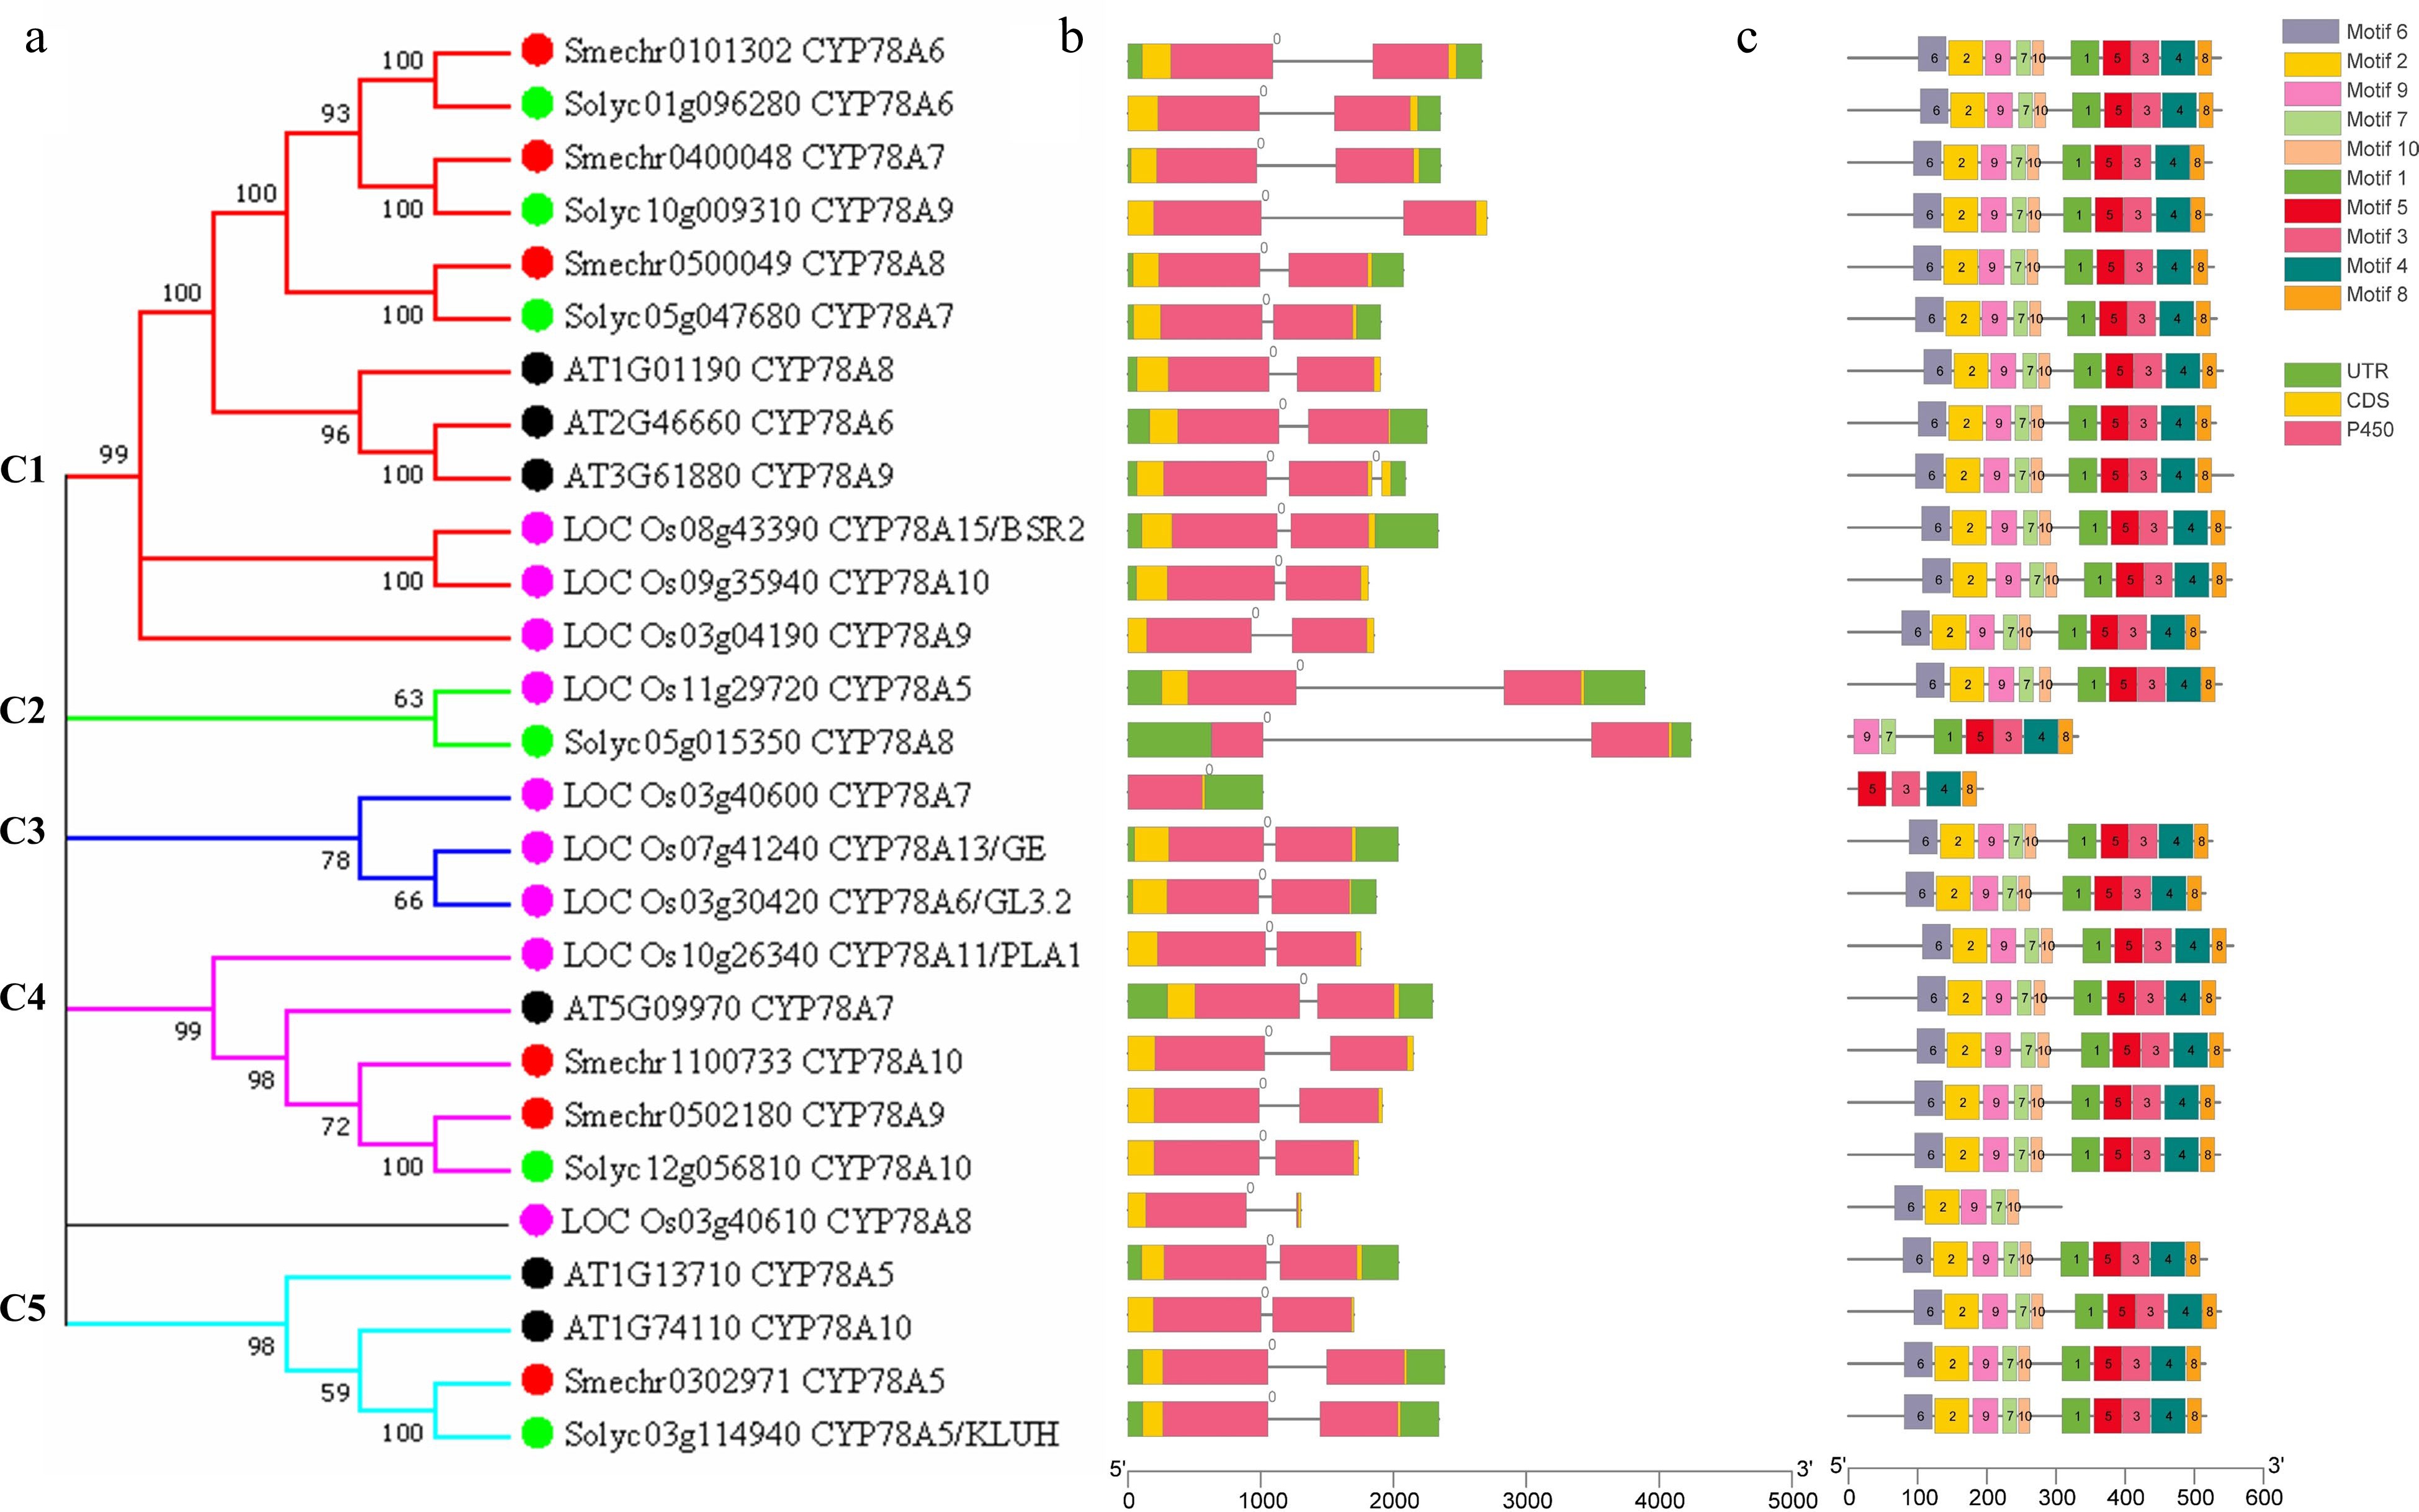
Figure 1.
Phylogenetic relationships, gene structure and conserved protein motifs of CYP78A genes from eggplant, Arabidopsis, rice and tomato. (a) The phylogenetic tree was constructed based on the full-length protein sequences of six AtCYP78As, nine OsCYP78As, six SlCYP78As and six SmCYP78As proteins using MEGA 7.0 software. Eggplant, Arabidopsis, rice and tomato CYP78As were labeled by red, black, pink and green dots. (b) Exon-intron structure of CYP78A genes. Black lines indicate introns. The number indicates the phases of corresponding introns. (c) The motif composition of CYP78A proteins. The motifs, numbers 1–10, are displayed in different colored boxes. The sequence logos and E values for each motif are given in Supplemental Fig. S1.
-
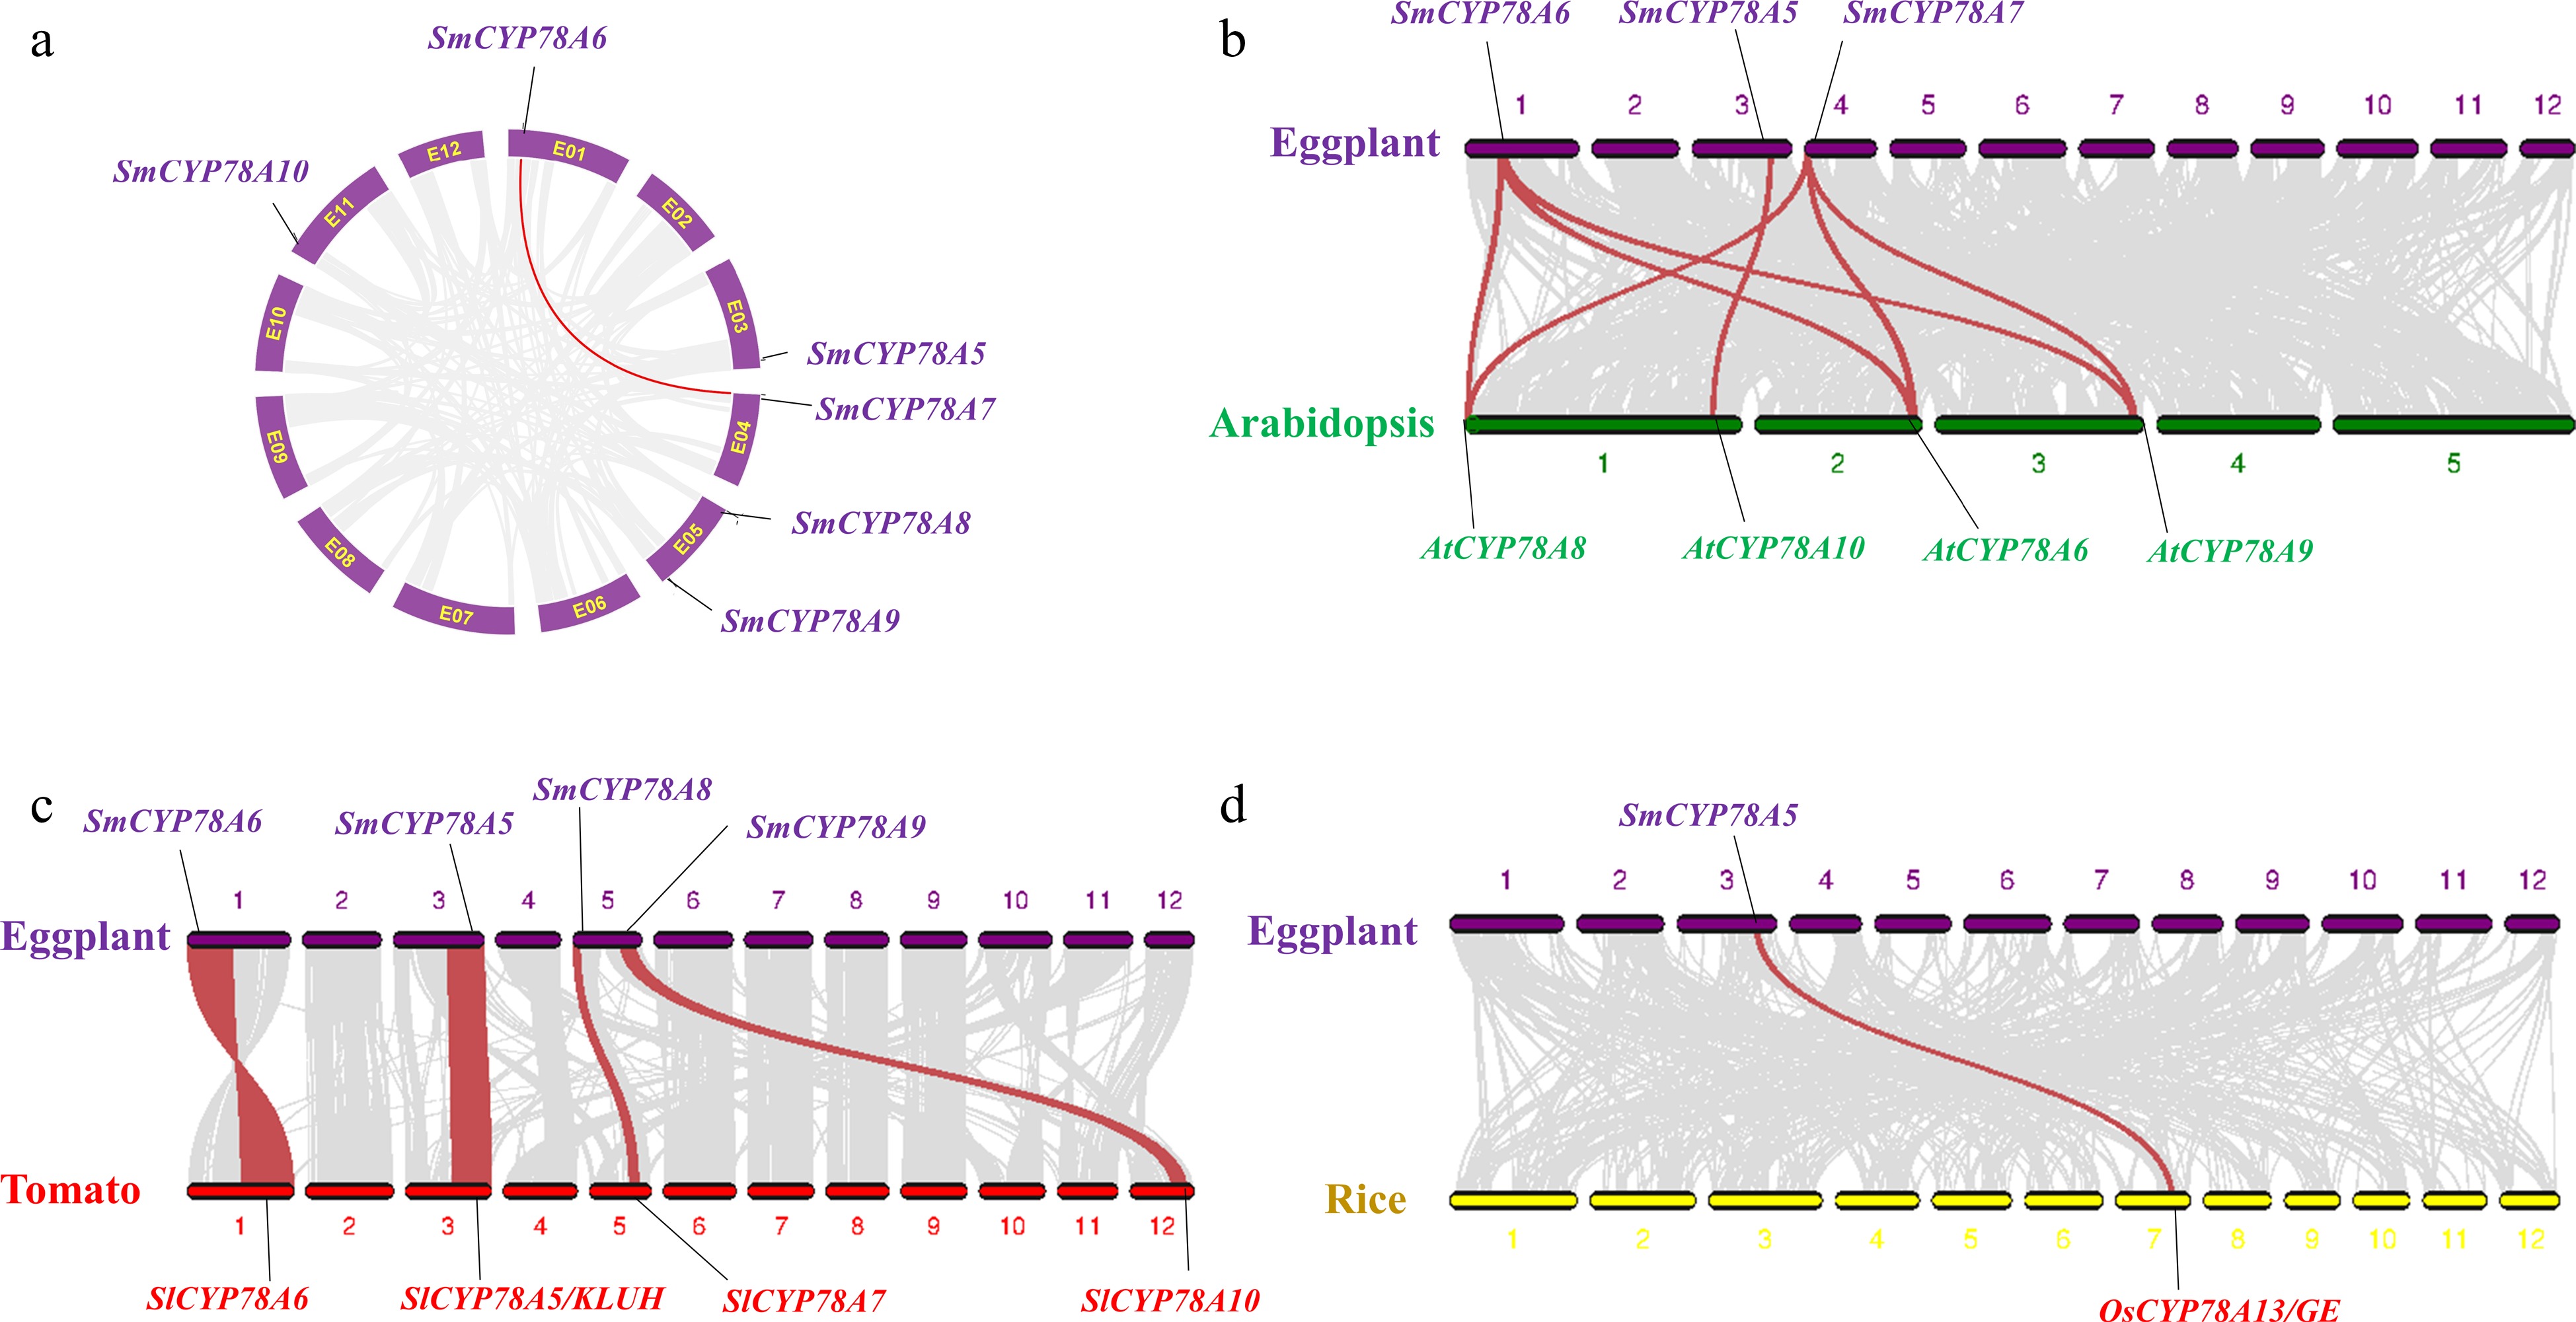
Figure 2.
Gene duplication and synteny analysis of SmCYP78A genes. (a) Schematic representations for the chromosomal distribution and interchromosomal relationships of SmCYP78A genes. Gray lines indicate all synteny blocks in the eggplant genome, and the red lines indicate segmental duplicated SmCYP78A gene pairs. (b) Synteny analysis of CYP78A genes between eggplant and Arabidopsis. (c) Synteny analysis of CYP78A genes between eggplant and tomato. (d) Synteny analysis of CYP78A genes between eggplant and rice. Gray lines in the background indicate the collinear blocks between genomes, while the red lines highlight the syntenic blocks harboring CYP78A gene pairs.
-
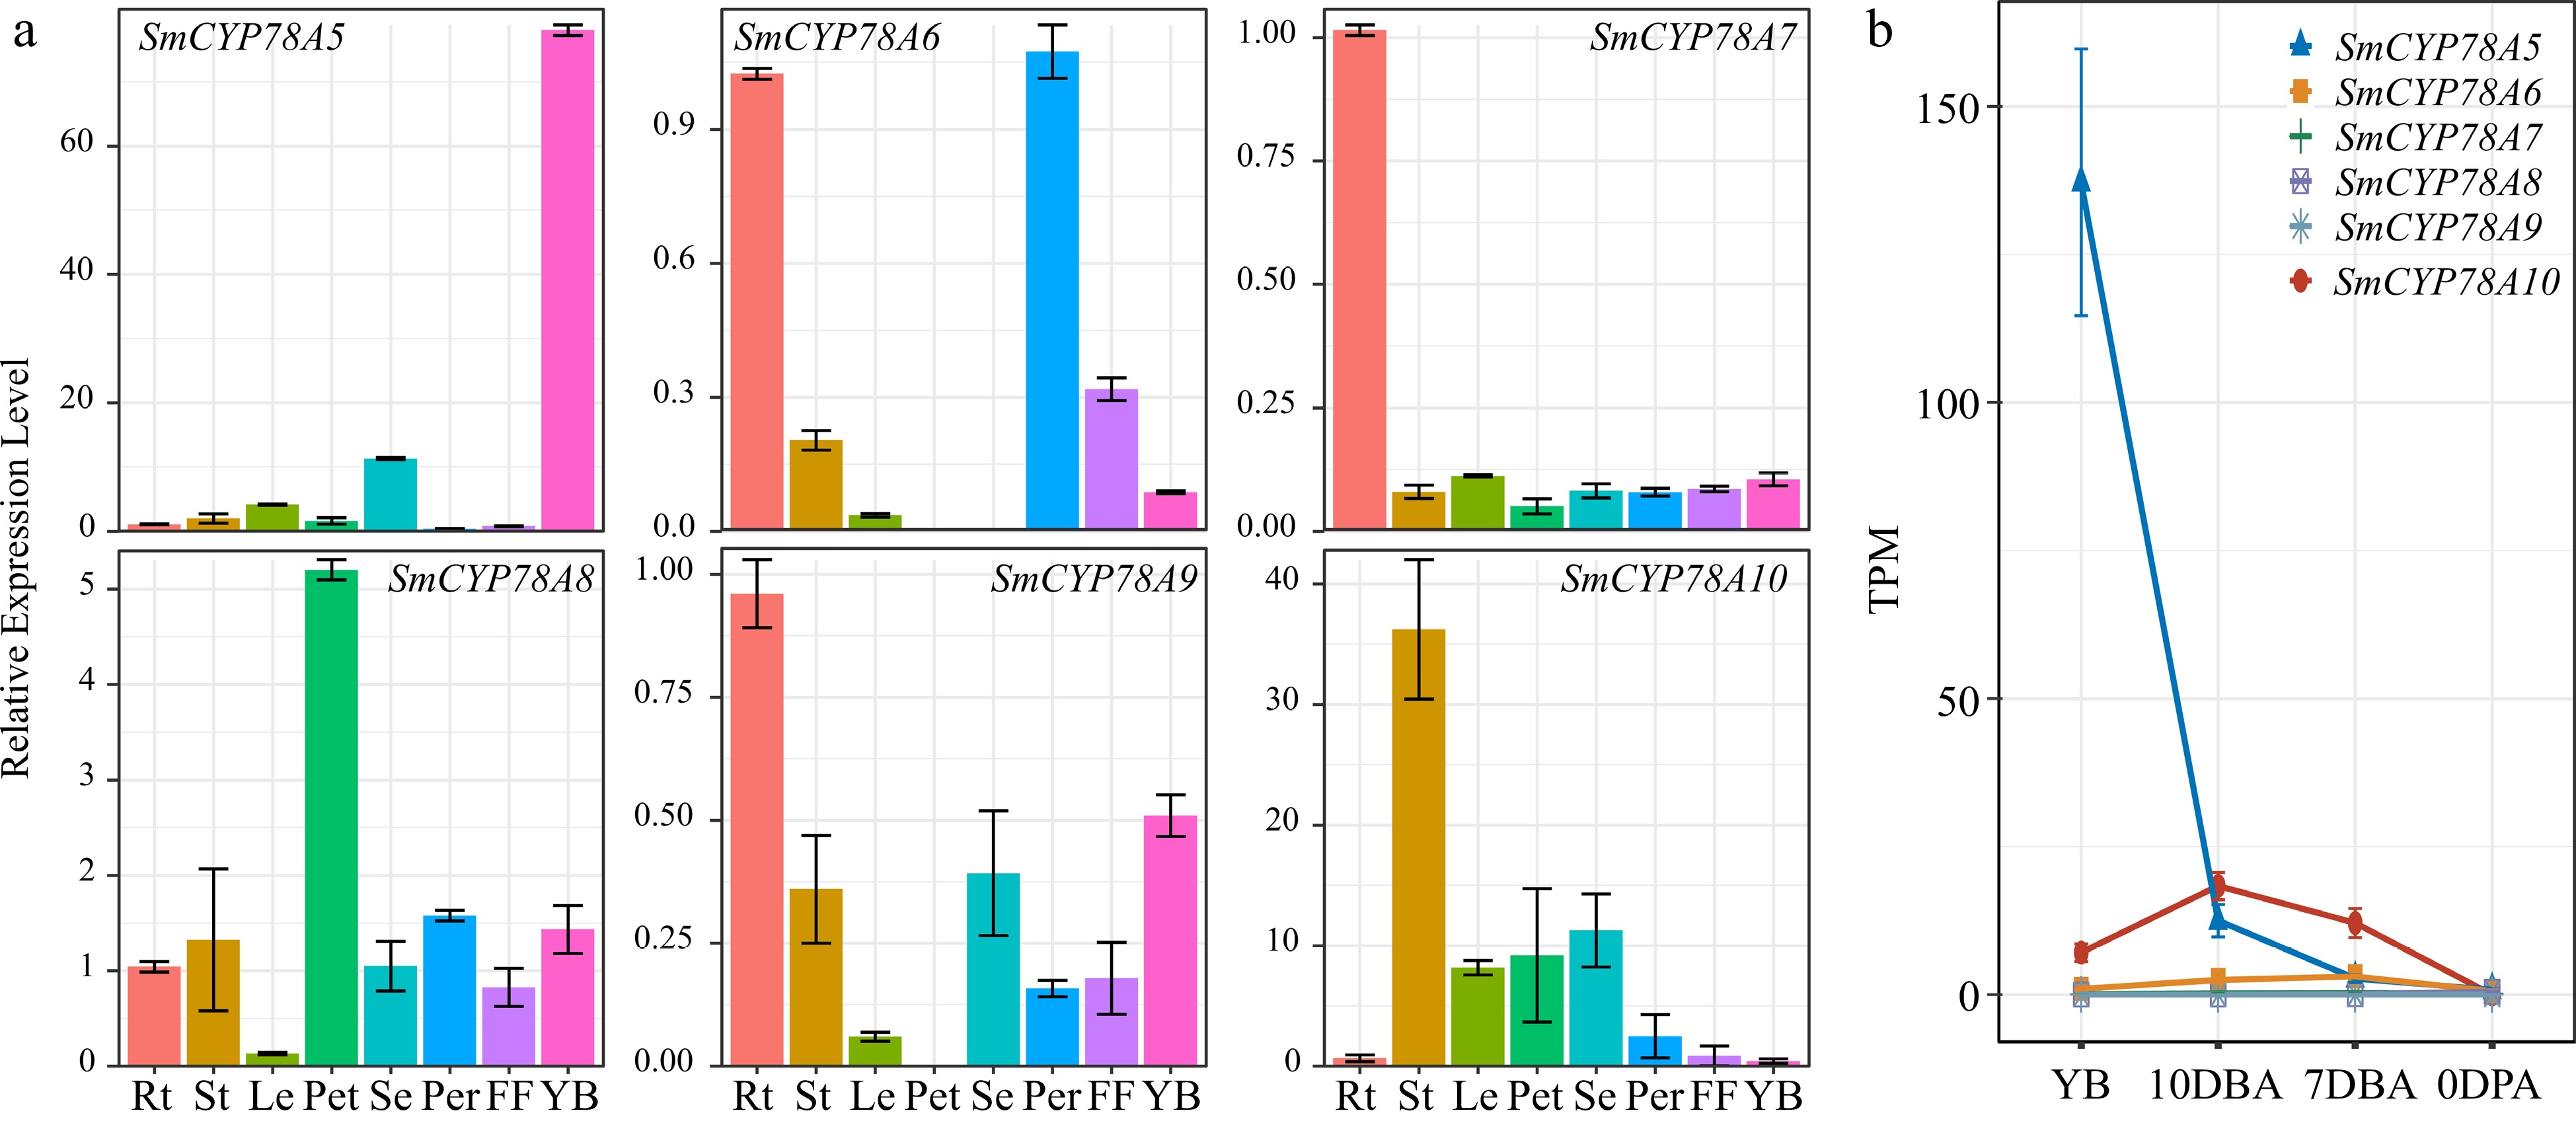
Figure 3.
Expression profiles of the six SmCYP78A genes in different tissues. (a) Relative transcript abundances of the SmCYP78A genes examined by qRT-PCR. (b) Expression of the SmCYP78A genes in young flower buds and developing ovaries detected by RNA-seq. Rt, Root; St, Stems; Le, Leaf; Pet, Petal; Se, Sepal; Per, Pericarp; FF, Fruit flesh; YB, Young flower buds; DBA, Days before anthesis; DPA, Days post anthesis.
-
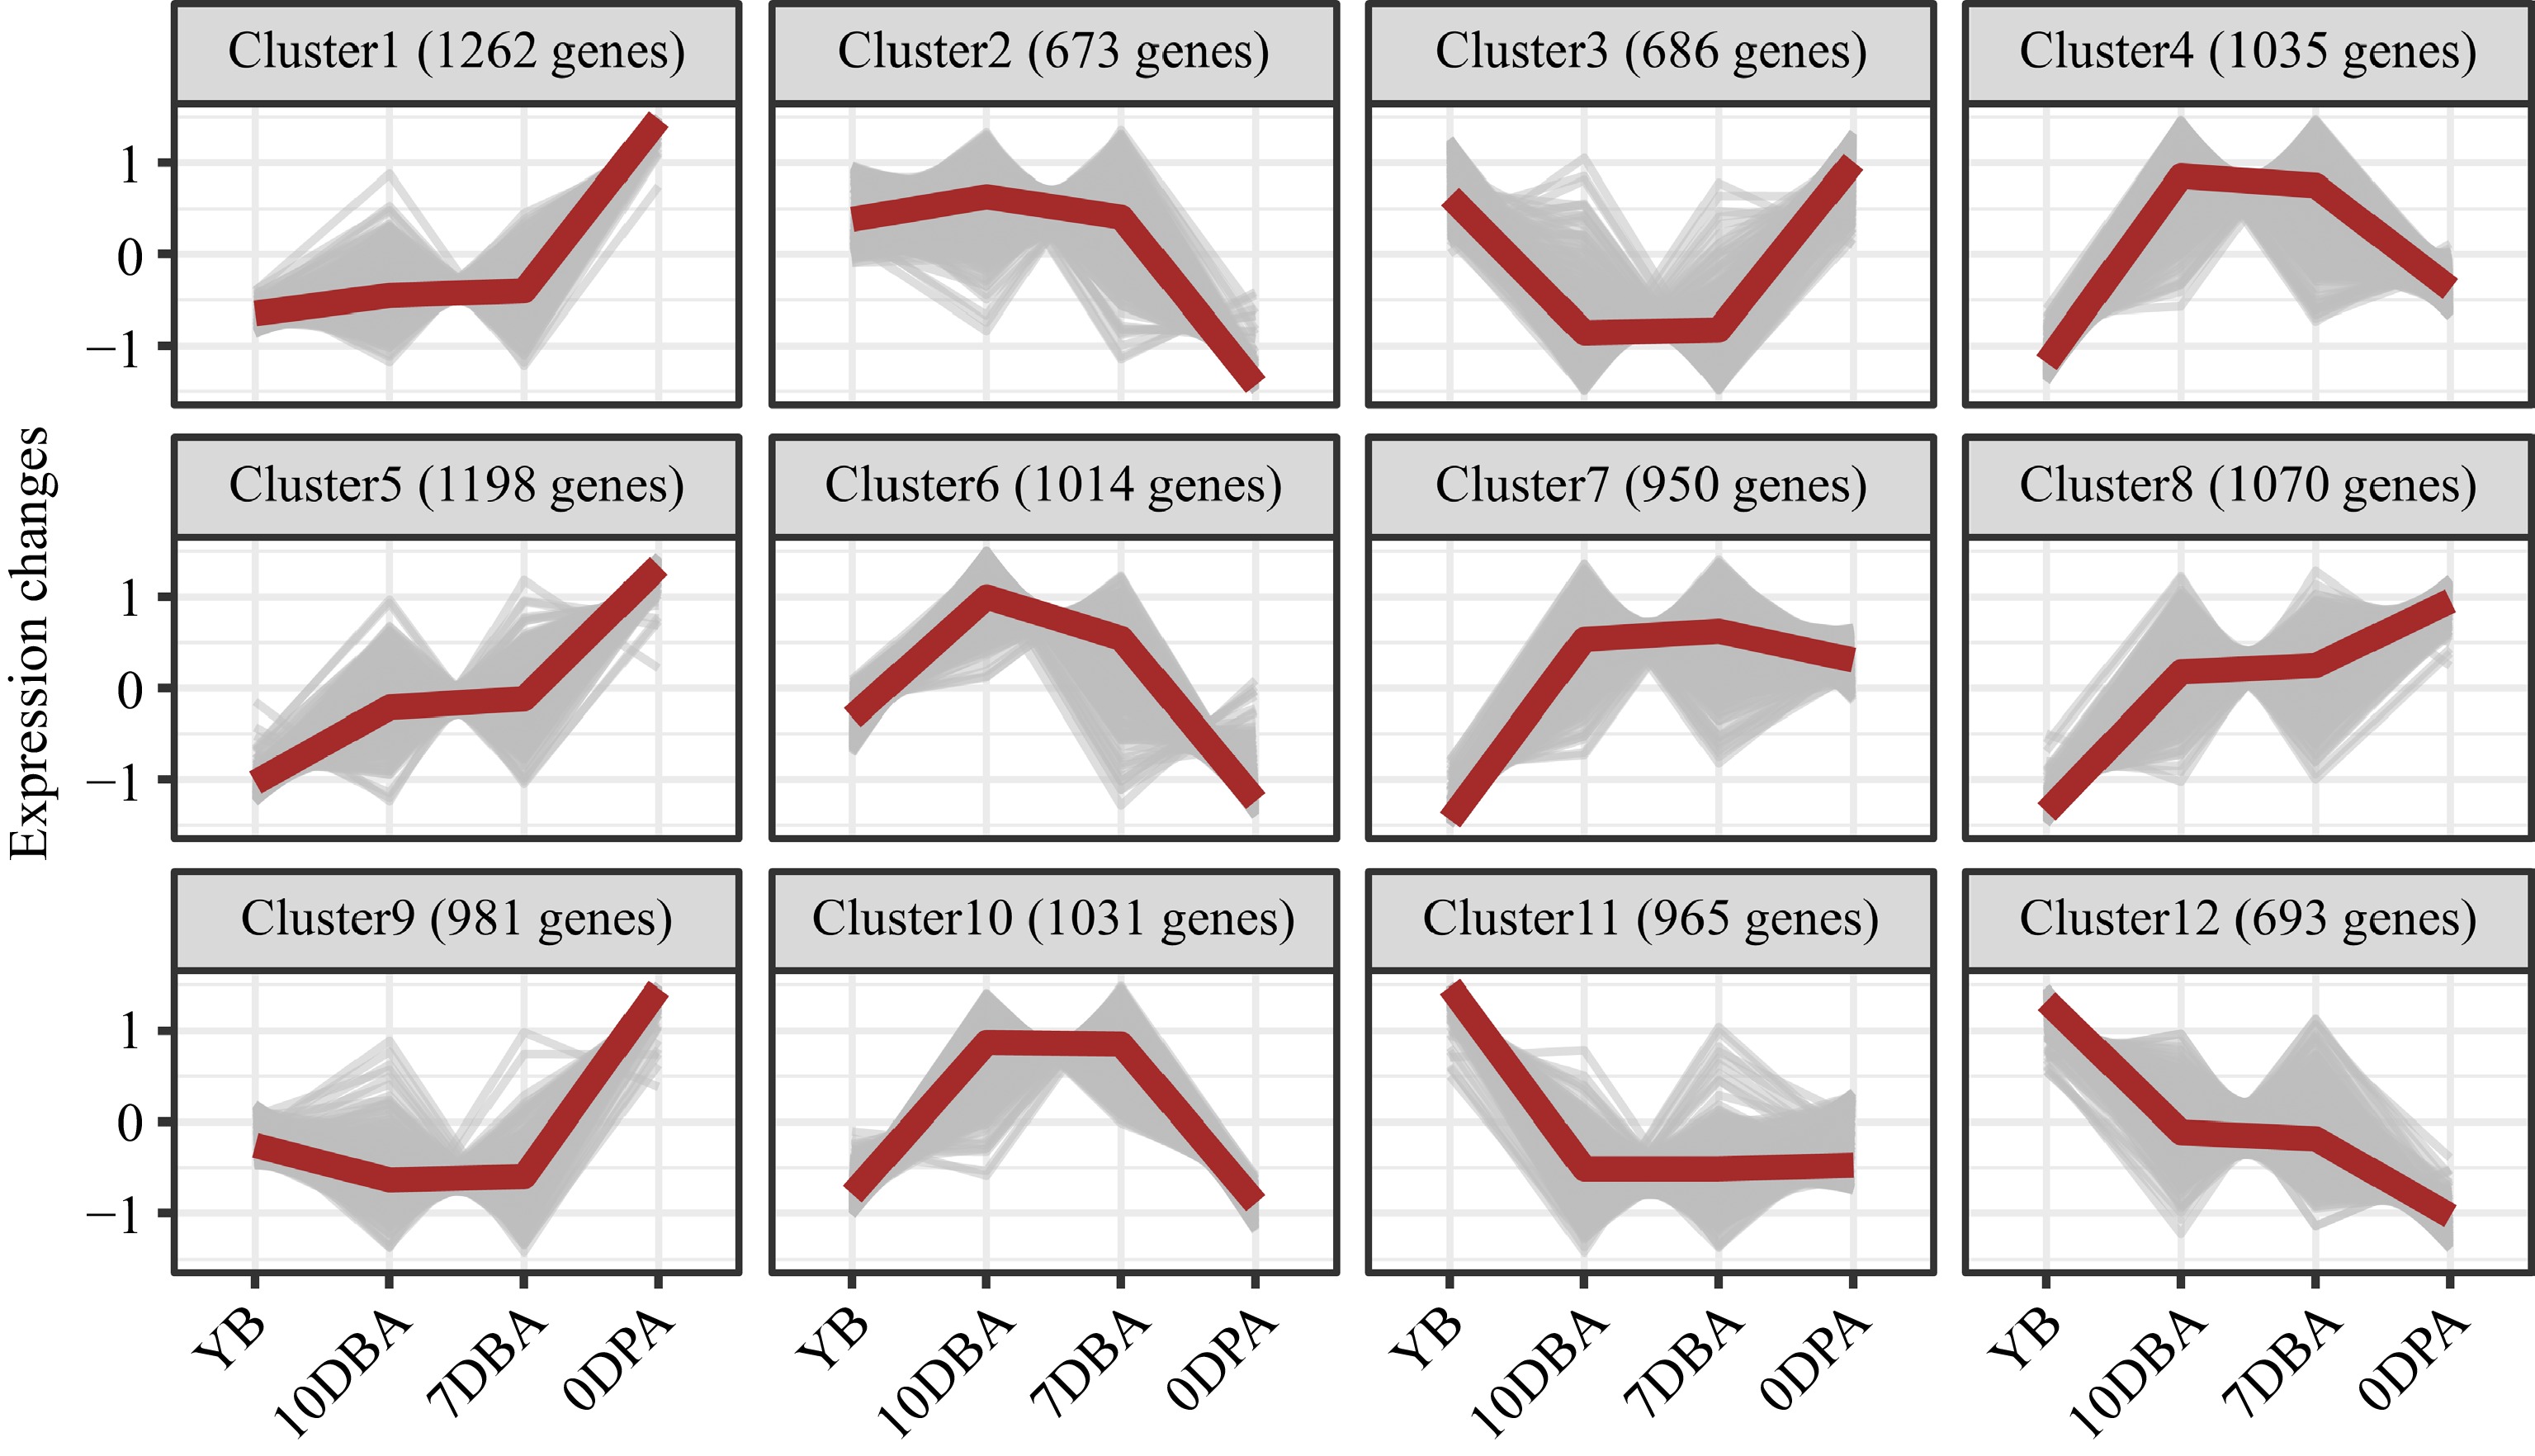
Figure 4.
Twelve co-expressed clusters are clustered using fuzzy C-means clustering in Mfuzz with normalized expression values (z-scores). The red lines represent the average of expression values, whereas the gray lines represent the expression values of the co-expressed genes. YB, Young flower buds; DBA, Days before anthesis; DPA, Days post anthesis.
-
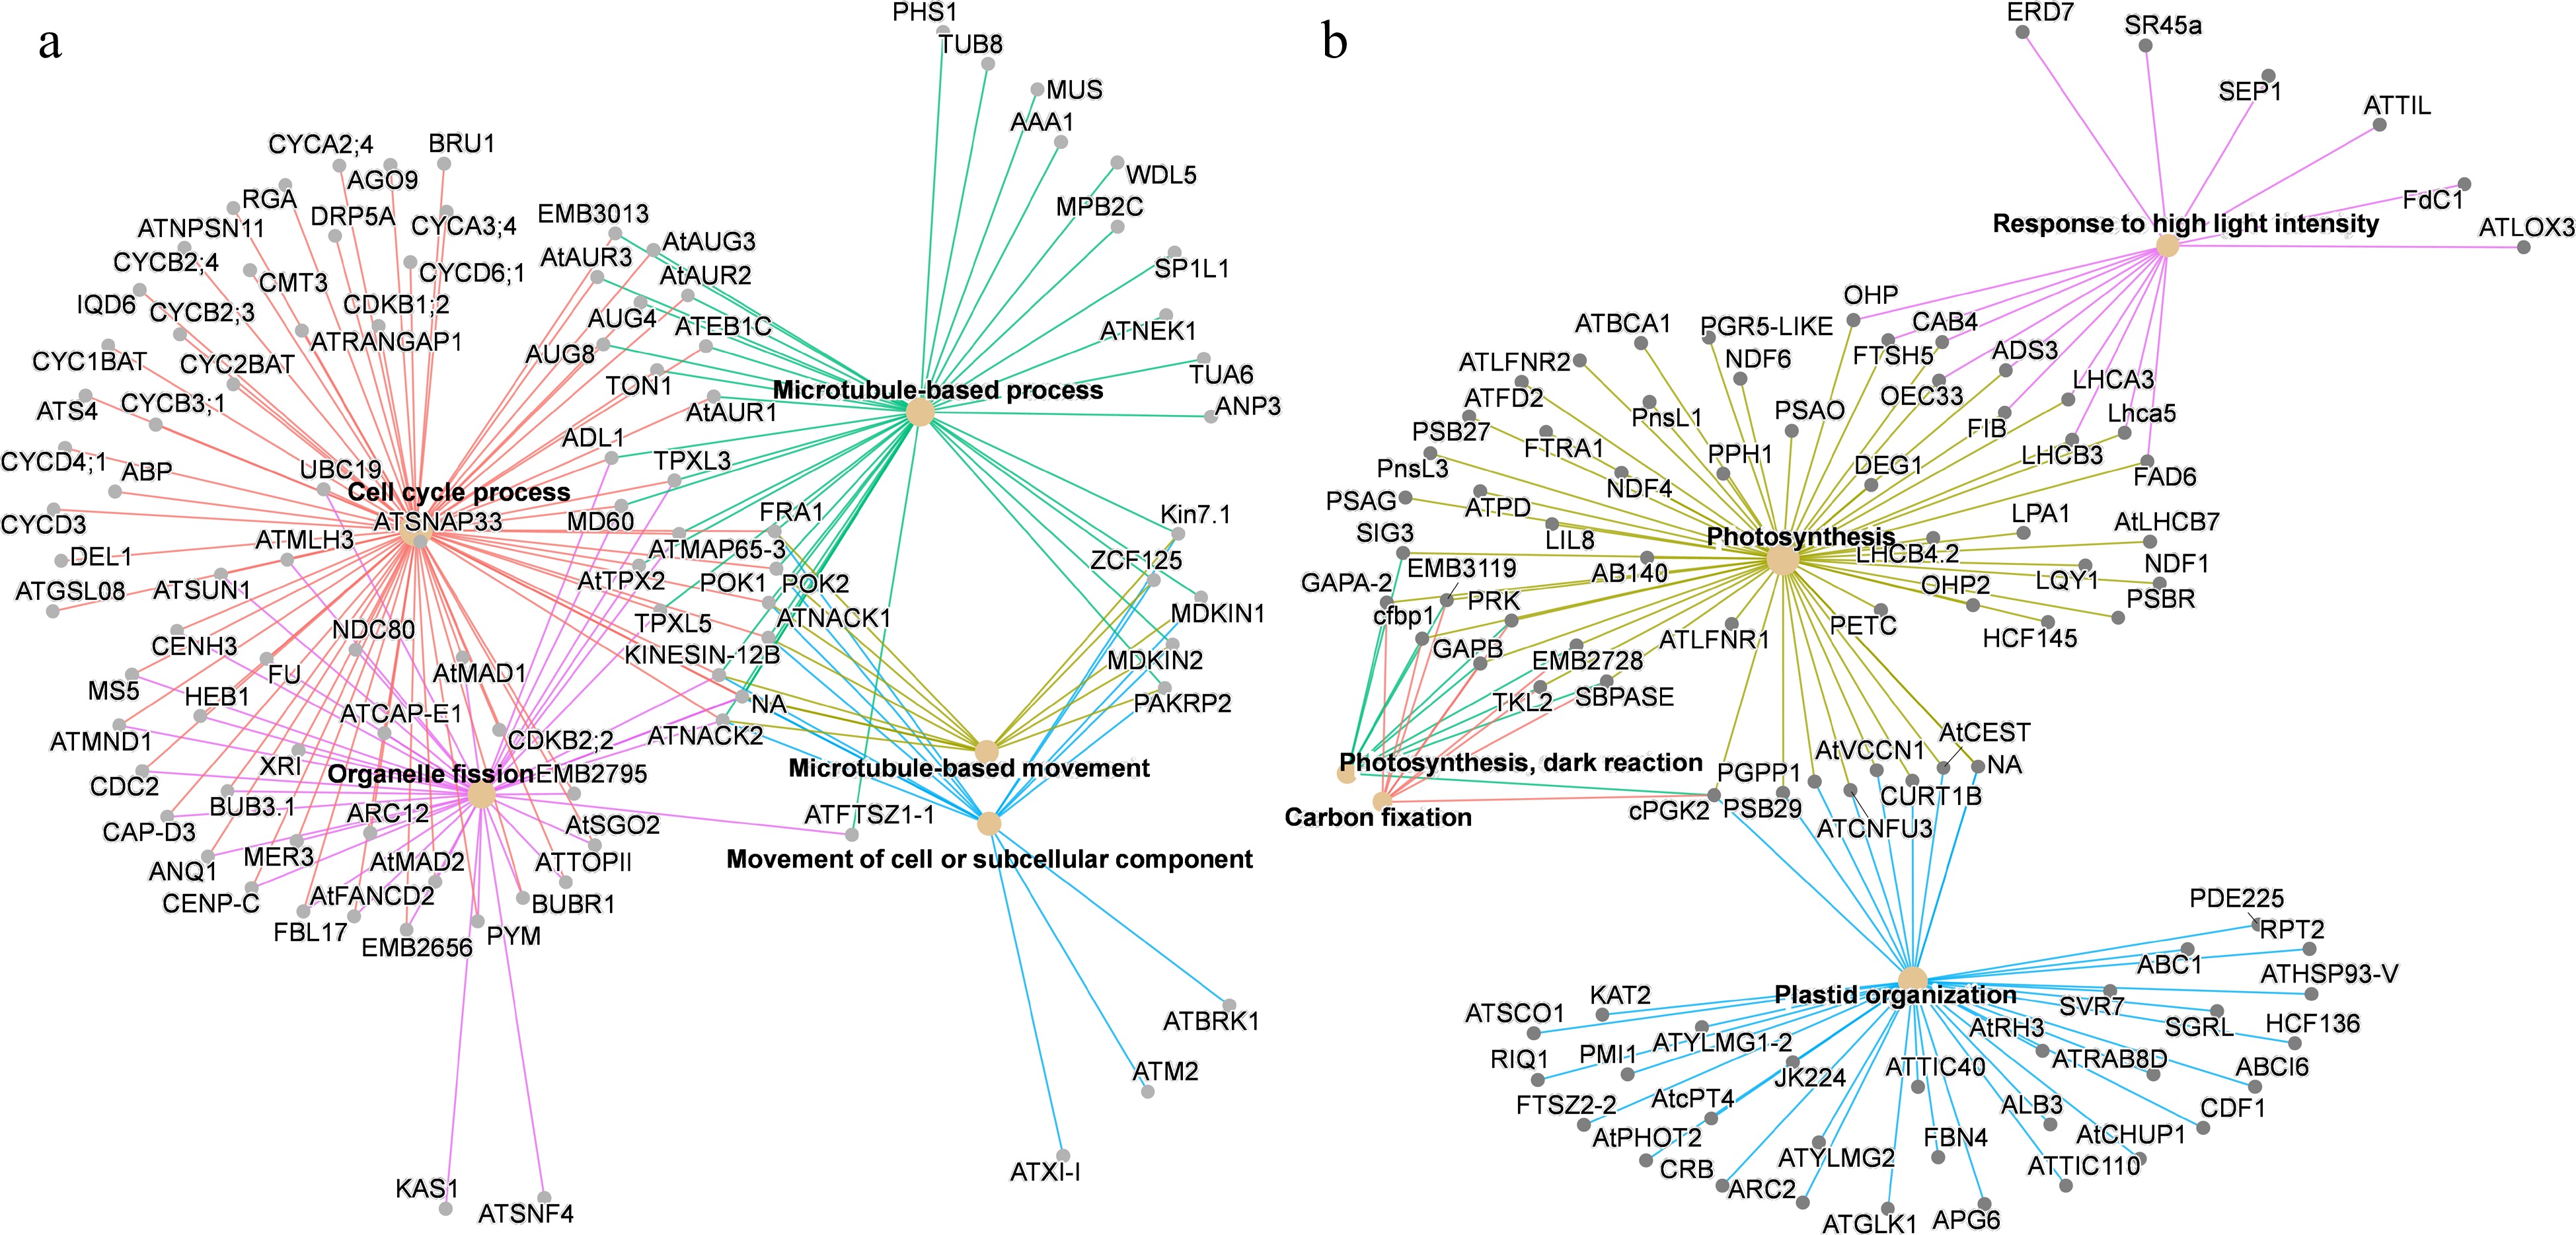
Figure 5.
Significantly enriched GO terms (biological process) of co-expression genes in (a) Cluster 6 and (b) Cluster 11. Only the top five enriched GO terms are shown. The color of lines represents different GO terms.
-
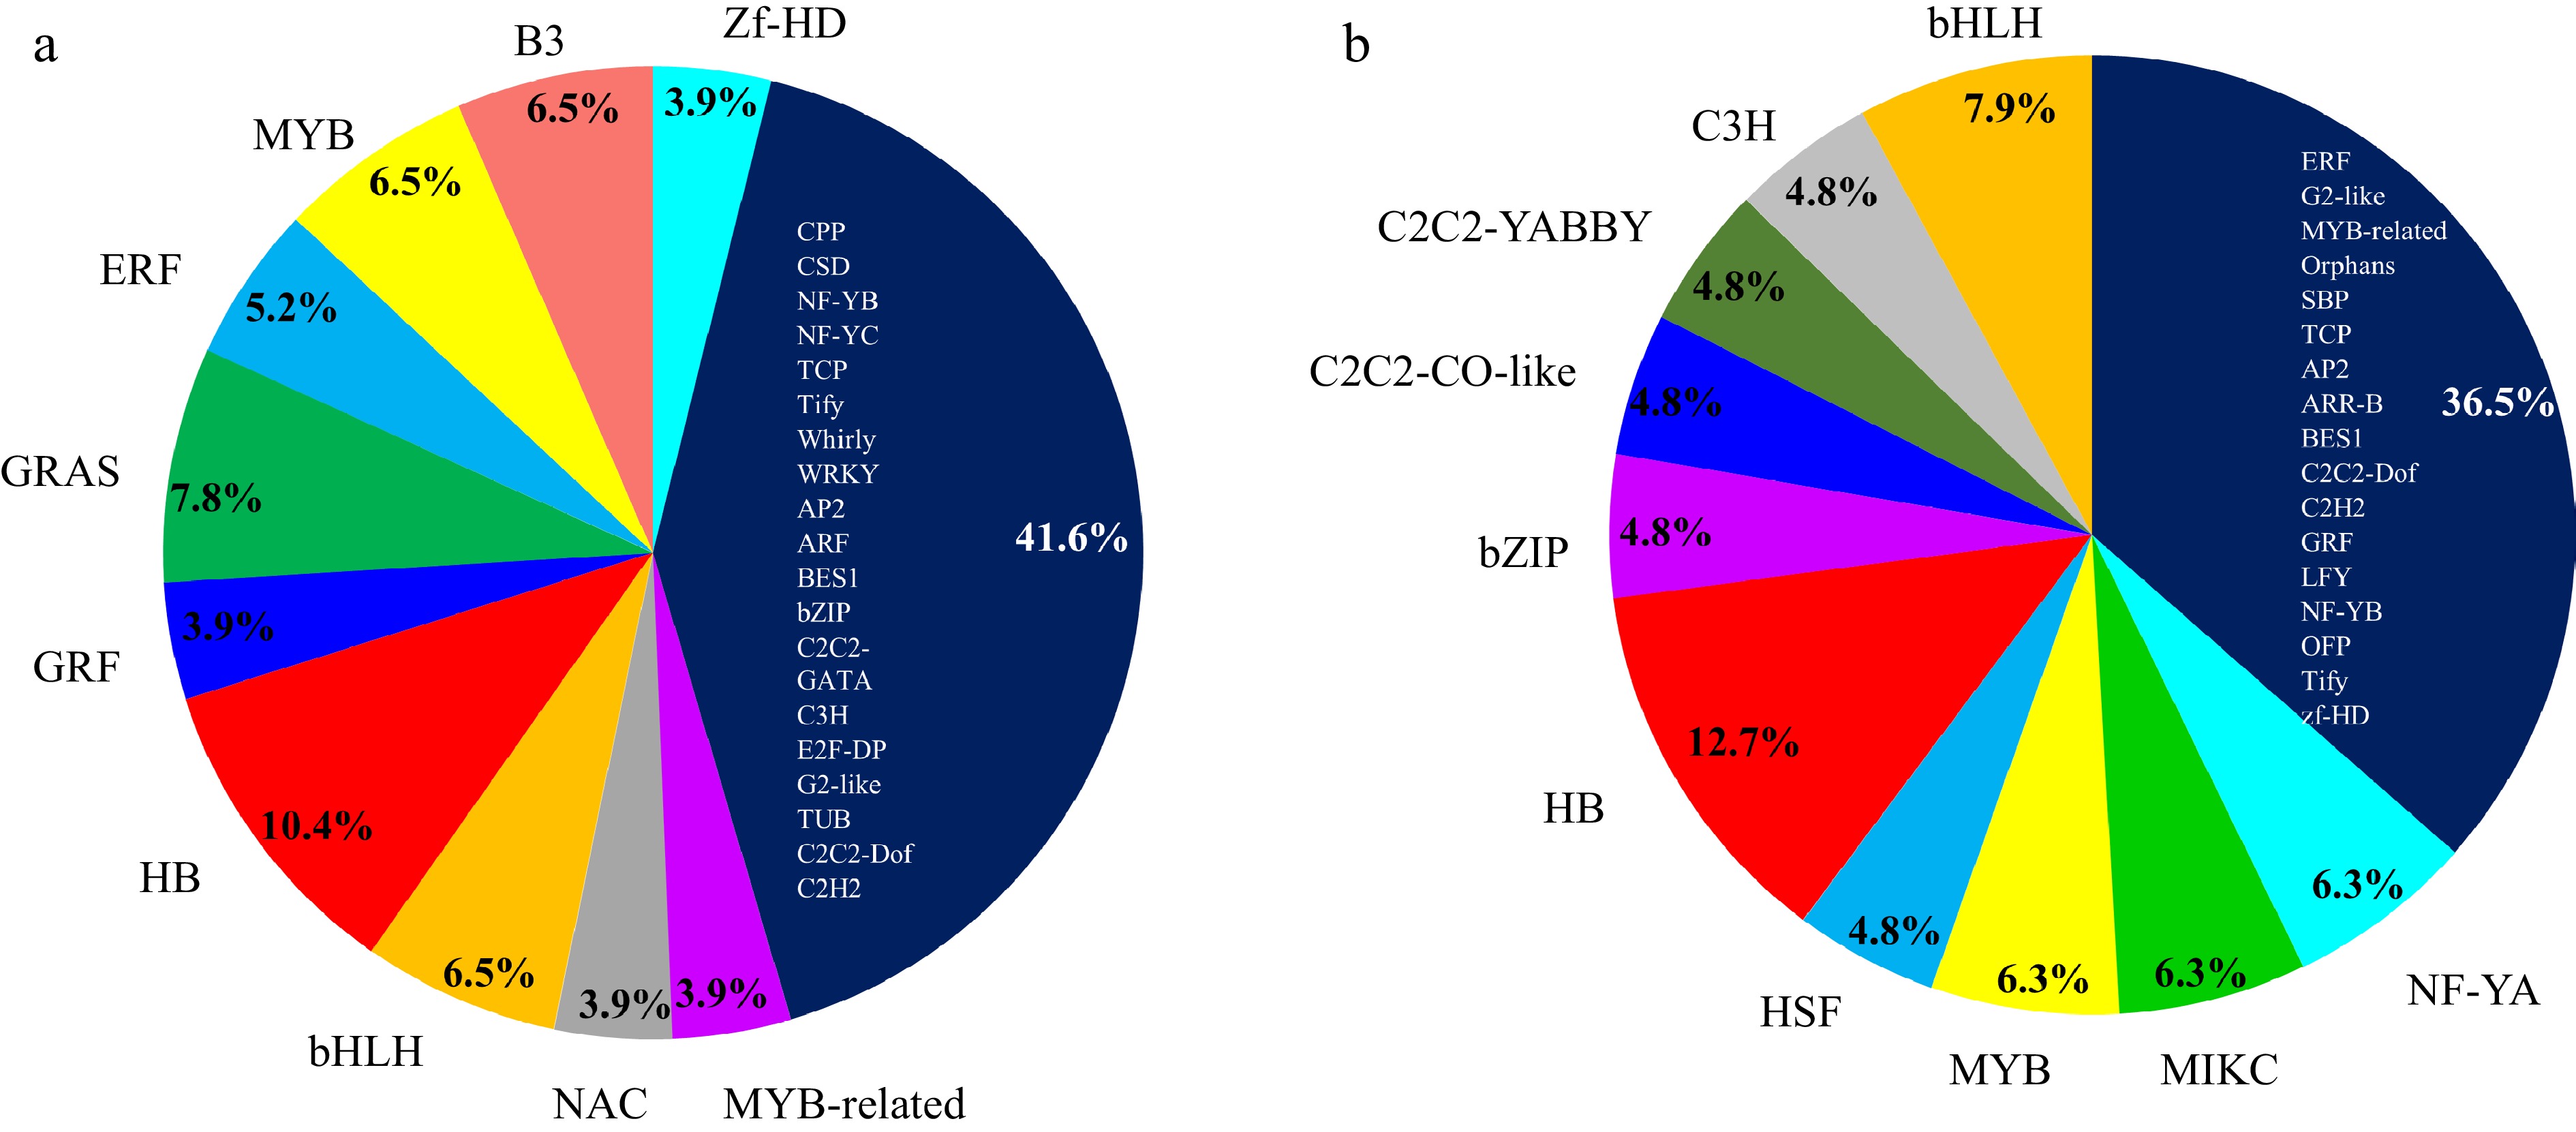
Figure 6.
Overview of distribution of TF families that were co-expressed with
(a) SmCYP78A10 in Cluster 6 and (b) SmCYP78A5 in Cluster 11. The Plant Transcription Factor Database v5.0 (http://planttfdb.gao-lab.org) was used to identify TFs in the eggplant genome. -
Gene ID Gene name Location Deduced polypeptide PSL Chr Start End Length (aa) MW (KDa) pI Smechr0101302 CYP78A6 Chr1 12640581 12643245 538 60.35 8.90 ER Smechr0302971 CYP78A5 Chr3 89886800 89889184 516 58.19 6.79 ER Smechr0400048 CYP78A7 Chr4 420566 422920 525 58.98 9.23 ER Smechr0500049 CYP78A8 Chr5 783272 785346 528 59.76 9.30 ER Smechr0502180 CYP78A9 Chr5 74969262 74971177 537 60.55 7.52 ER Smechr1100733 CYP78A10 Chr11 10534819 10536967 551 61.70 8.23 ER AT1G01190 CYP78A8 Chr1 83045 84946 541 60.91 8.22 ER AT1G13710 CYP78A5 Chr1 4702657 4704694 518 57.64 8.57 ER AT1G74110 CYP78A10 Chr1 27866667 27868368 538 60.18 7.84 ER AT2G46660 CYP78A6 Chr2 19153328 19155579 531 59.57 8.29 ER AT3G61880 CYP78A9 Chr3 22905868 22907958 556 62.62 9.04 ER AT5G09970 CYP78A7 Chr5 3111945 3114239 537 59.49 6.69 ER LOC_Os10g26340 CYP78A11/PLA1 Chr10 13658790 13660543 556 59.08 7.06 ER LOC_Os11g29720 CYP78A5 Chr11 17234285 17238178 539 59.64 10.19 ER LOC_Os03g04190 CYP78A9 Chr3 1920043 1921896 516 55.80 8.10 ER LOC_Os03g30420 CYP78A6/GL3.2 Chr3 17340415 17342284 516 56.05 9.00 ER LOC_Os03g40600 CYP78A7 Chr3 22567670 22568685 194 20.29 7.99 ER LOC_Os03g40610 CYP78A8 Chr3 22572706 22574008 308 32.84 10.12 ER LOC_Os07g41240 CYP78A13/GE Chr7 24713778 24715813 526 55.89 8.68 ER LOC_Os08g43390 CYP78A15/BSR2 Chr8 27420501 27422836 552 59.79 9.38 ER LOC_Os09g35940 CYP78A10 Chr9 20691306 20693116 554 60.74 9.07 ER Solyc01g096280 CYP78A6 Chr1 79622266 79624618 539 61.05 8.60 ER Solyc03g114940 CYP78A5/KLUH Chr3 59217389 59219730 517 58.38 6.21 ER Solyc05g015350 CYP78A8 Chr5 10475028 10479267 332 37.85 6.08 ER Solyc05g047680 CYP78A7 Chr5 58506390 58508292 532 60.49 9.20 ER Solyc10g009310 CYP78A9 Chr10 3224421 3227123 526 61.64 9.05 ER Solyc12g056810 CYP78A10 Chr12 62510941 62512676 537 60.71 7.50 ER Table 1.
Summary information of CYP78A family genes in eggplant, Arabidopsis, rice and tomato.
-
Gene ID TF family Arabidopsis
orthologBinding sequence Strand P value Smechr0402062 HB AT4G08150 CACTTCCCTTCTCTCTCTCT + 1.71E-05 Smechr0101299 HB AT2G46680 TCATTTATTGAAC − 9.07E-05 GGAATGATTGTAA − 9.88E-05 Smechr0402092 AP2 AT4G37750 CATCACAAATTCCAAAATCCC + 2.73E-05 AAACACTCTCCCCCACGTATA − 7.73E-05 Smechr0902218 CPP AT4G14770 TAAAATTTTAAAA − 7.34E-05 TGAAATTTAAAAA − 8.37E-05 TCAAATTTAAAAA + 8.47E-05 Smechr0801604 MYB CTTGAAGACCGTTGA + 9.42E-05 Smechr0201168 TCP AT3G27010 TTGCCCCAC + 5.27E-05 Table 2.
Candidate transcription factors binding promoters of SmCYP78As identified by PlantRegMap.
Figures
(6)
Tables
(2)