-
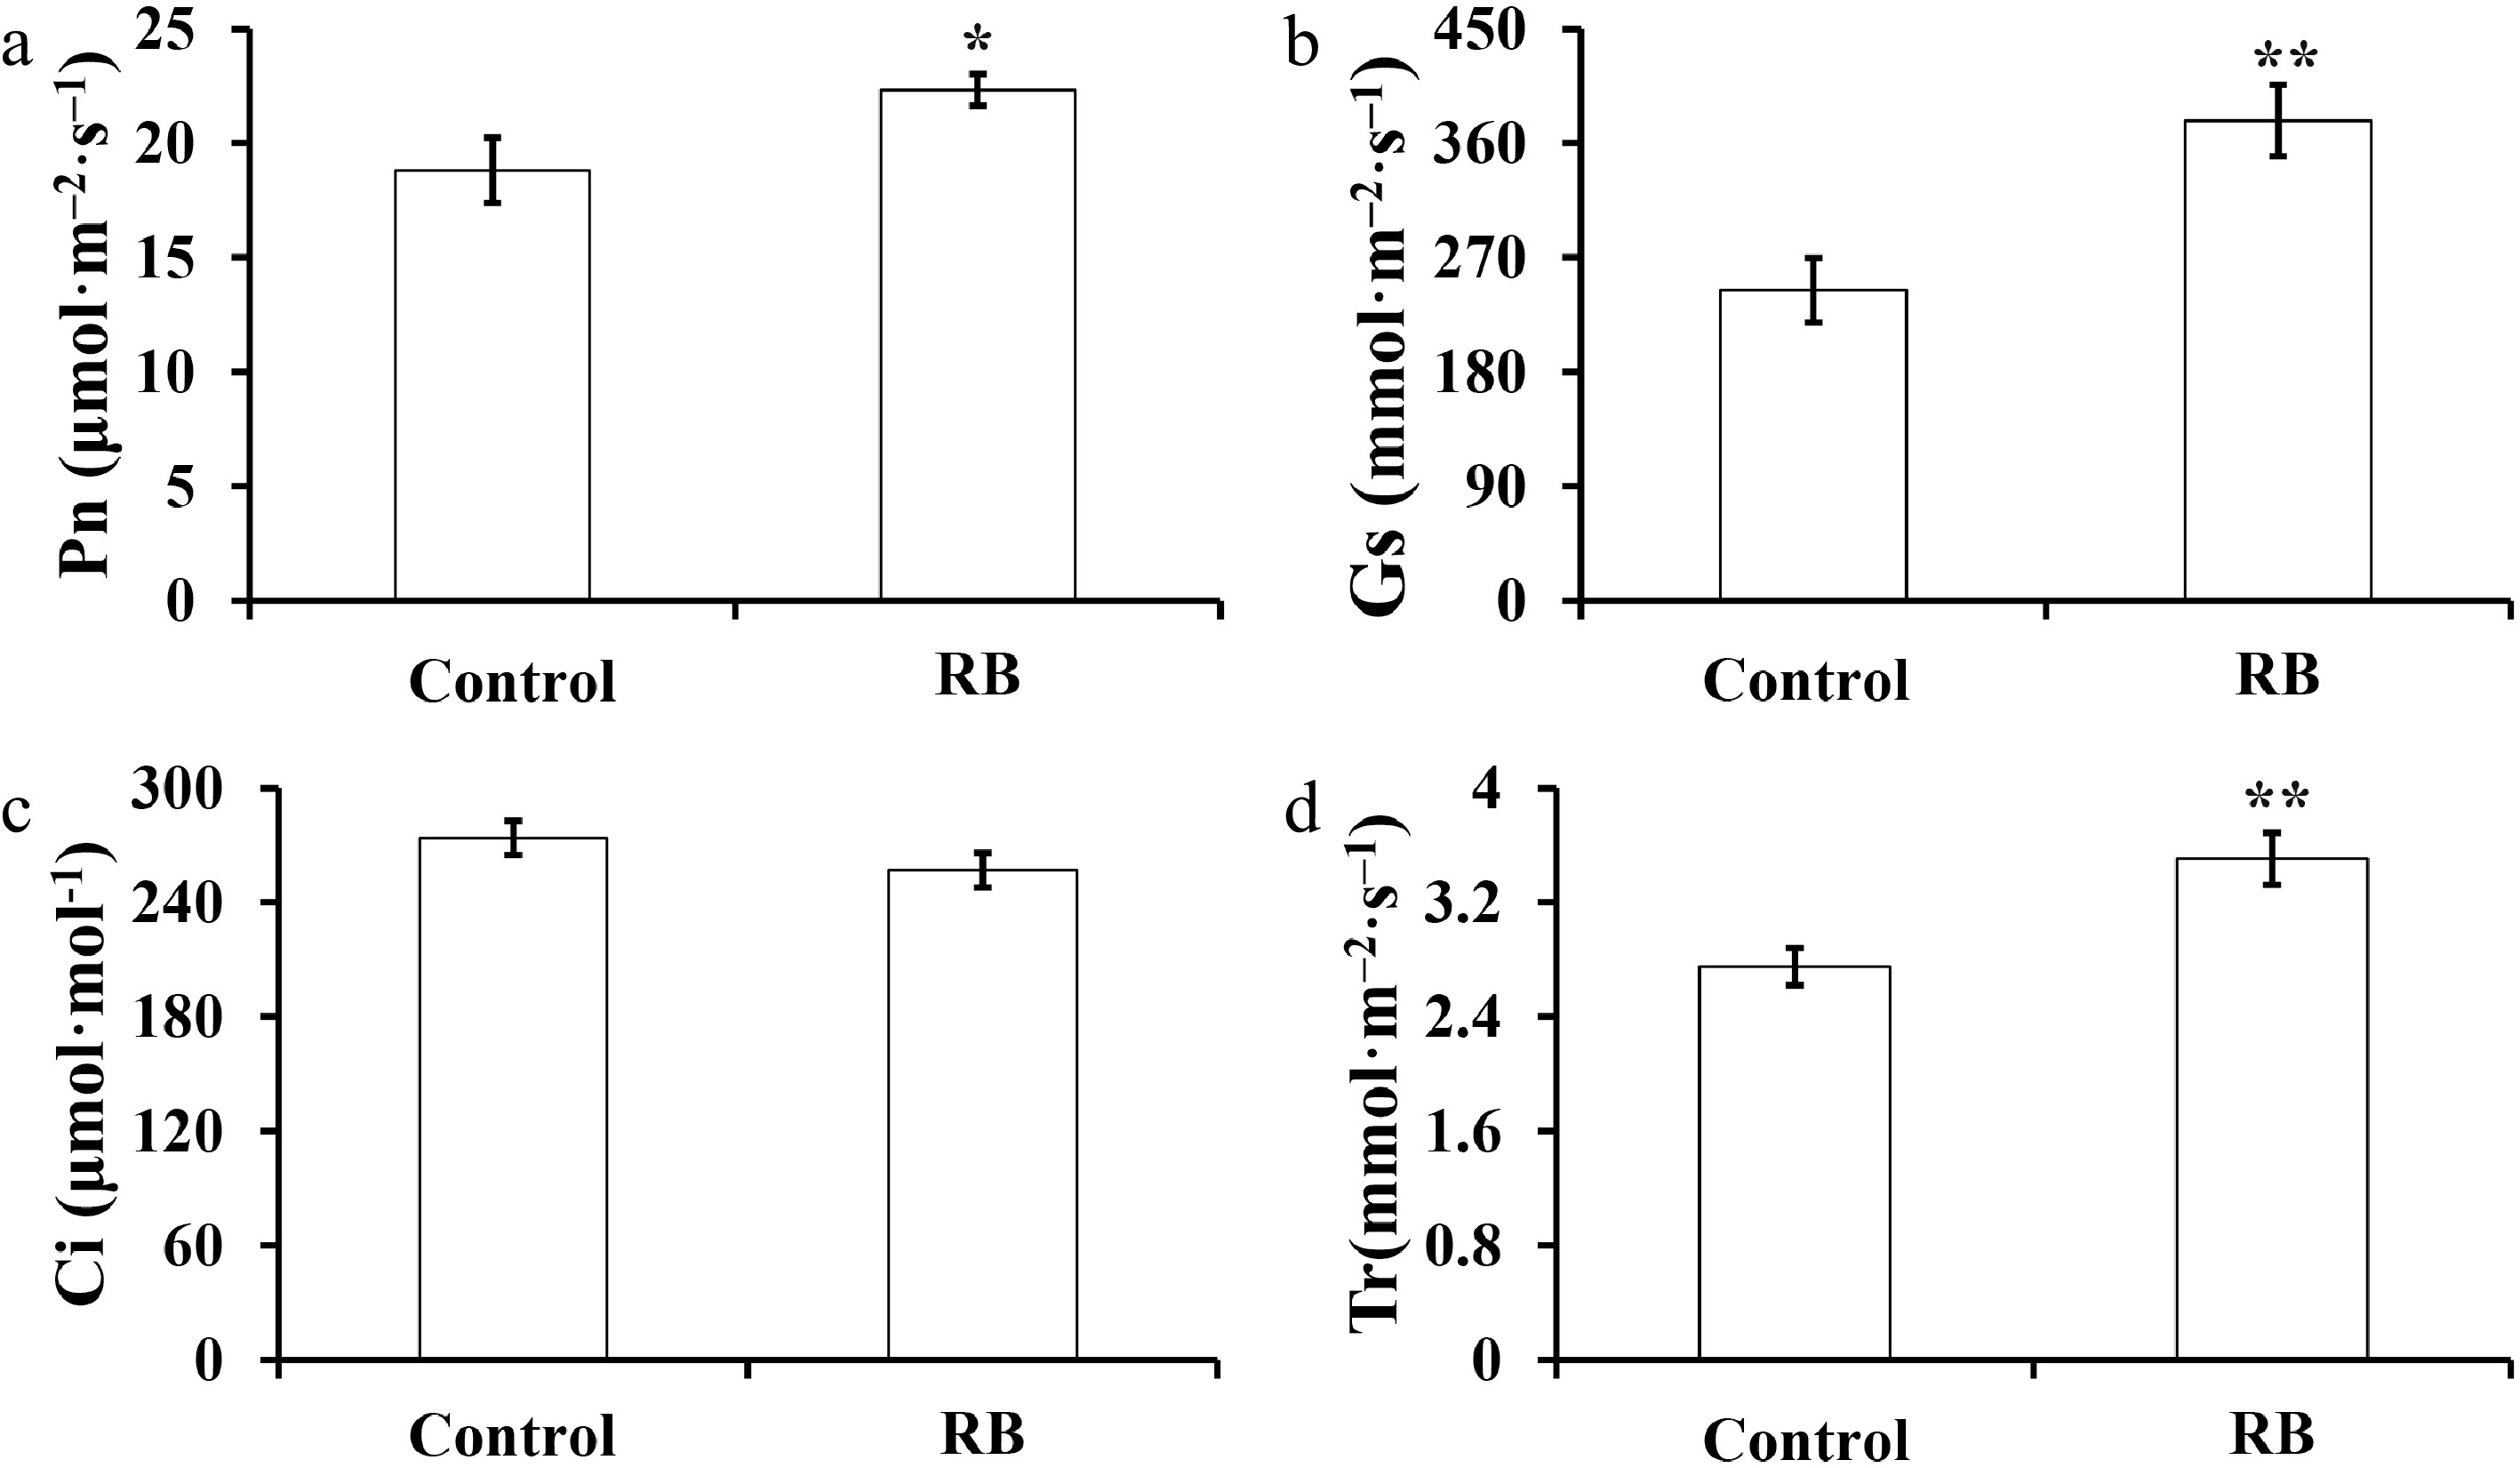
Figure 1.
Effect of R/B light supplementation on photosynthetic parameters of strawberry cultivar 'Yanli' cultured in solar greenhouse. (a)−(d) net photosynthetic rate (Pn), stomata conductance (Gs), intercellular CO2 (Ci), and transpiration rate (Tr). Vertical bars represent the SD. Statistical significance was measured using Student's t-test. (n = 20, * p < 0.05, ** p < 0.01).
-
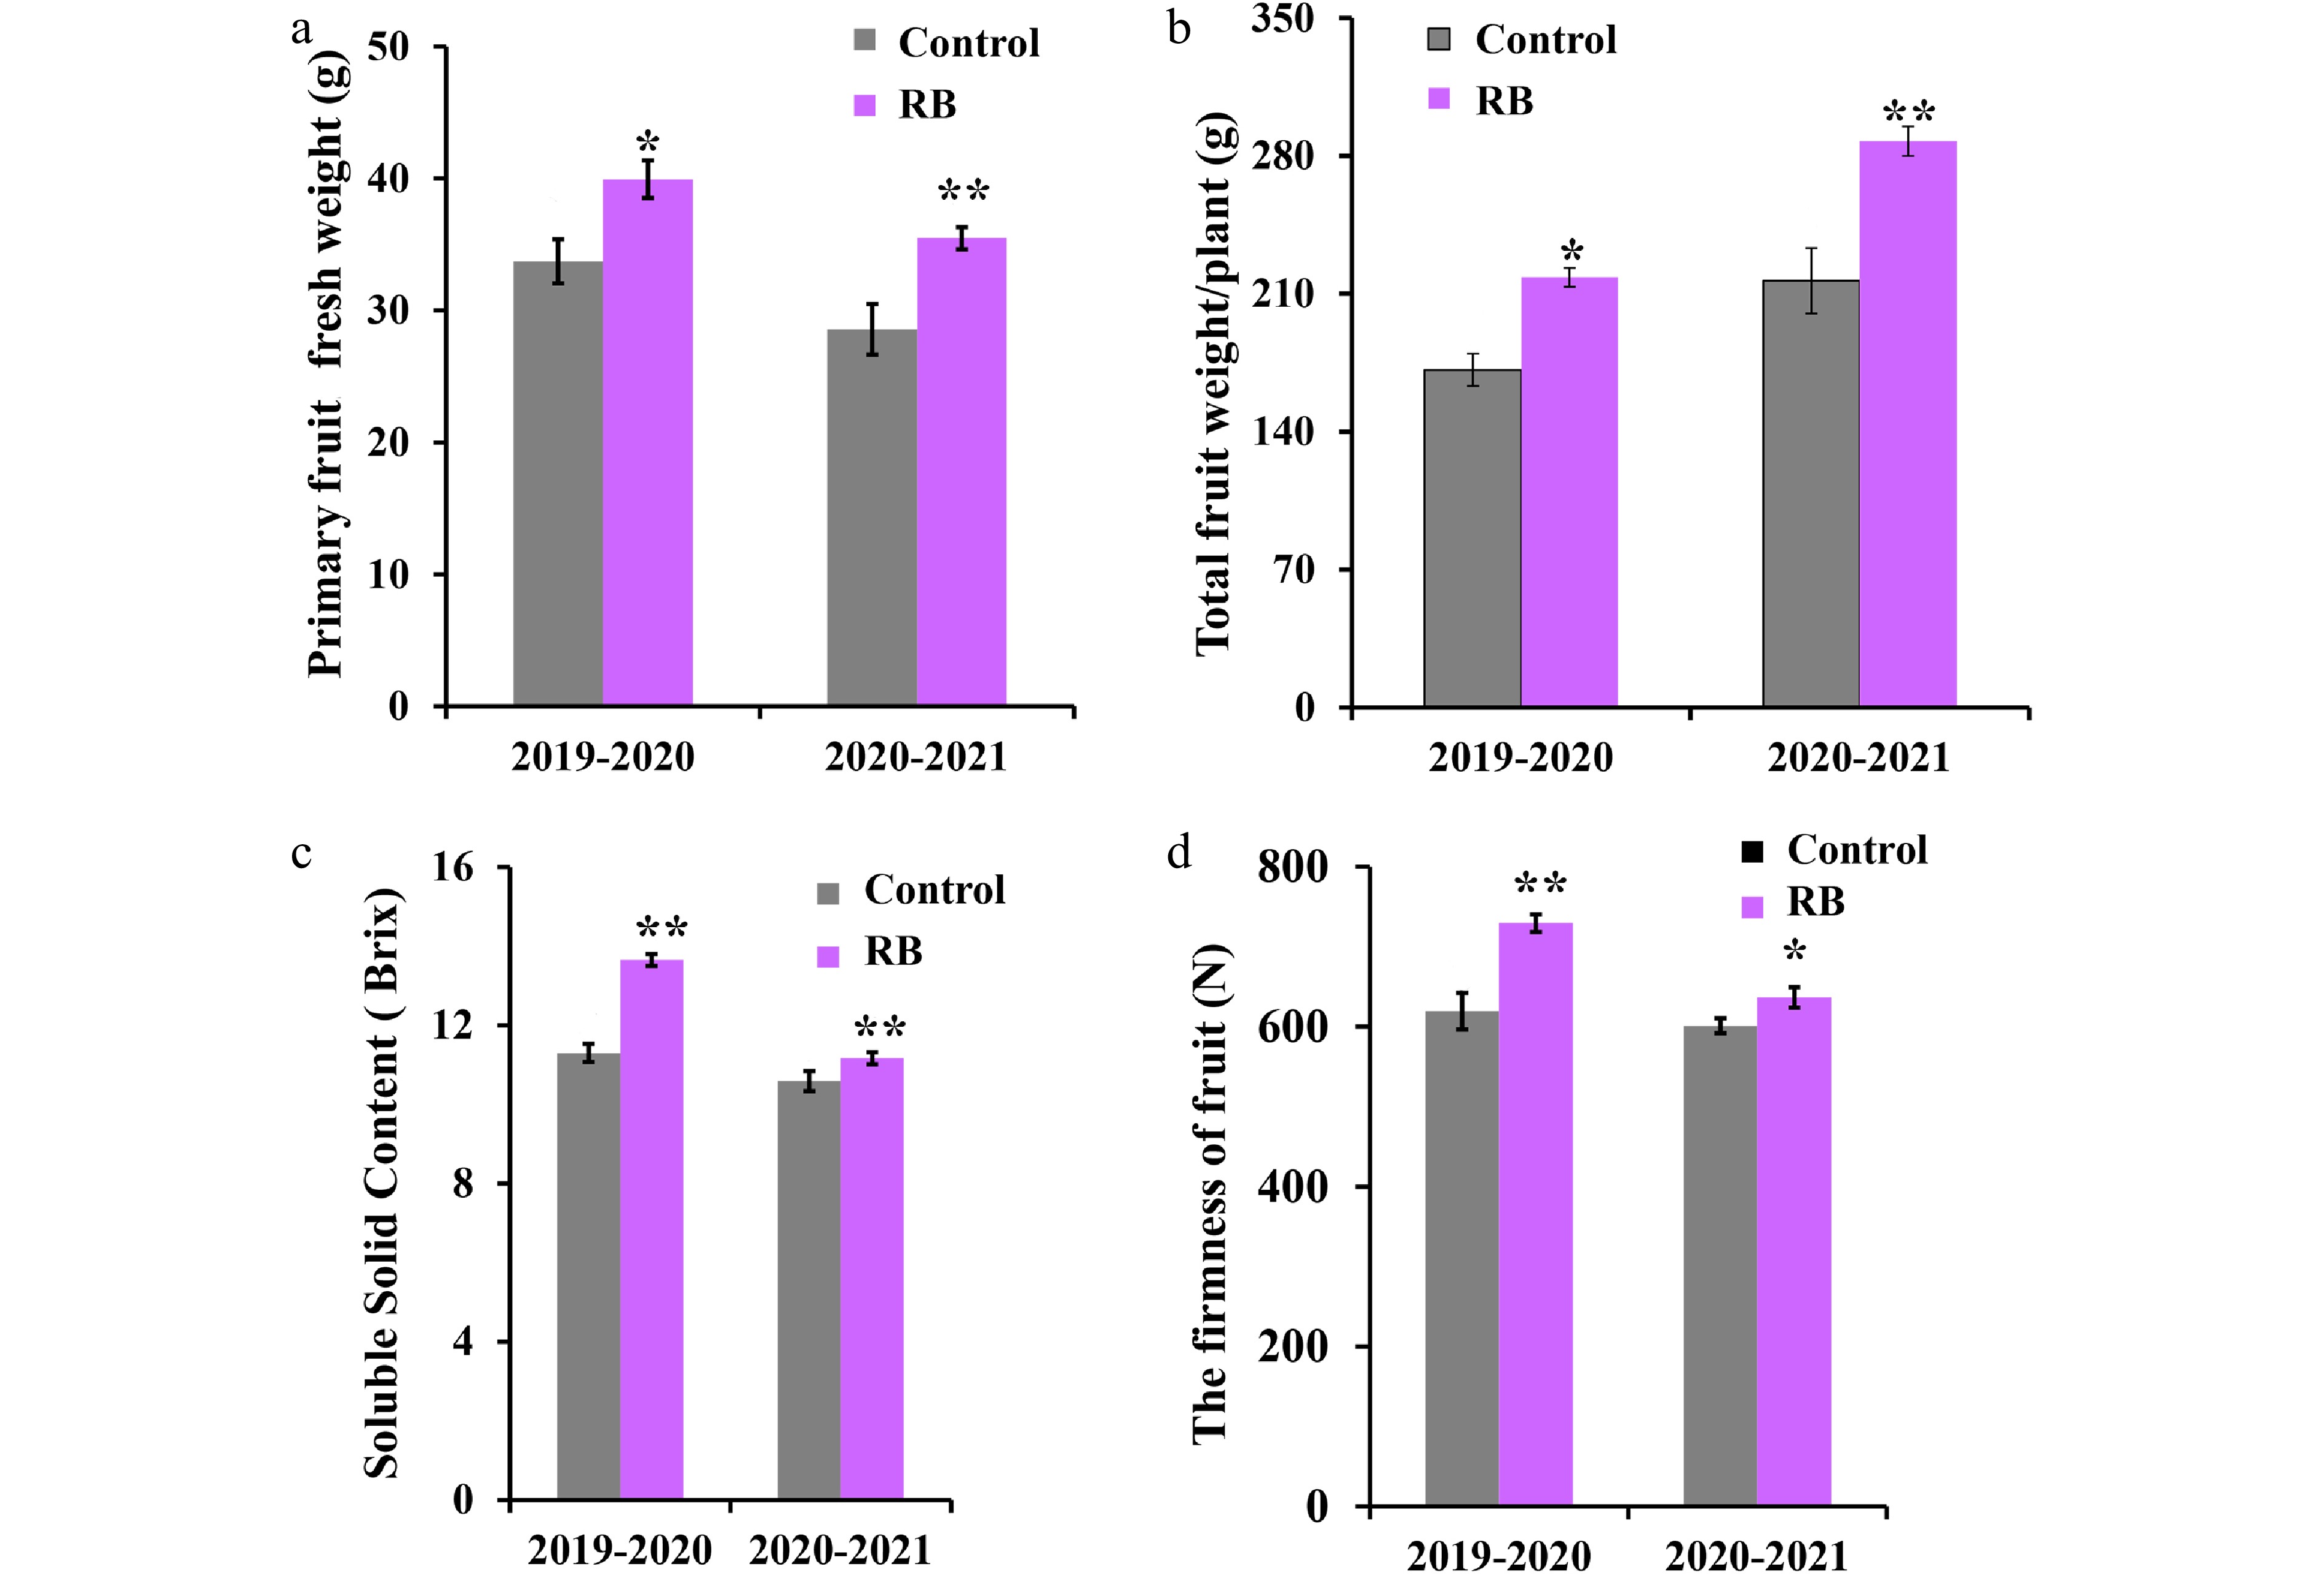
Figure 2.
Effect of R/B light supplementation on production and fruit quality of strawberry cultivar 'Yanli' cultured in solar greenhouse. (a) Primary fruit fresh weight, (b) total fruit weight/plant, (c) soluble solid content and (d) firmness of the 'Yanli' fruit under R/B light supplementation and control. Vertical bars represent SD. Statistical significance was measured using Student's t-test. (n = 20, * p < 0.05, ** p < 0.01).
-
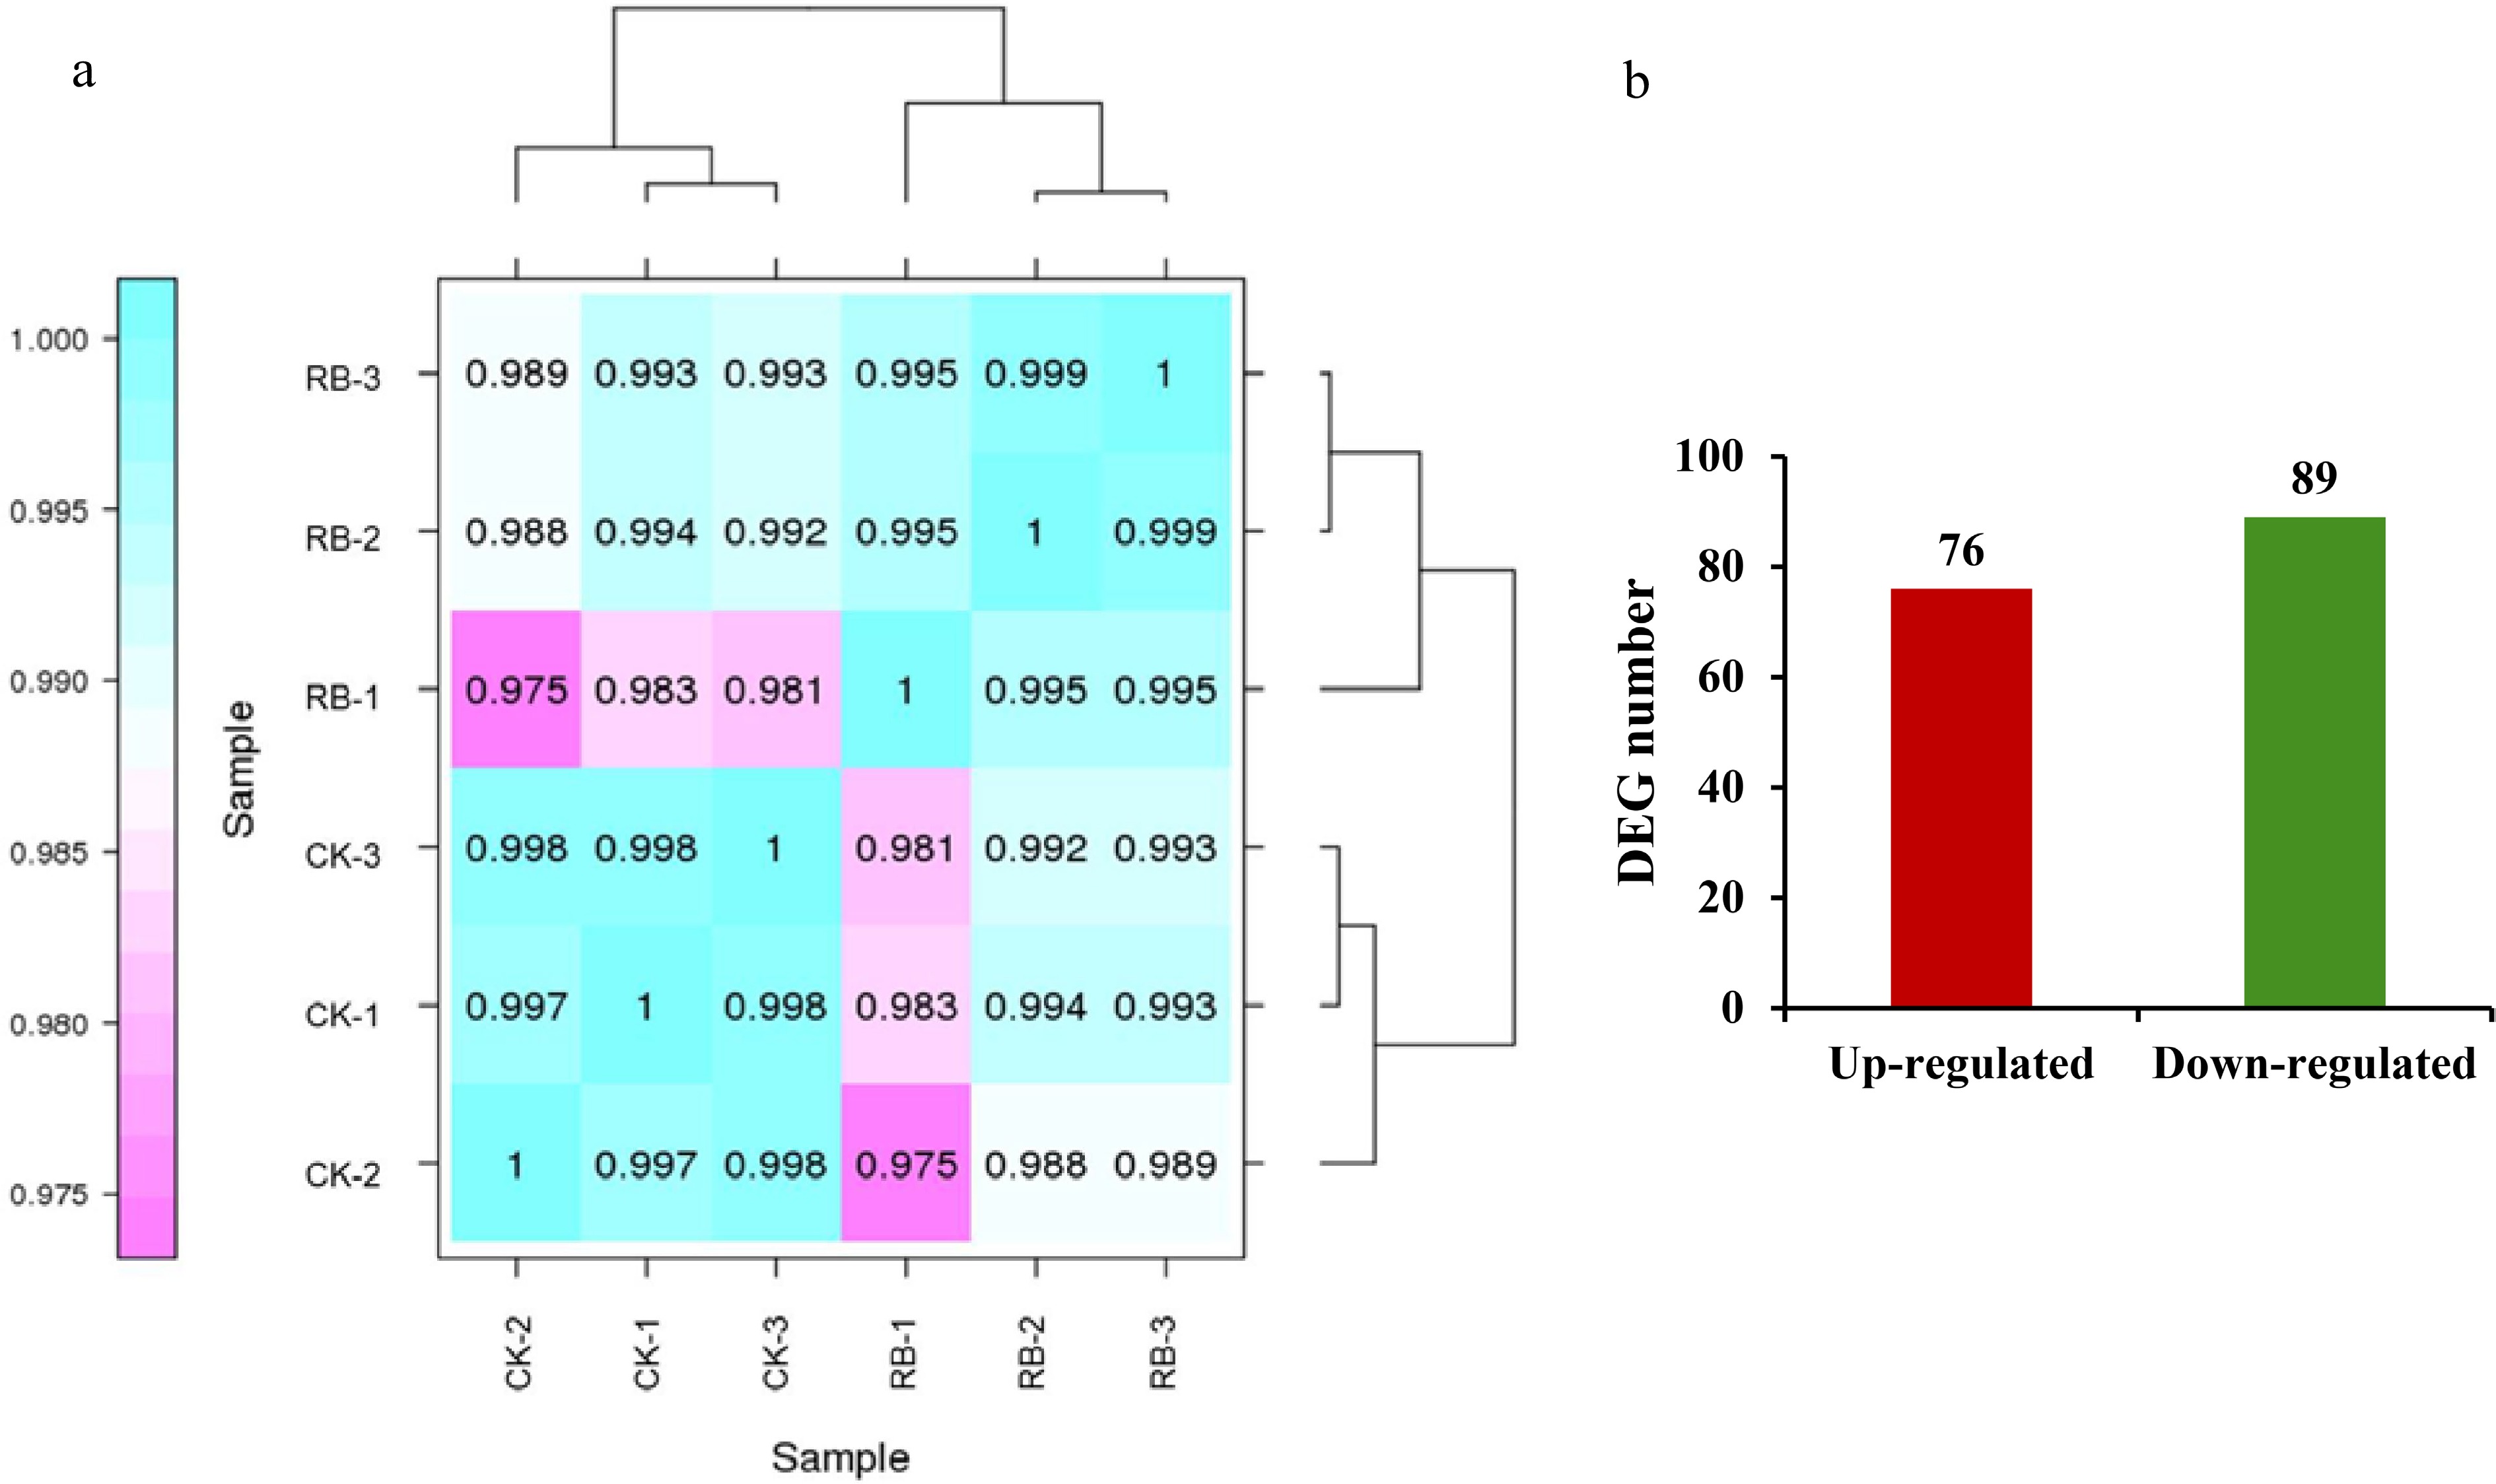
Figure 3.
Overview of the transcriptome sequencing under supplemental R/B lighting in strawberry leaves. (a) Pearson correlation between samples analysis. (b) Number of up- and down-regulated expressed genes. CK-1, CK-2, CK-3 are controls, RB-1, RB-2, and RB-3 are the experimental groups treated with supplemental R/B lighting.
-
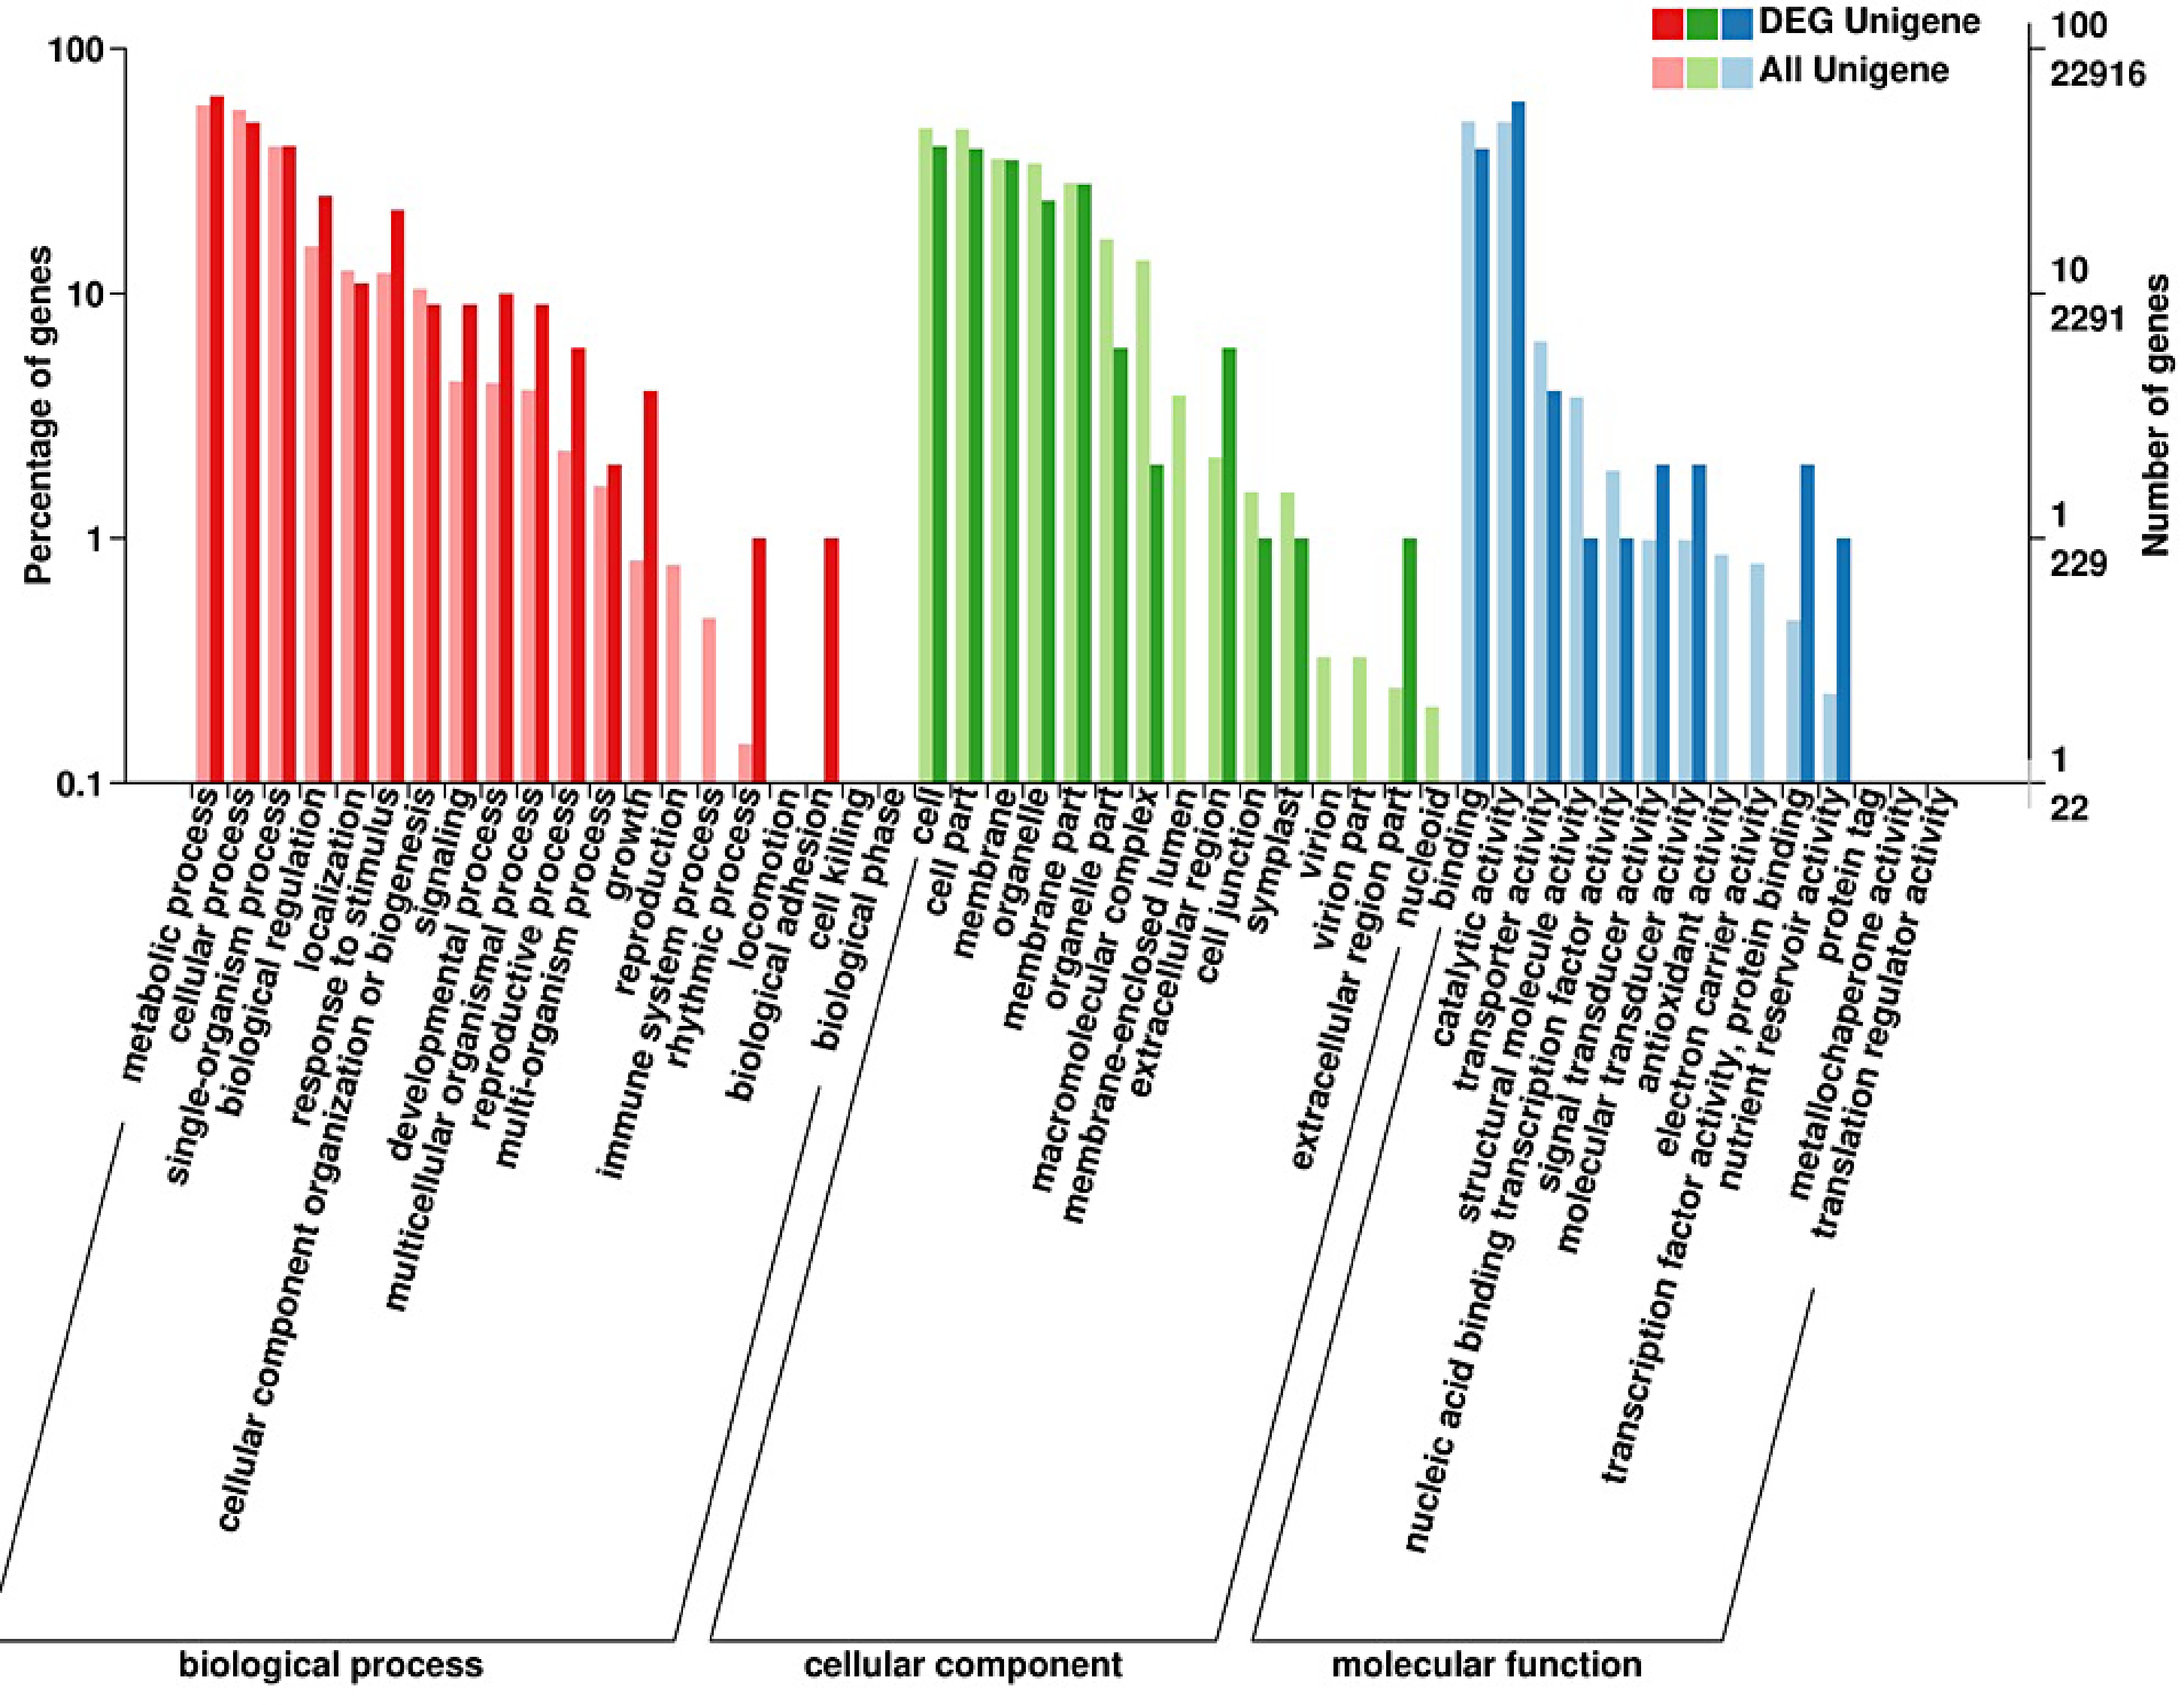
Figure 4.
Gene ontology (GO) enrichment analysis of differentially expressed genes in strawberry leaves by supplementing R/B light.
-
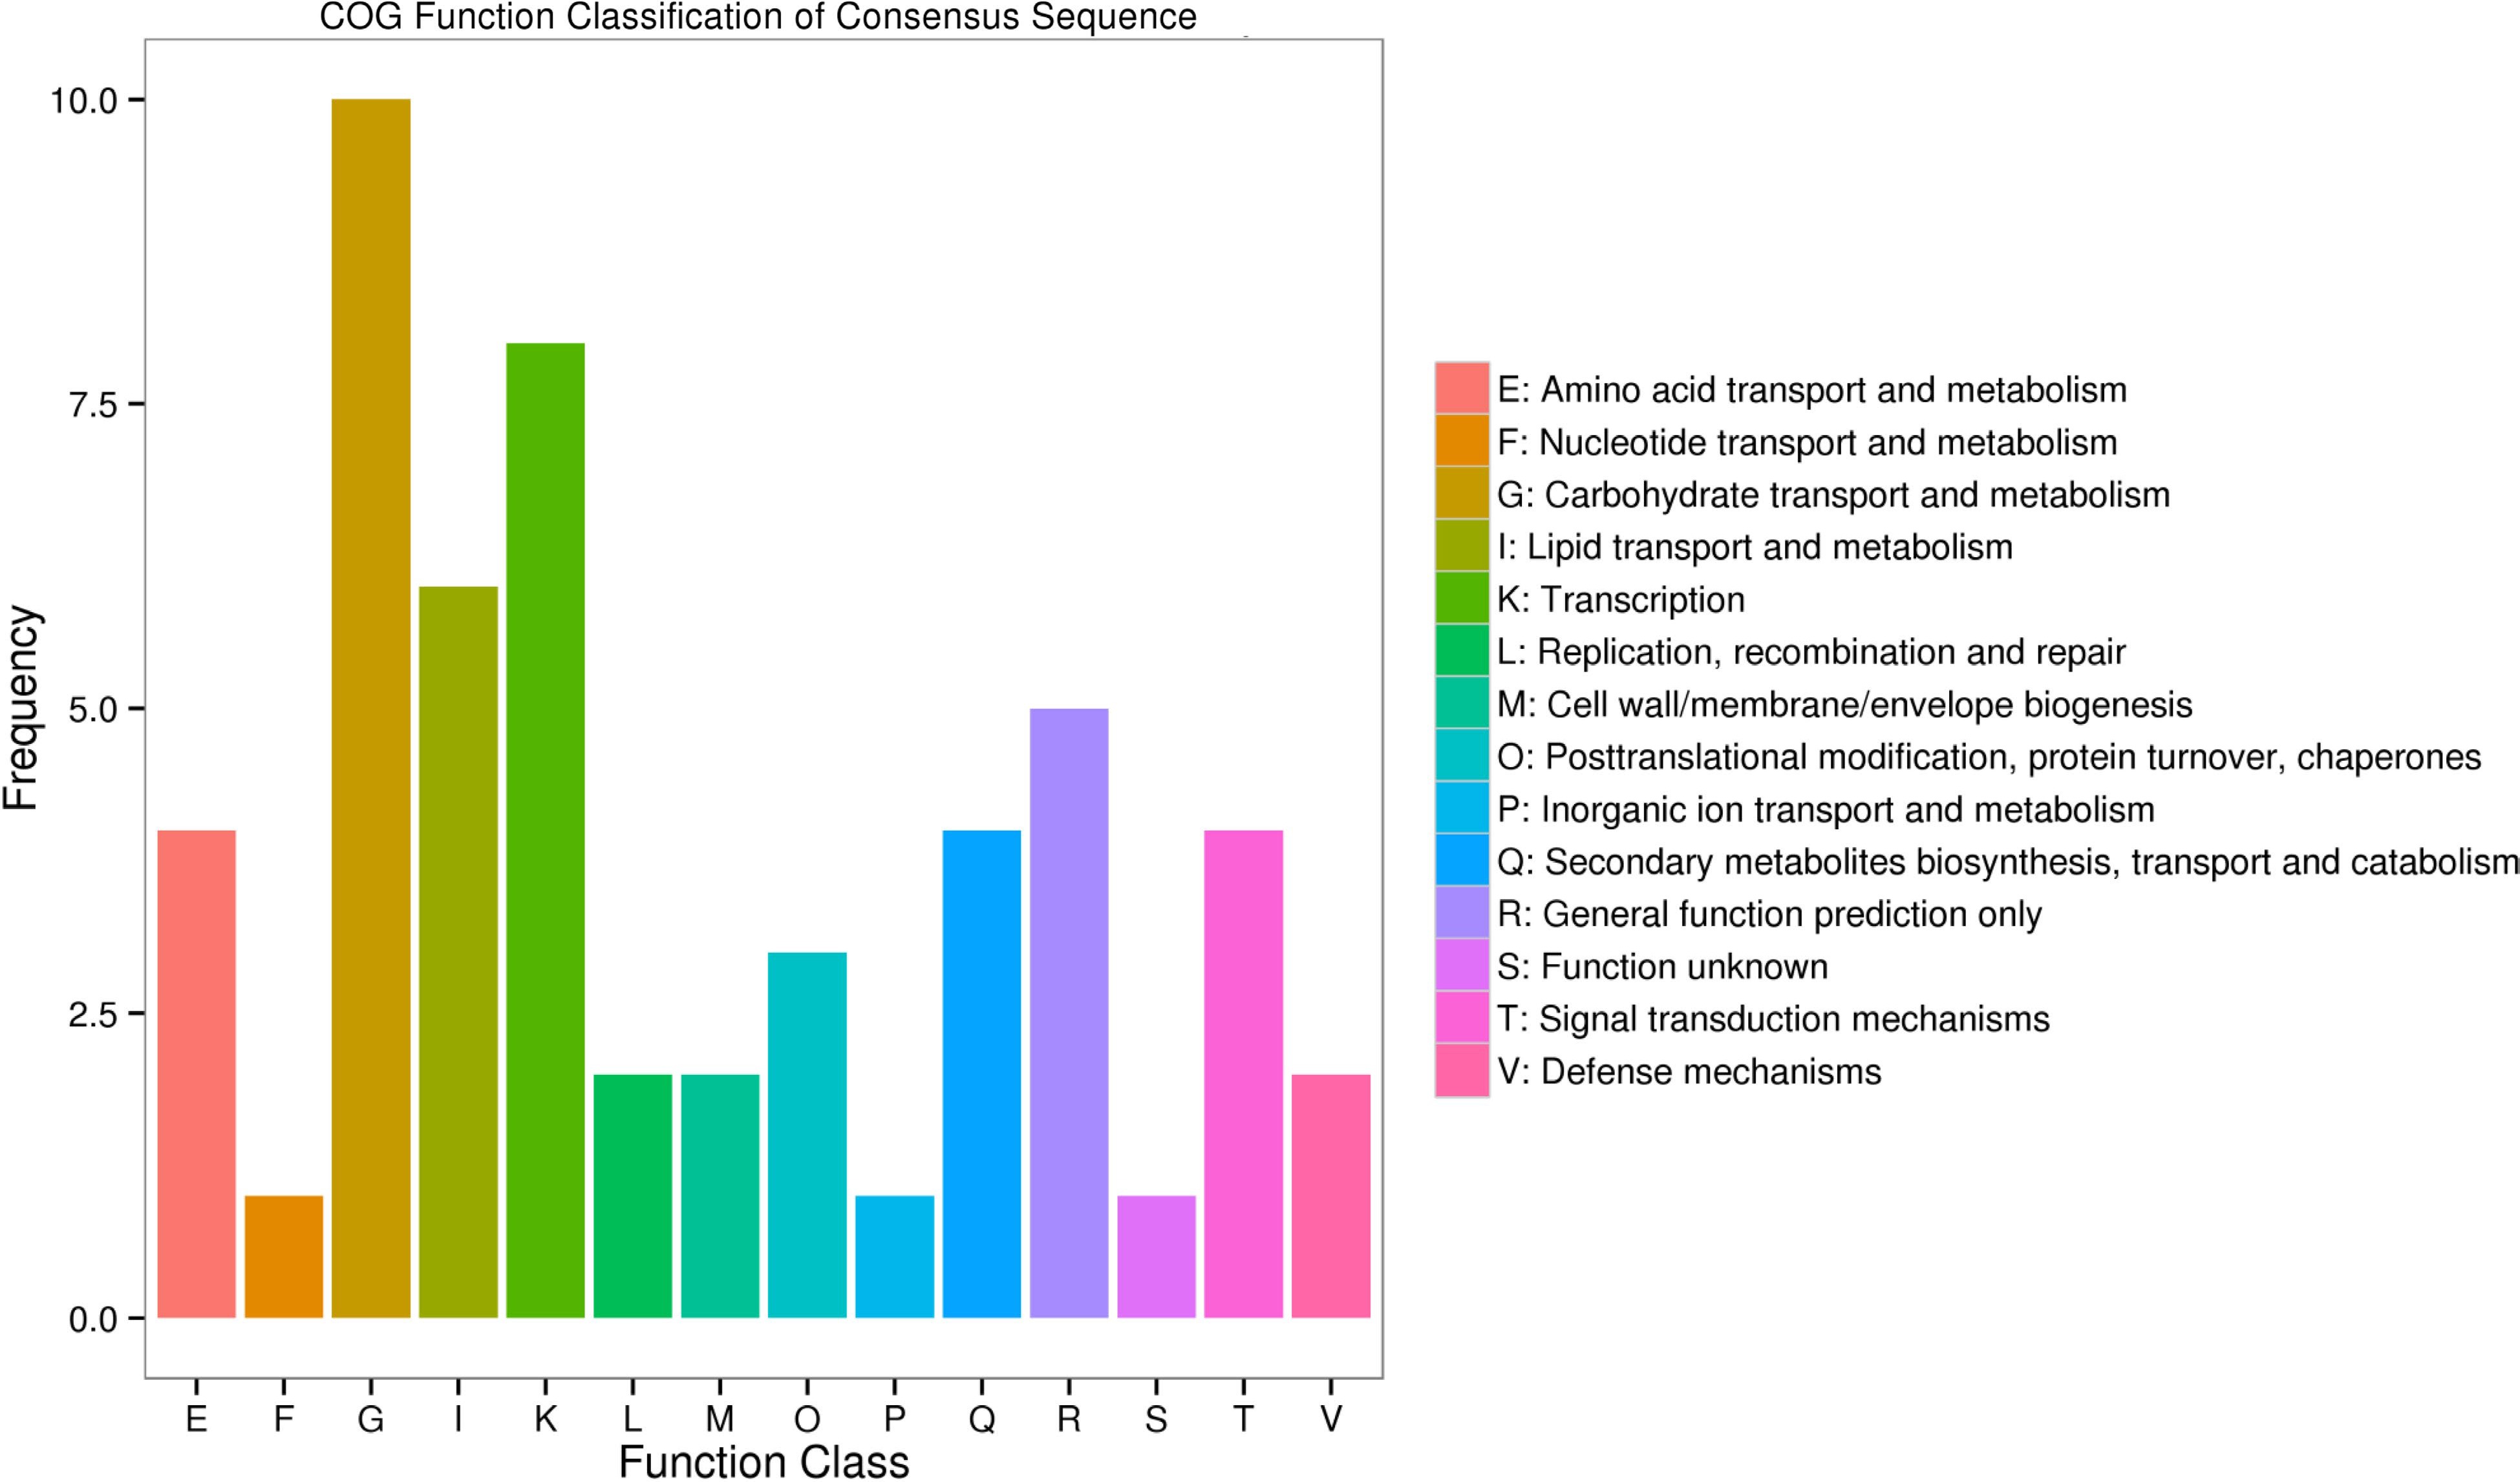
Figure 5.
Histogram of COG (cluster of orthologous groups) classification.
-
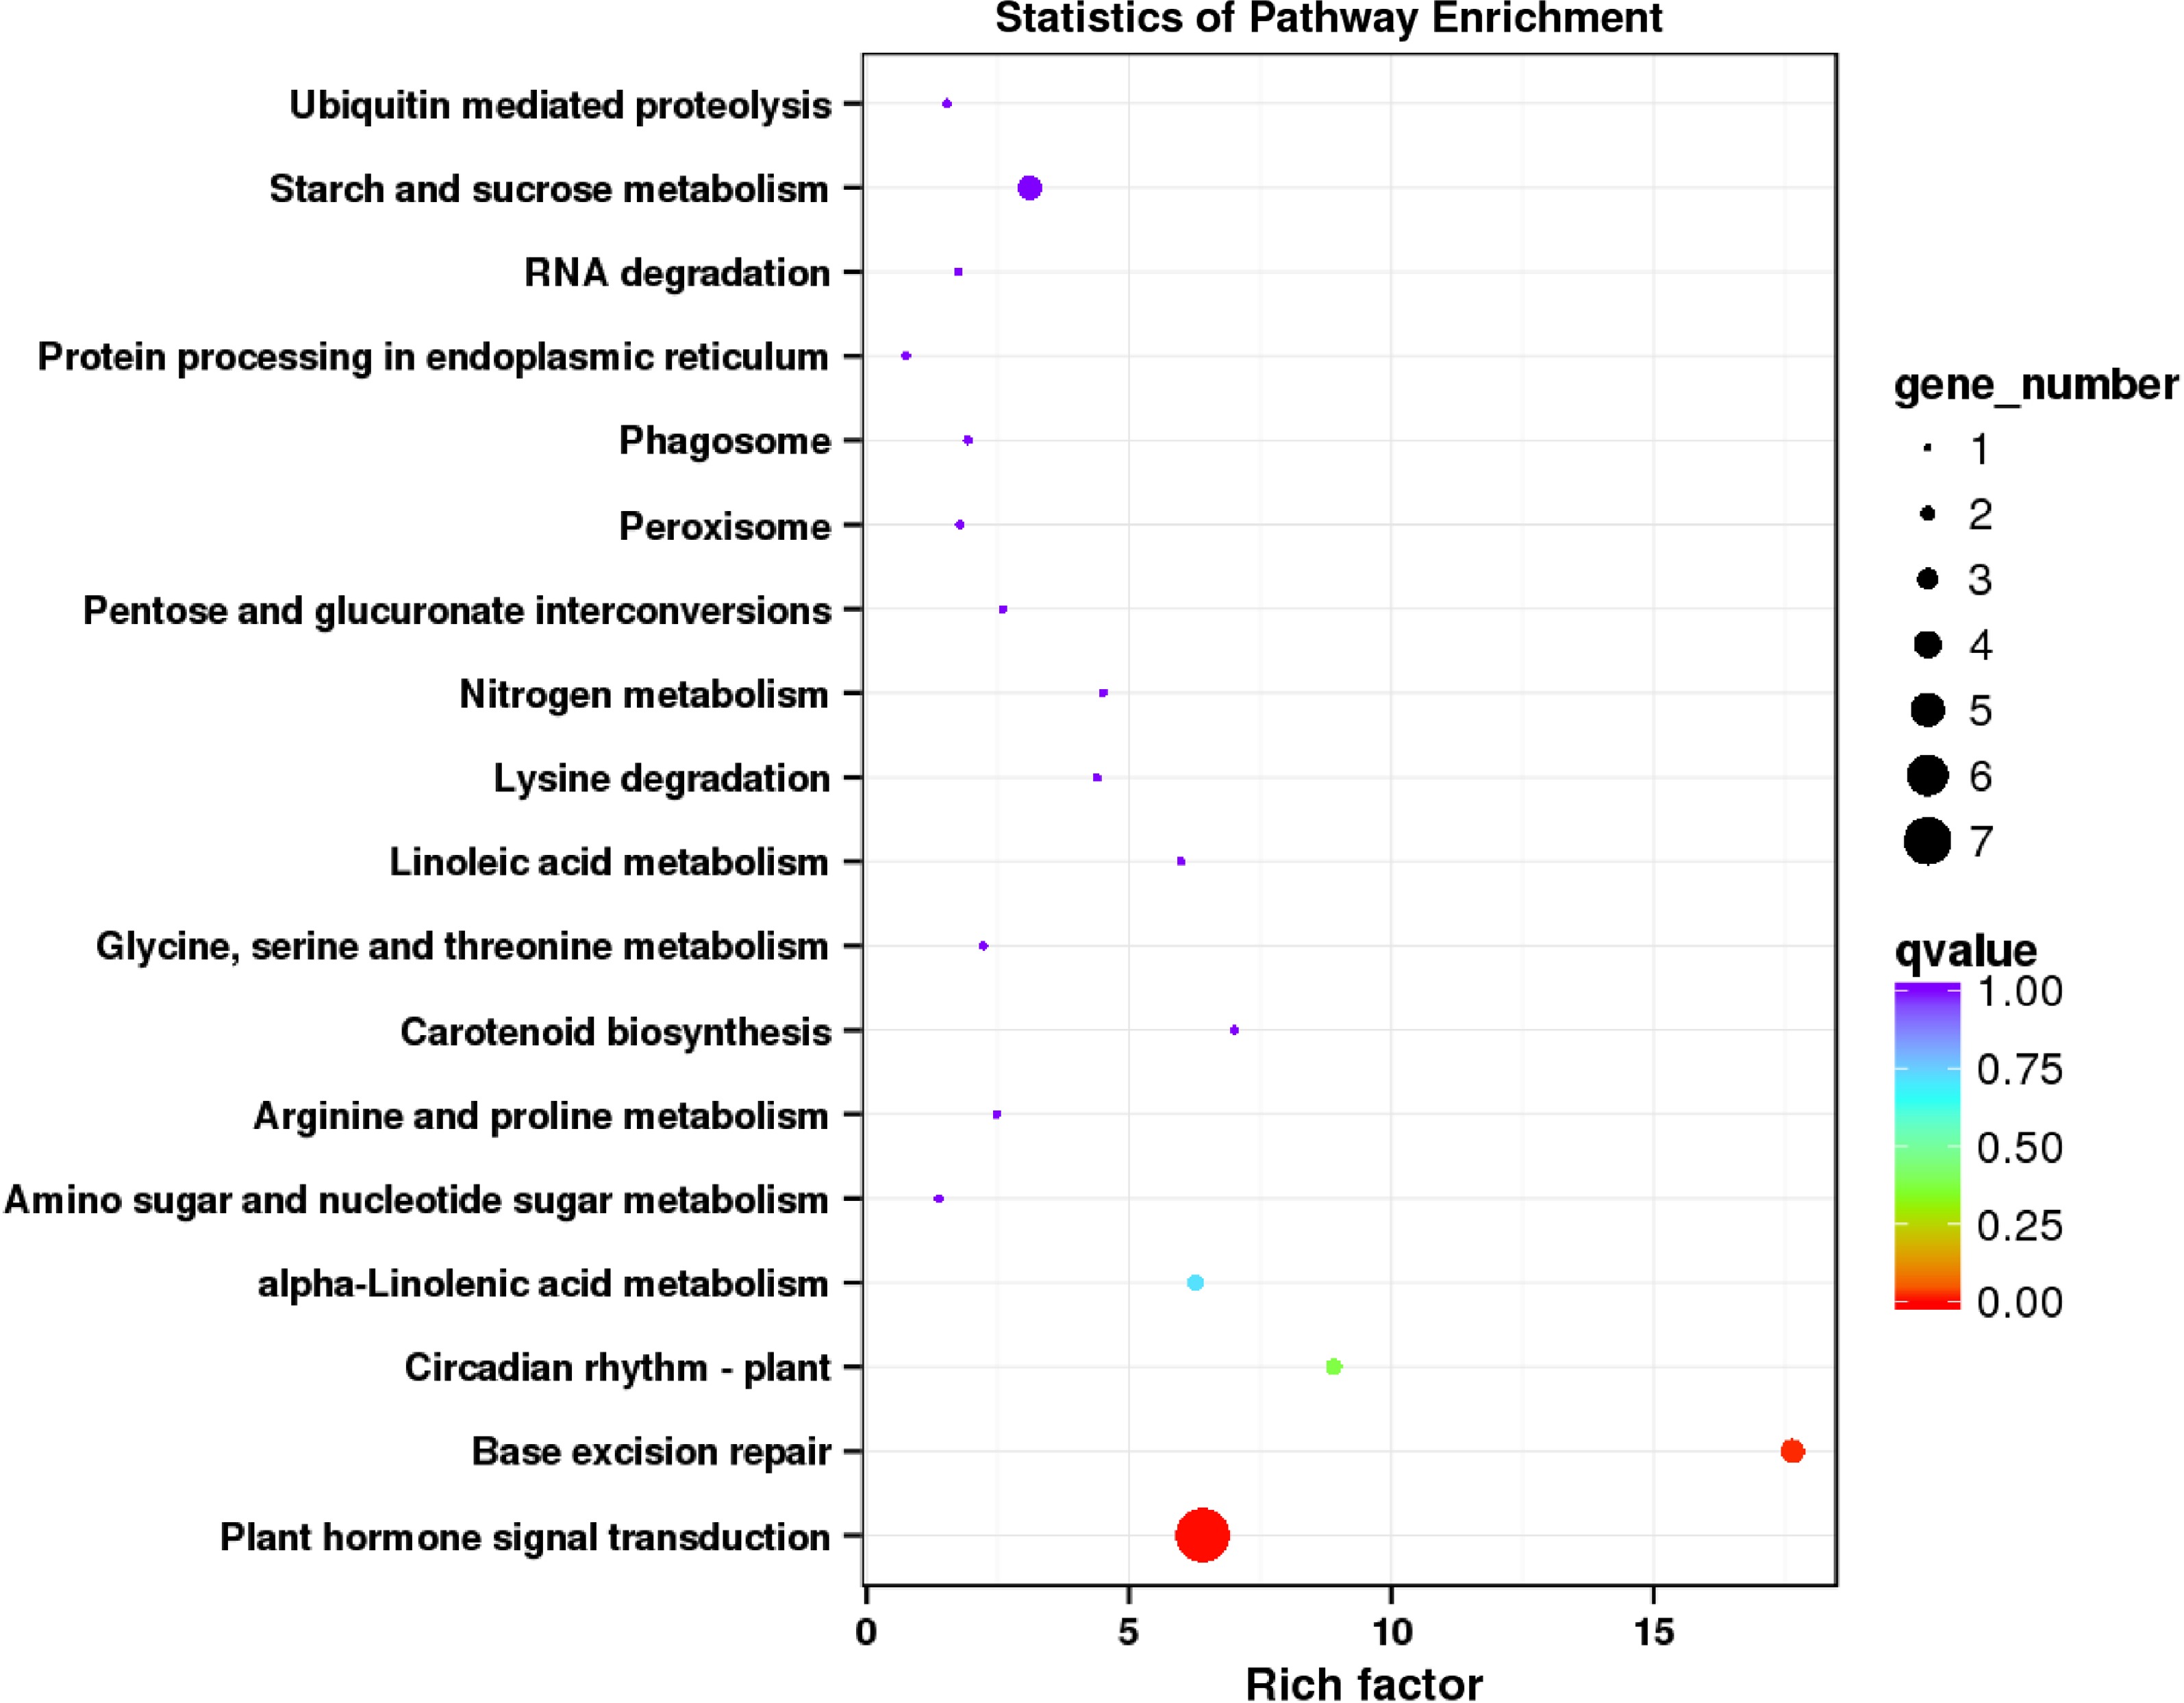
Figure 6.
KEGG enrichment analysis of DEGs regulated by supplementing R/B light in strawberry leaves.
-
Year Light treatment Plant height (cm) Crown diameter (cm) 2019−2020 Control 17.11 22.42 RB 19.96** 30.86** 2020−2021 Control 17.22 24.23 RB 19.44* 26.04** Table 1.
Comparison of strawberry plant height and crown diameter between red/blue light supplementation and control.
-
Sample Clean read number Clean base number GC contenta % ≥ Q30b Mapped reads Mapped ratio CK-1 21,222,192 6,353,022,700 46.98% 93.13% 16,779,949 79.07% CK-2 23,479,291 7,032,924,424 47.23% 93.04% 18,653,551 79.45% CK-3 20,727,367 6,210,109,126 47.07% 93.09% 16,668,439 80.42% RB-1 20,756,139 6,218,258,998 46.63% 93.07% 16,594,034 79.95% RB-2 20,842,520 6,243,435,538 46.83% 92.85% 16,552,377 79.42% RB-3 21,022,752 6,297,302,712 46.99% 93.09% 16,753,654 79.69% a GC Content: the percentage of G and C bases in the total bases in clean reads. b % ≥ Q30: the percentages of clean reads with Phred qualities scores over 30. Table 2.
Summary of transcriptome data.
-
Gene family TF name Annotation function logFC Regulation NAC NAC72 NAC domain-containing protein 72-like 0.931857 Up PRR PRR95 Two-component response regulator-like PRR95 0.893515 Up MYB LHY Protein LHY-like 0.657352 Up bZIP TRAB1 bZIP transcription factor TRAB1 0.651141 Up ZAT ZAT8 Zinc finger protein ZAT8-like 0.628283 Up CDF CDF3 Cyclic dof factor 3 0.641524 Up CO CO16 Zinc finger protein CONSTANS-LIKE 16 −0.66291 Down bZIP bZIP34 Basic leucine zipper 34 −1.07449 Down bZIP bZIP61 Basic leucine zipper 61-like −0.9109 Down bHLH bHLH63 Transcription factor bHLH63 −0.66341 Down BBX BBX21 B-box zinc finger protein 21 −0.67538 Down PAR PAR1 Transcription factor PAR1 −0.61181 Down MYB RAD Transcription factor RADIALIS-like −0.61324 Down Table 3.
List of differentially expressed TF genes.
Figures
(6)
Tables
(3)