-
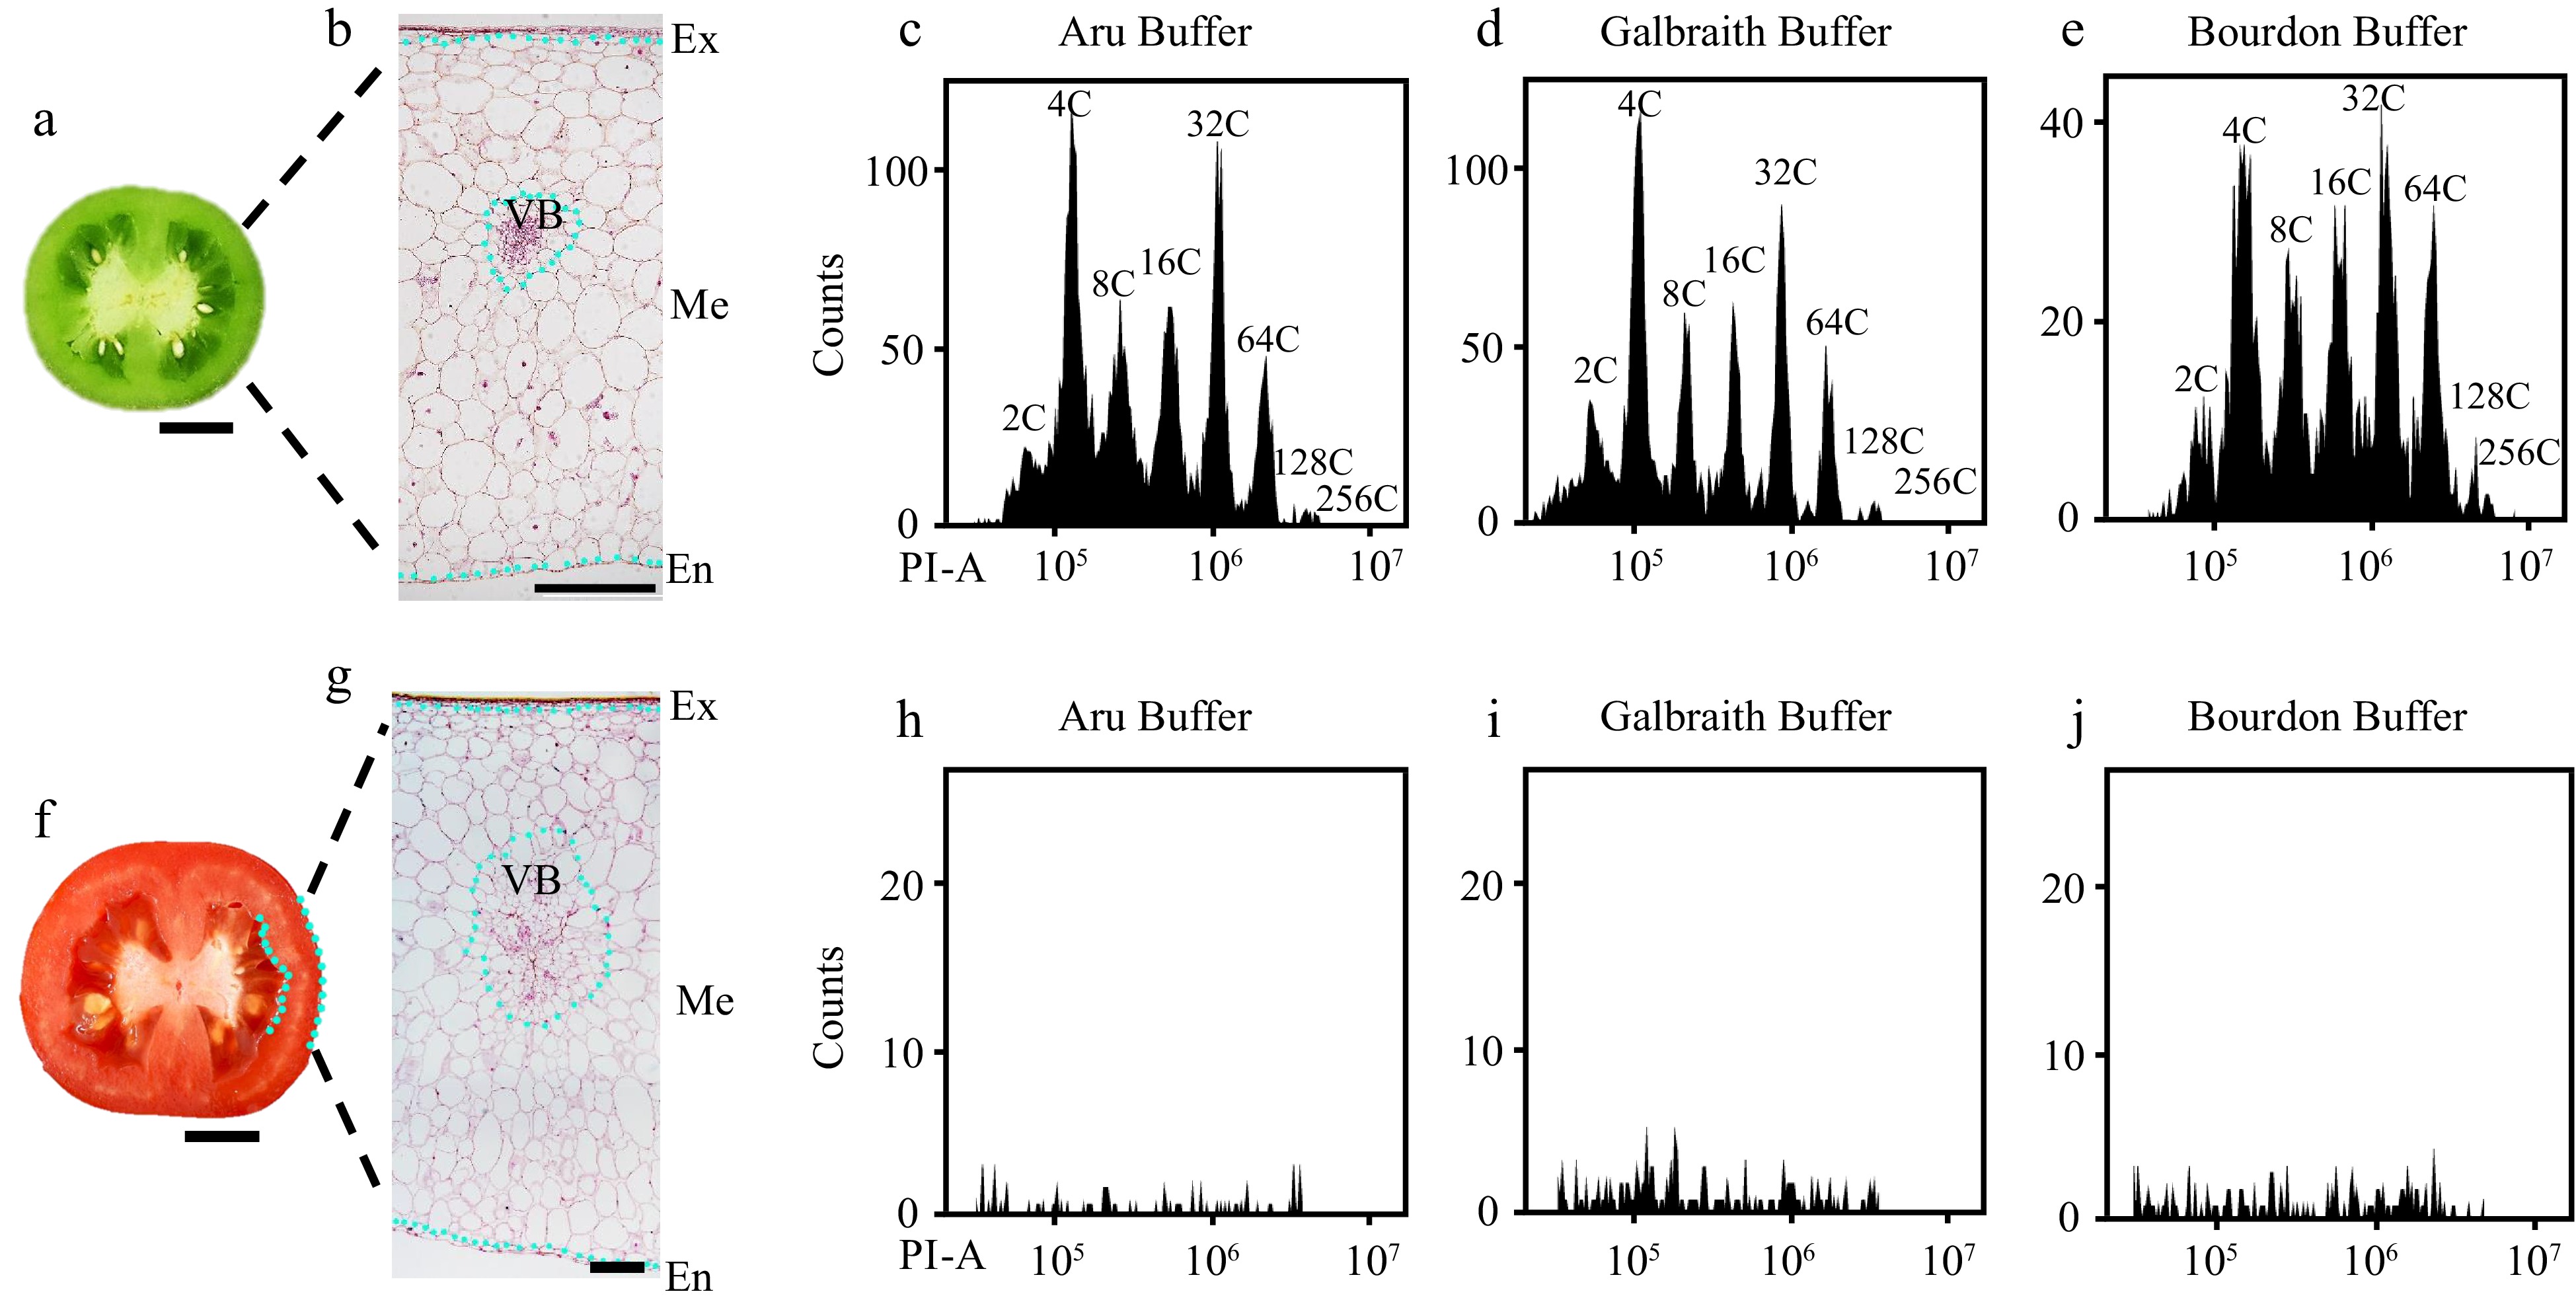
Figure 1.
Flow cytometric analysis of nuclear DNA ploidy distribution in mesocarps of green and red ripe tomato fruit. Nuclei were isolated from mesocarps of 25 d after pollination (DPA) green (c)−(e) and 55 DPA red ripe tomato fruit (h)−(j) using 'Aru', 'Galbraith' and 'Bourdon' buffer. Nuclei were stained by propidium iodide (PI) at the final concentration of 50 µg/ml for flow cytometric analysis. (a), (f) Representative picture of the equatorial plane of (a) 25 DPA and (f) 55 DPA tomato fruit. Scale bar = 1 cm. (b), (g) Paraffin section of (b) 25 DPA and (g) 55 DPA tomato pericarp. Scale bar = 500 μm. (c)−(e) Histograms of nuclear DNA ploidy distribution in 25 DPA tomato mesocarps. (h)−(j) Histograms of nuclear DNA ploidy distribution in 55 DPA tomato mesocarps. Ex, exocarp; Me, mesocarp; En, endocarp; VB, vascular bundle; PI-A, PI fluorescence pulse signal area.
-
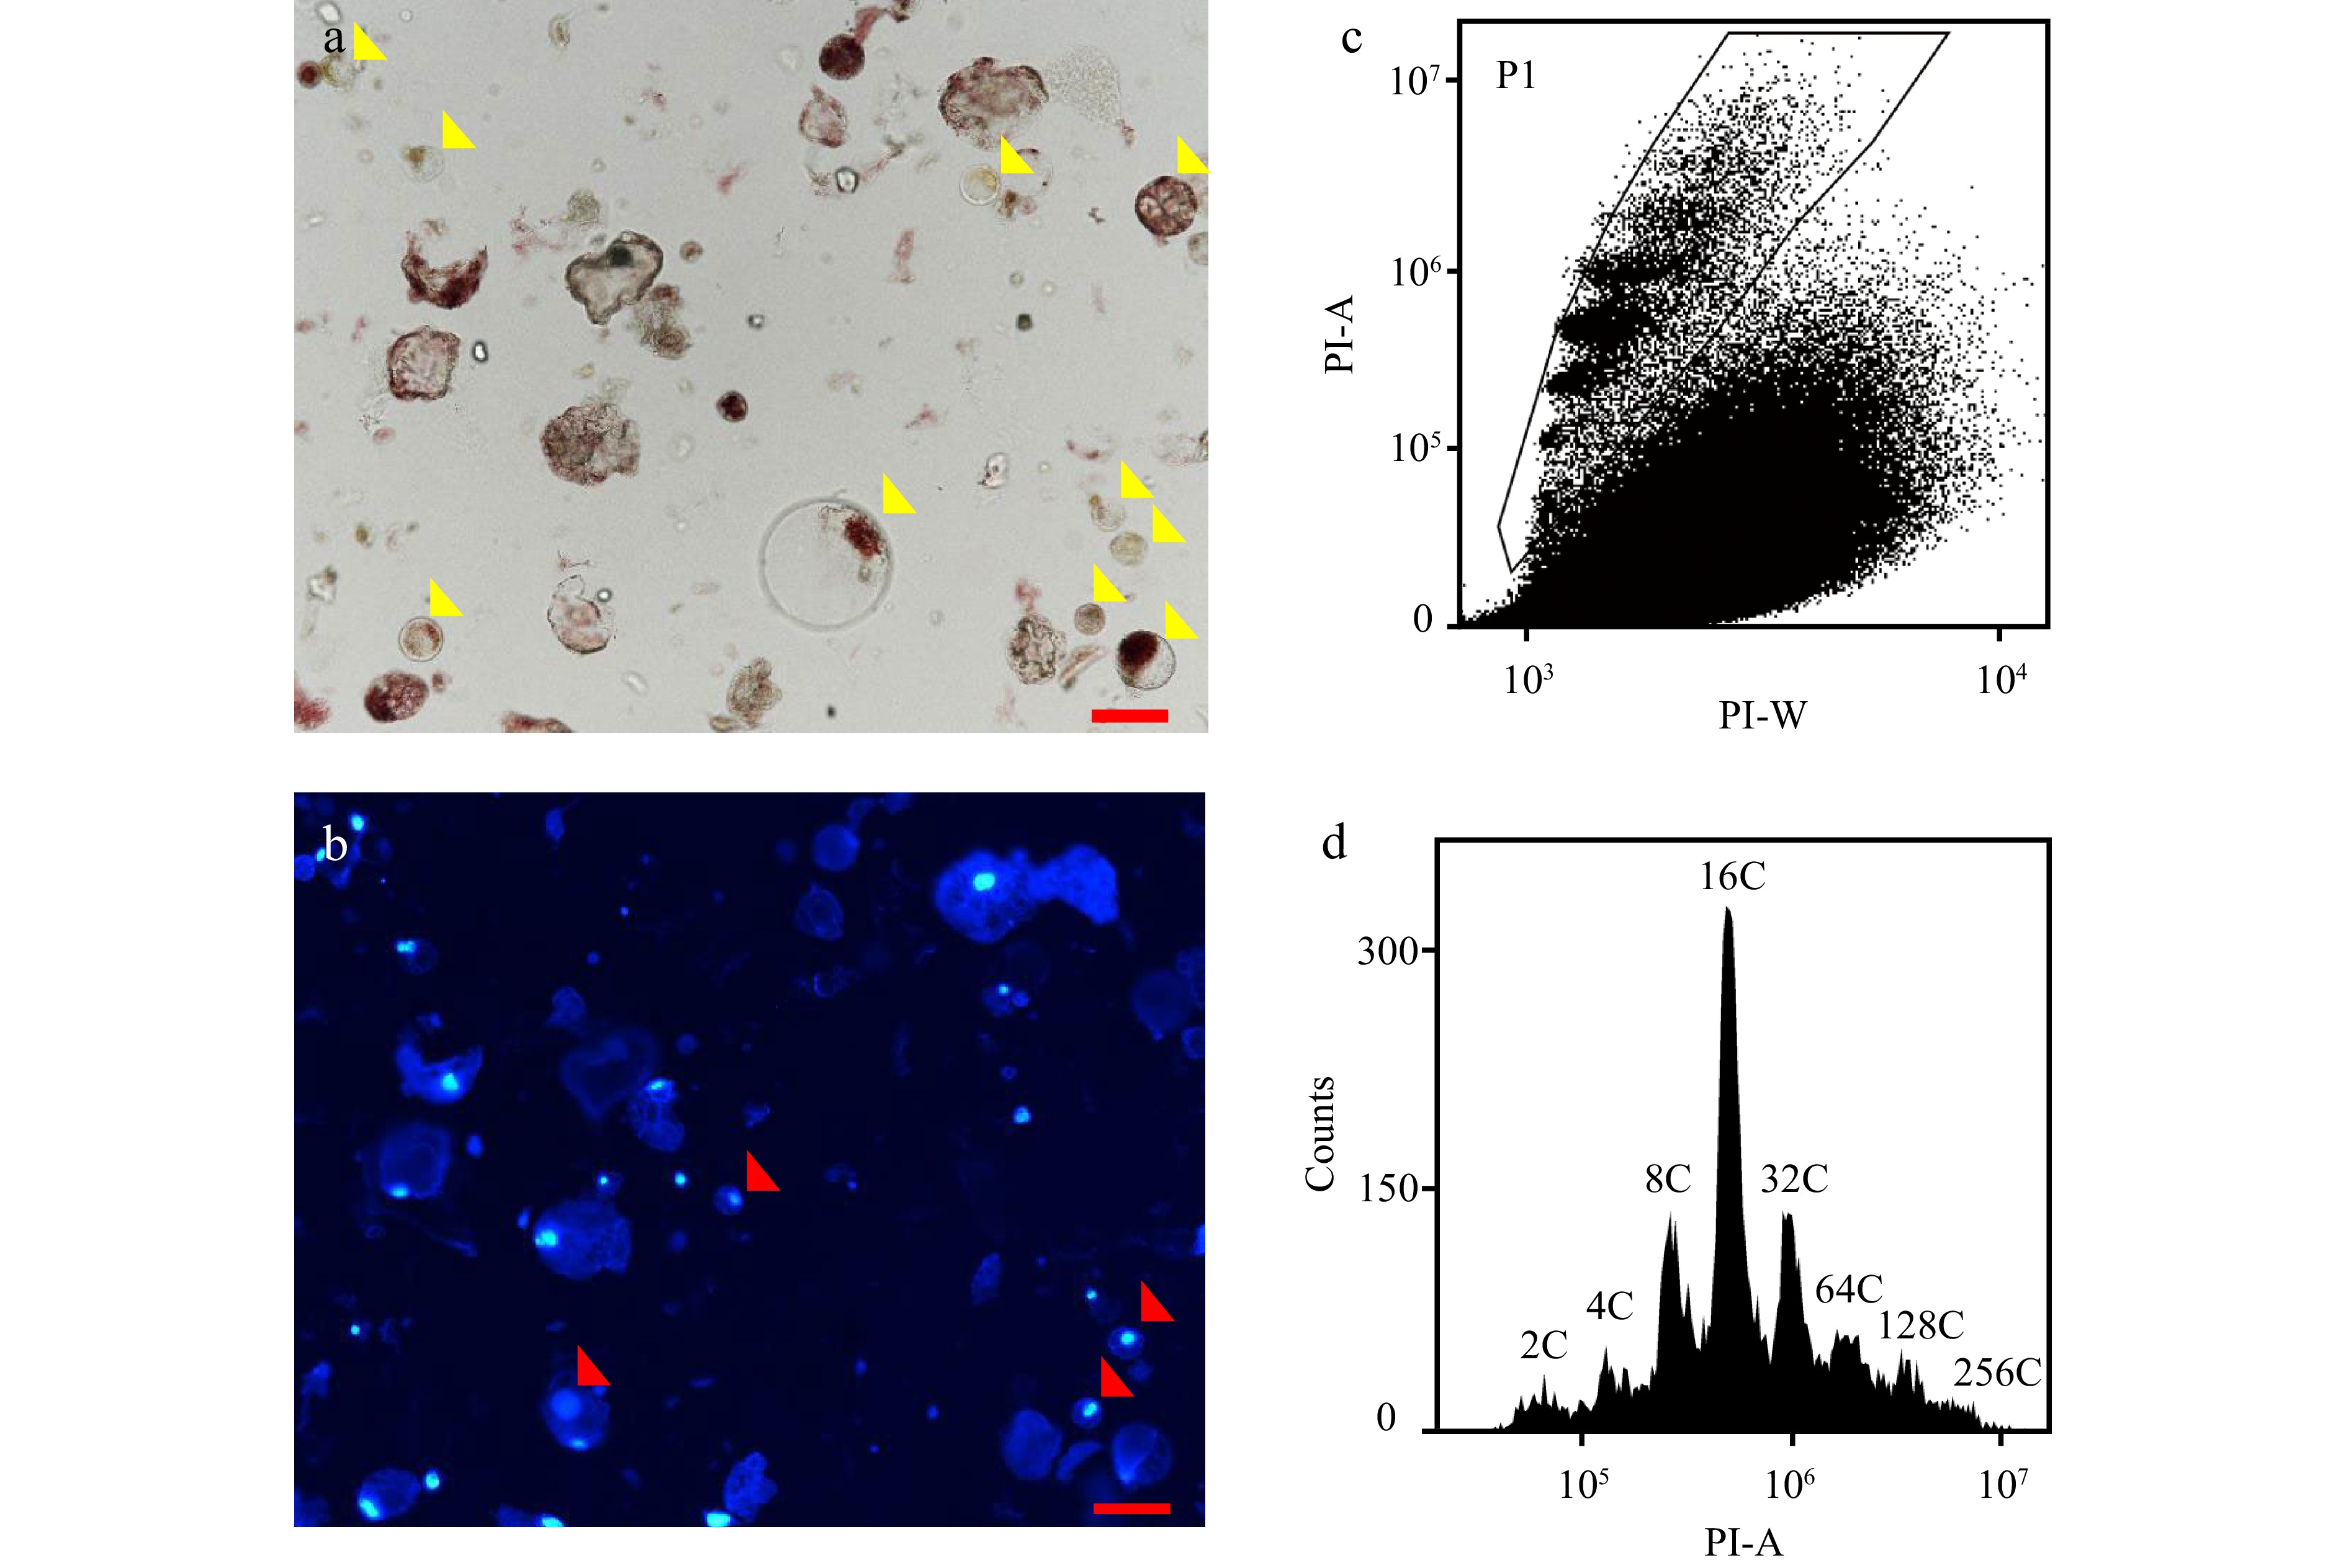
Figure 2.
Flow cytometric analysis of nuclear DNA ploidy distribution in protoplasts isolated from mesocarps of red ripe tomato fruit. (a) Microscopic examination of protoplasts isolated from 55 DPA tomato mesocarps. Yellow arrows indicate intact protoplasts. Scale bar = 100 μm. (b) Examination of nuclei in protoplasts under fluorescent microscope. Red arrows indicate nuclei. Nuclei were stained by 4’,6-diamidino-2-phenylindole (DAPI) at the final concentration of 1 µg/ml. Scale bar = 100 μm. (c), (d) Scatter plot and histogram of nuclear DNA distribution in flow cytometric analysis using nuclei isolated from protoplasts by 'Aru' buffer and stained by PI at a final concentration of 50 µg/ml . PI-A and PI-W represent PI fluorescence pulse signal area and width.
-
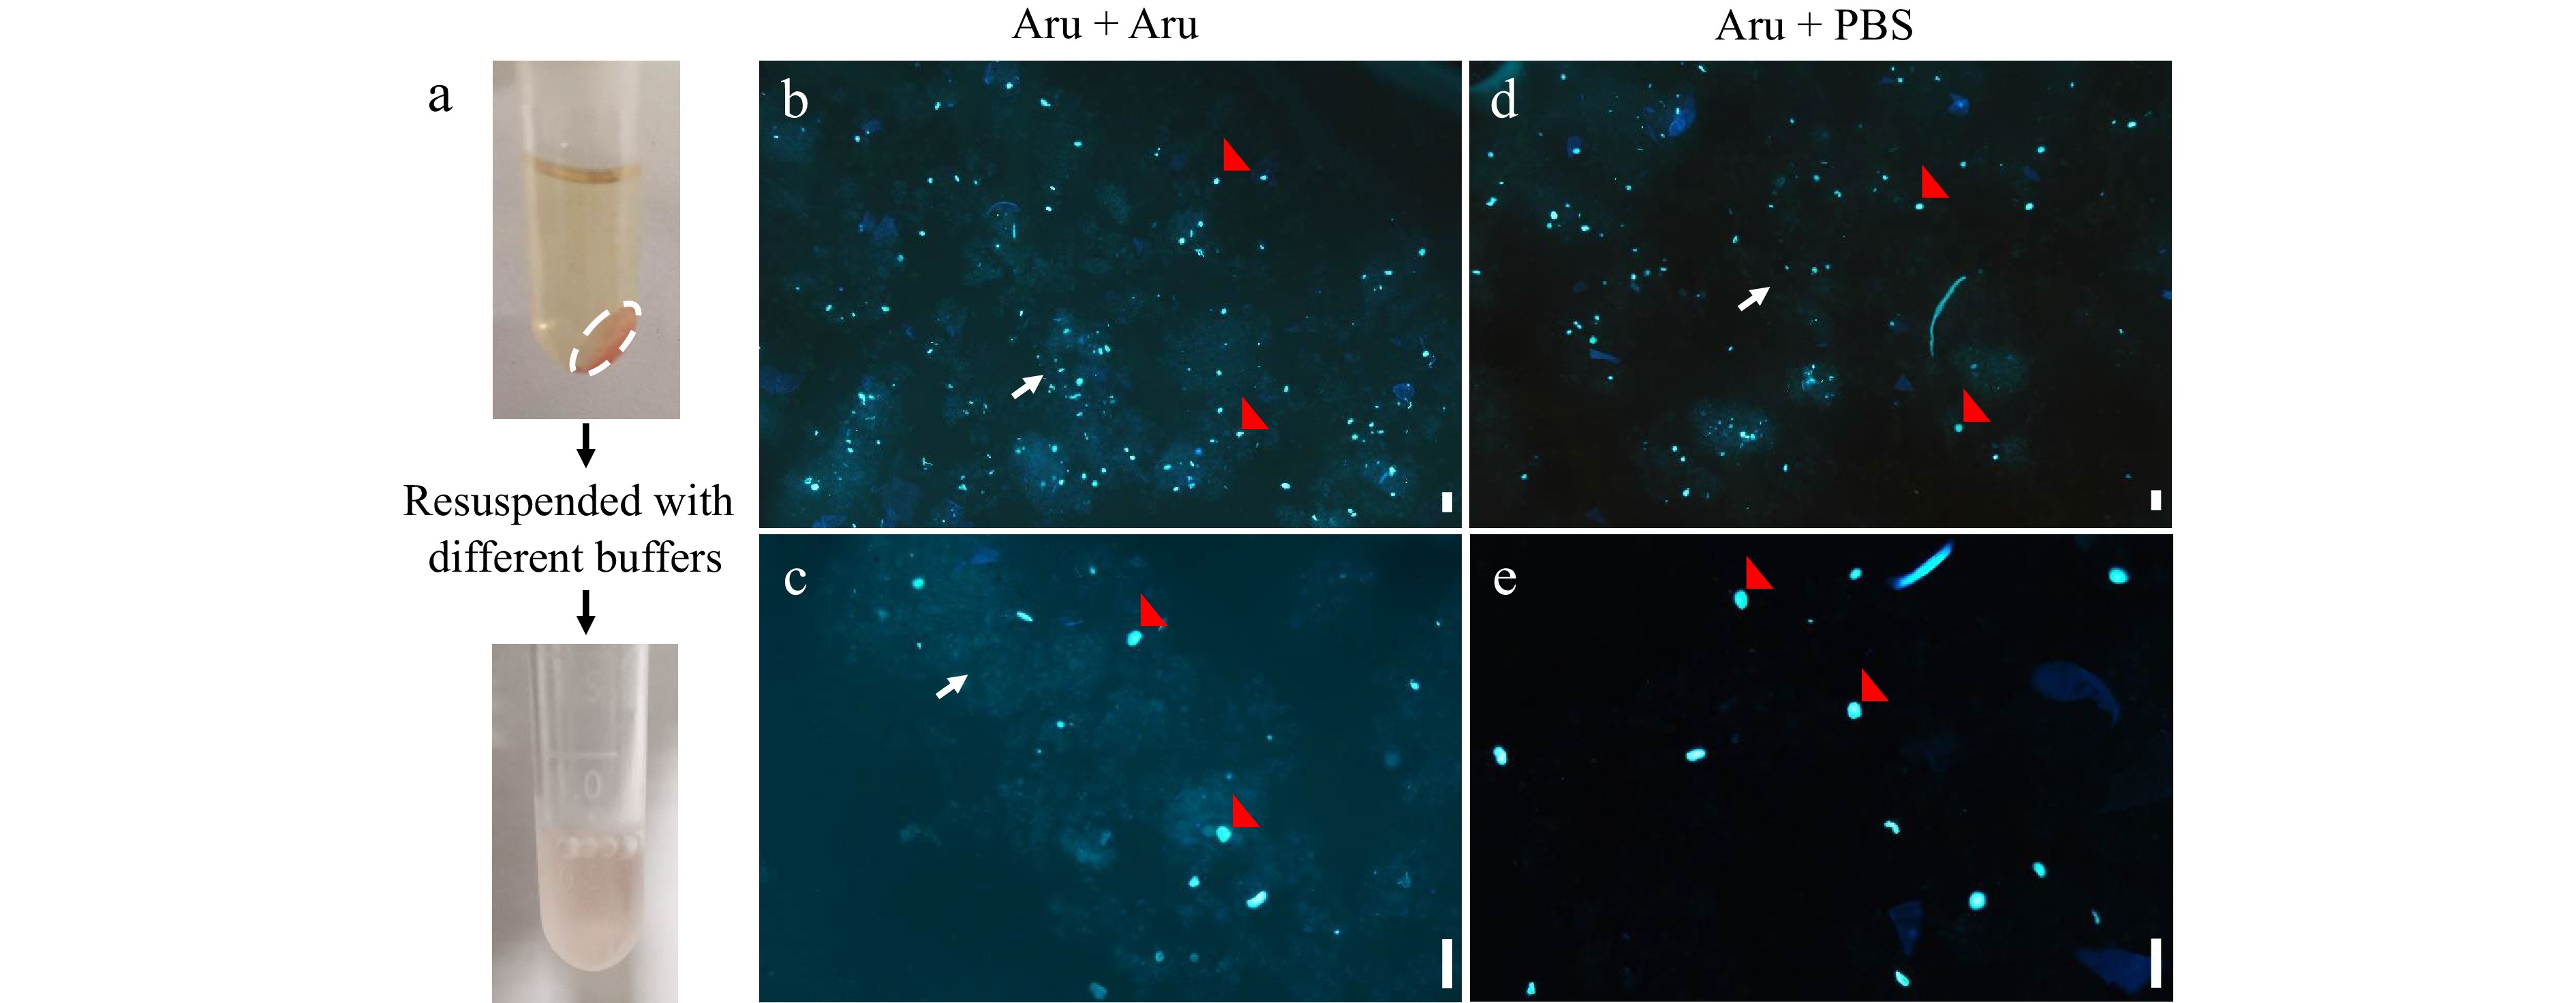
Figure 3.
Fluorescence microscopic analyses of nuclei resuspended by different buffers. Nuclei were isolated from mesocarps of 55 DPA red ripe tomato fruit using 'Aru' buffer and resuspended by 'Aru' (b), (c) or Phosphate Buffered Saline (PBS) buffer (d), (e). (a) The pellet of nuclei (white dashed circle) were collected by centrifugation and resuspended. (b)−(e) Fluorescence microscopic analyses of nuclei stained by DAPI under (b), (d) 4× and (c), (e) 10× magnification. Scale bar = 100 μm. Red arrows indicate nuclei, and white arrows indicate debris.
-
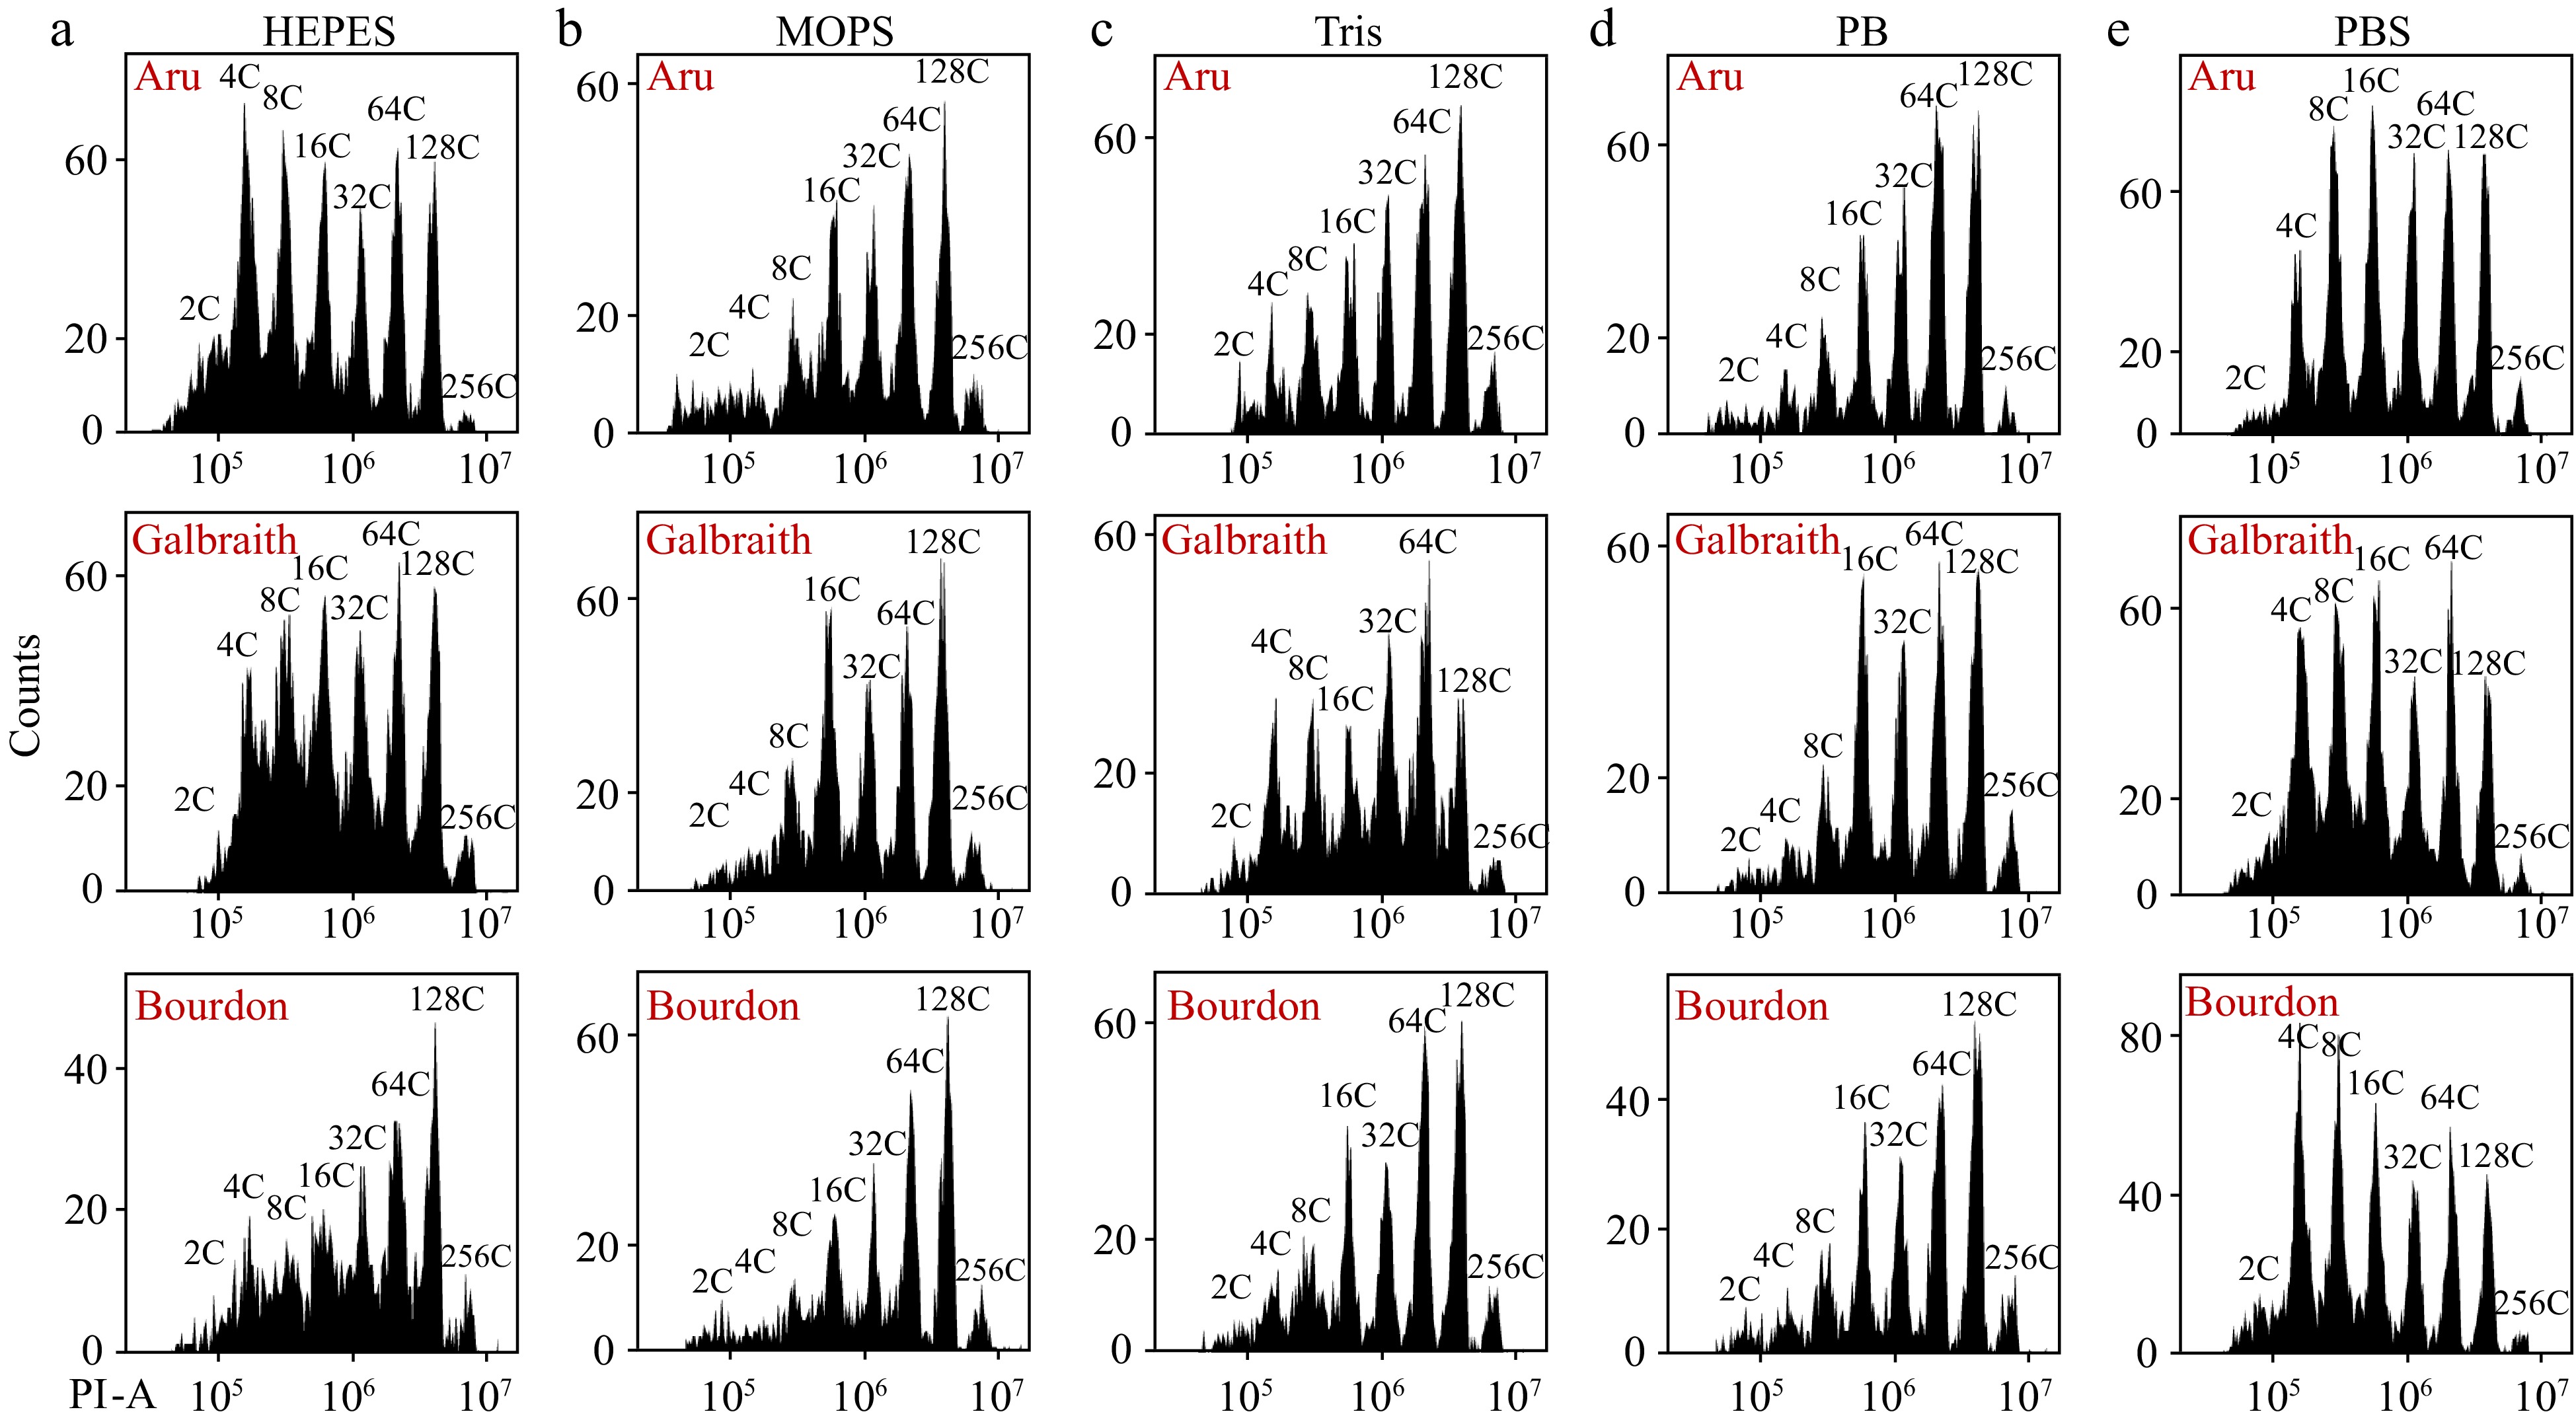
Figure 4.
Different resuspension buffers of nuclei have distinct effects on flow cytometric analysis. Nuclei were isolated from mesocarps of 55 DPA red ripe tomato fruit using 'Aru', 'Galbraith' and 'Bourdon' buffer. Nuclei were harvested by centrifugation, resuspended by (a) HEPES, (b) MOPS, (c) Tris, (d) Phosphate or (e) PBS buffer, and stained by PI at a final concentration of 50 µg/ml. Shown are histograms of flow cytometric analyses. PI-A, PI fluorescence pulse signal area.
-
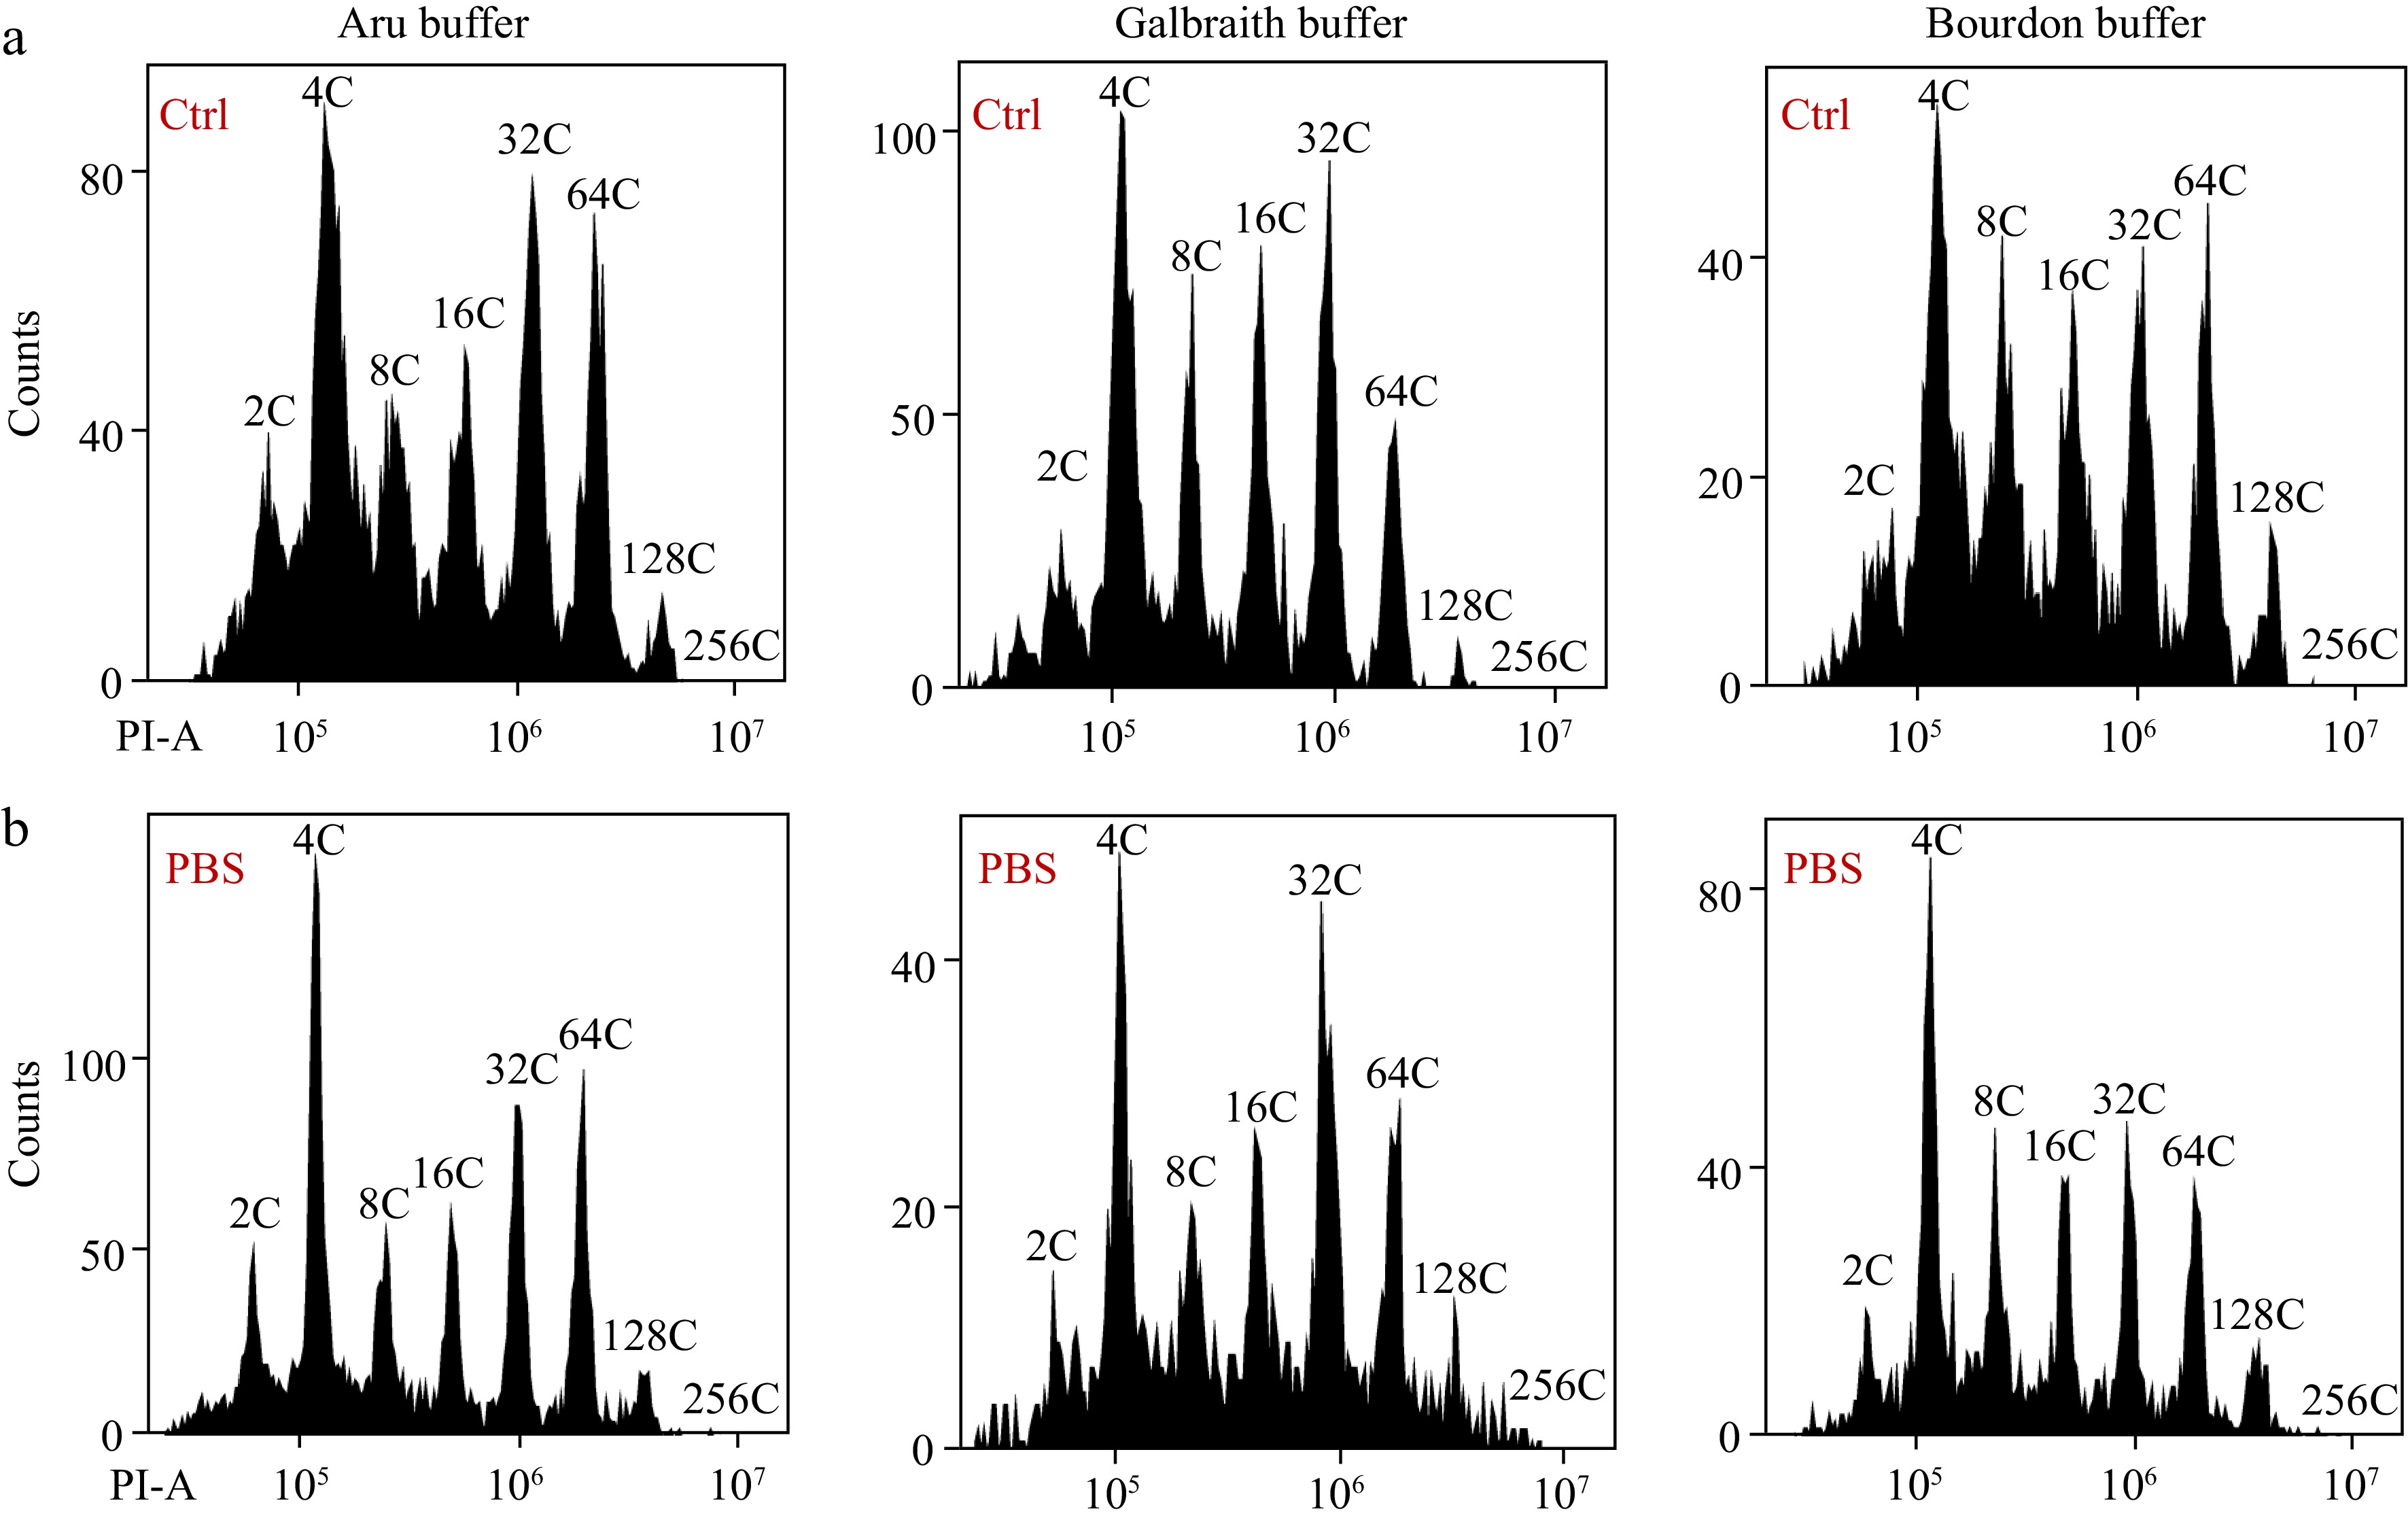
Figure 5.
Effects of PBS buffer resuspension on the nuclear DNA ploidy distribution in mesocarps of green tomato fruits. (a) Nuclei were isolated from mesocarps of 25 DPA green tomato fruit using 'Aru', 'Galbraith' and 'Bourdon' buffer and directly used for flow cytometric analysis. (b) Isolated nuclei in (a) were harvested by centrifugation and resuspended in PBS buffer. All nuclei were stained by PI at a final concentration of 50 µg/ml. Shown are histograms of flow cytometric analyses. PI-A, PI fluorescence pulse signal area.
-
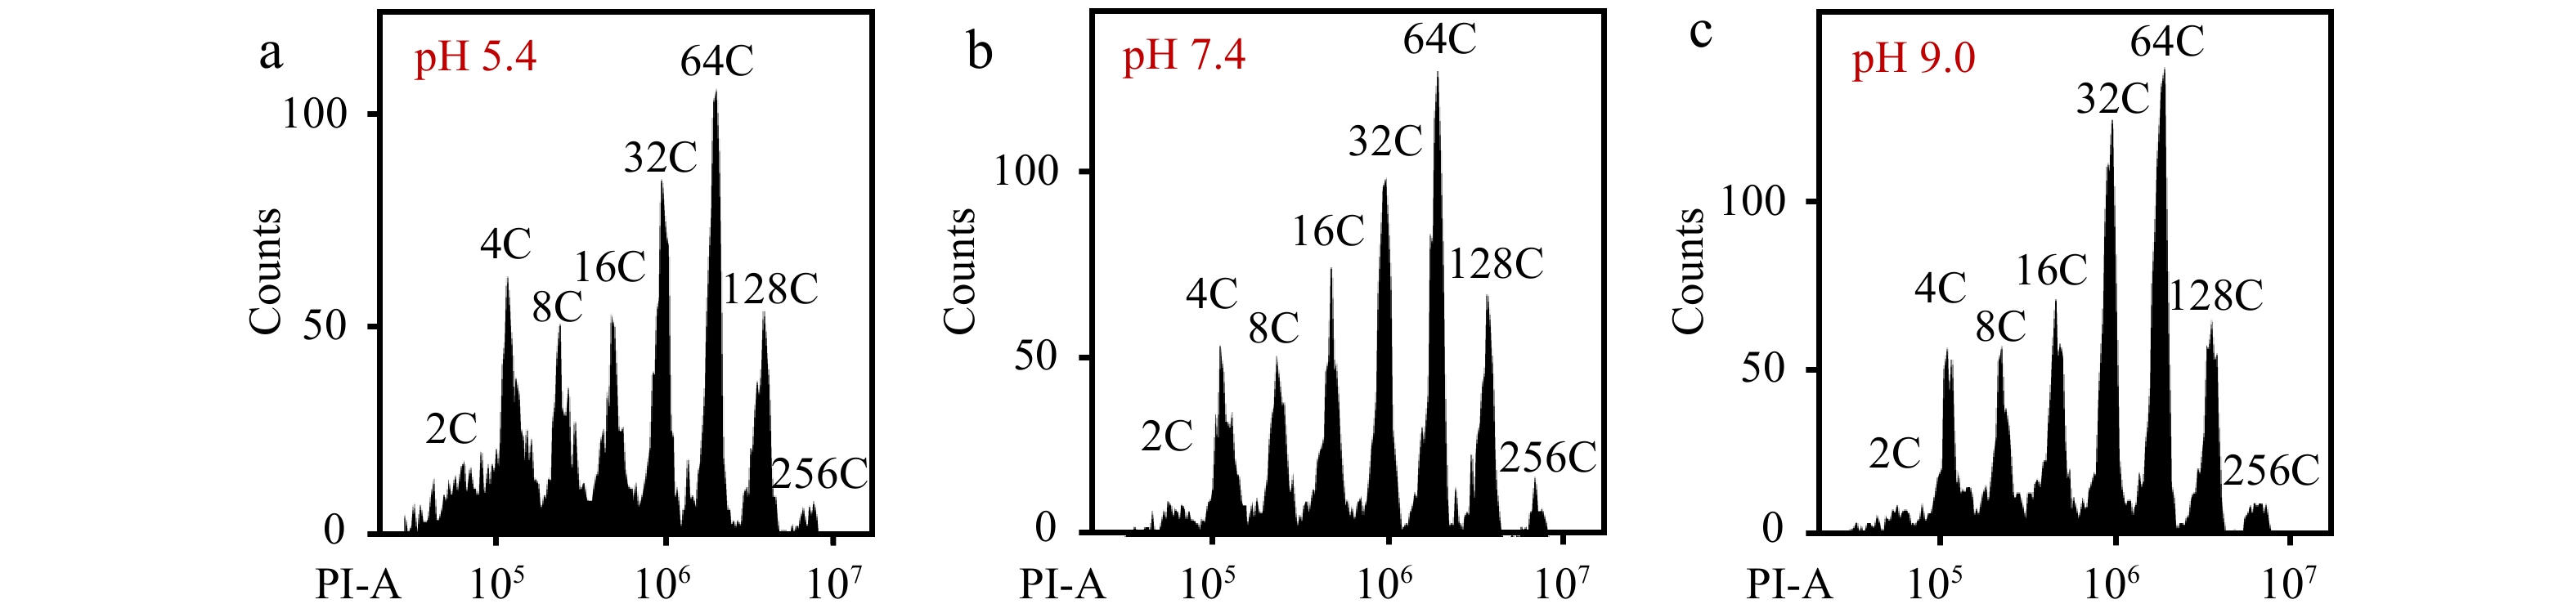
Figure 6.
The pH value of PBS buffer affects the detection of flow cytometer. Nuclei from mesocarp cells of red ripe tomato fruits were isolated in 'Aru' buffer, harvested by centrifugation and resuspended by PBS buffer with a pH value of (a) 5.4, (b) 7.4 and (c) 9.0. All nuclei were stained by PI at a final concentration of 50 µg/ml. Shown are histograms of flow cytometric analyses. PI-A, PI fluorescence pulse signal area.
-
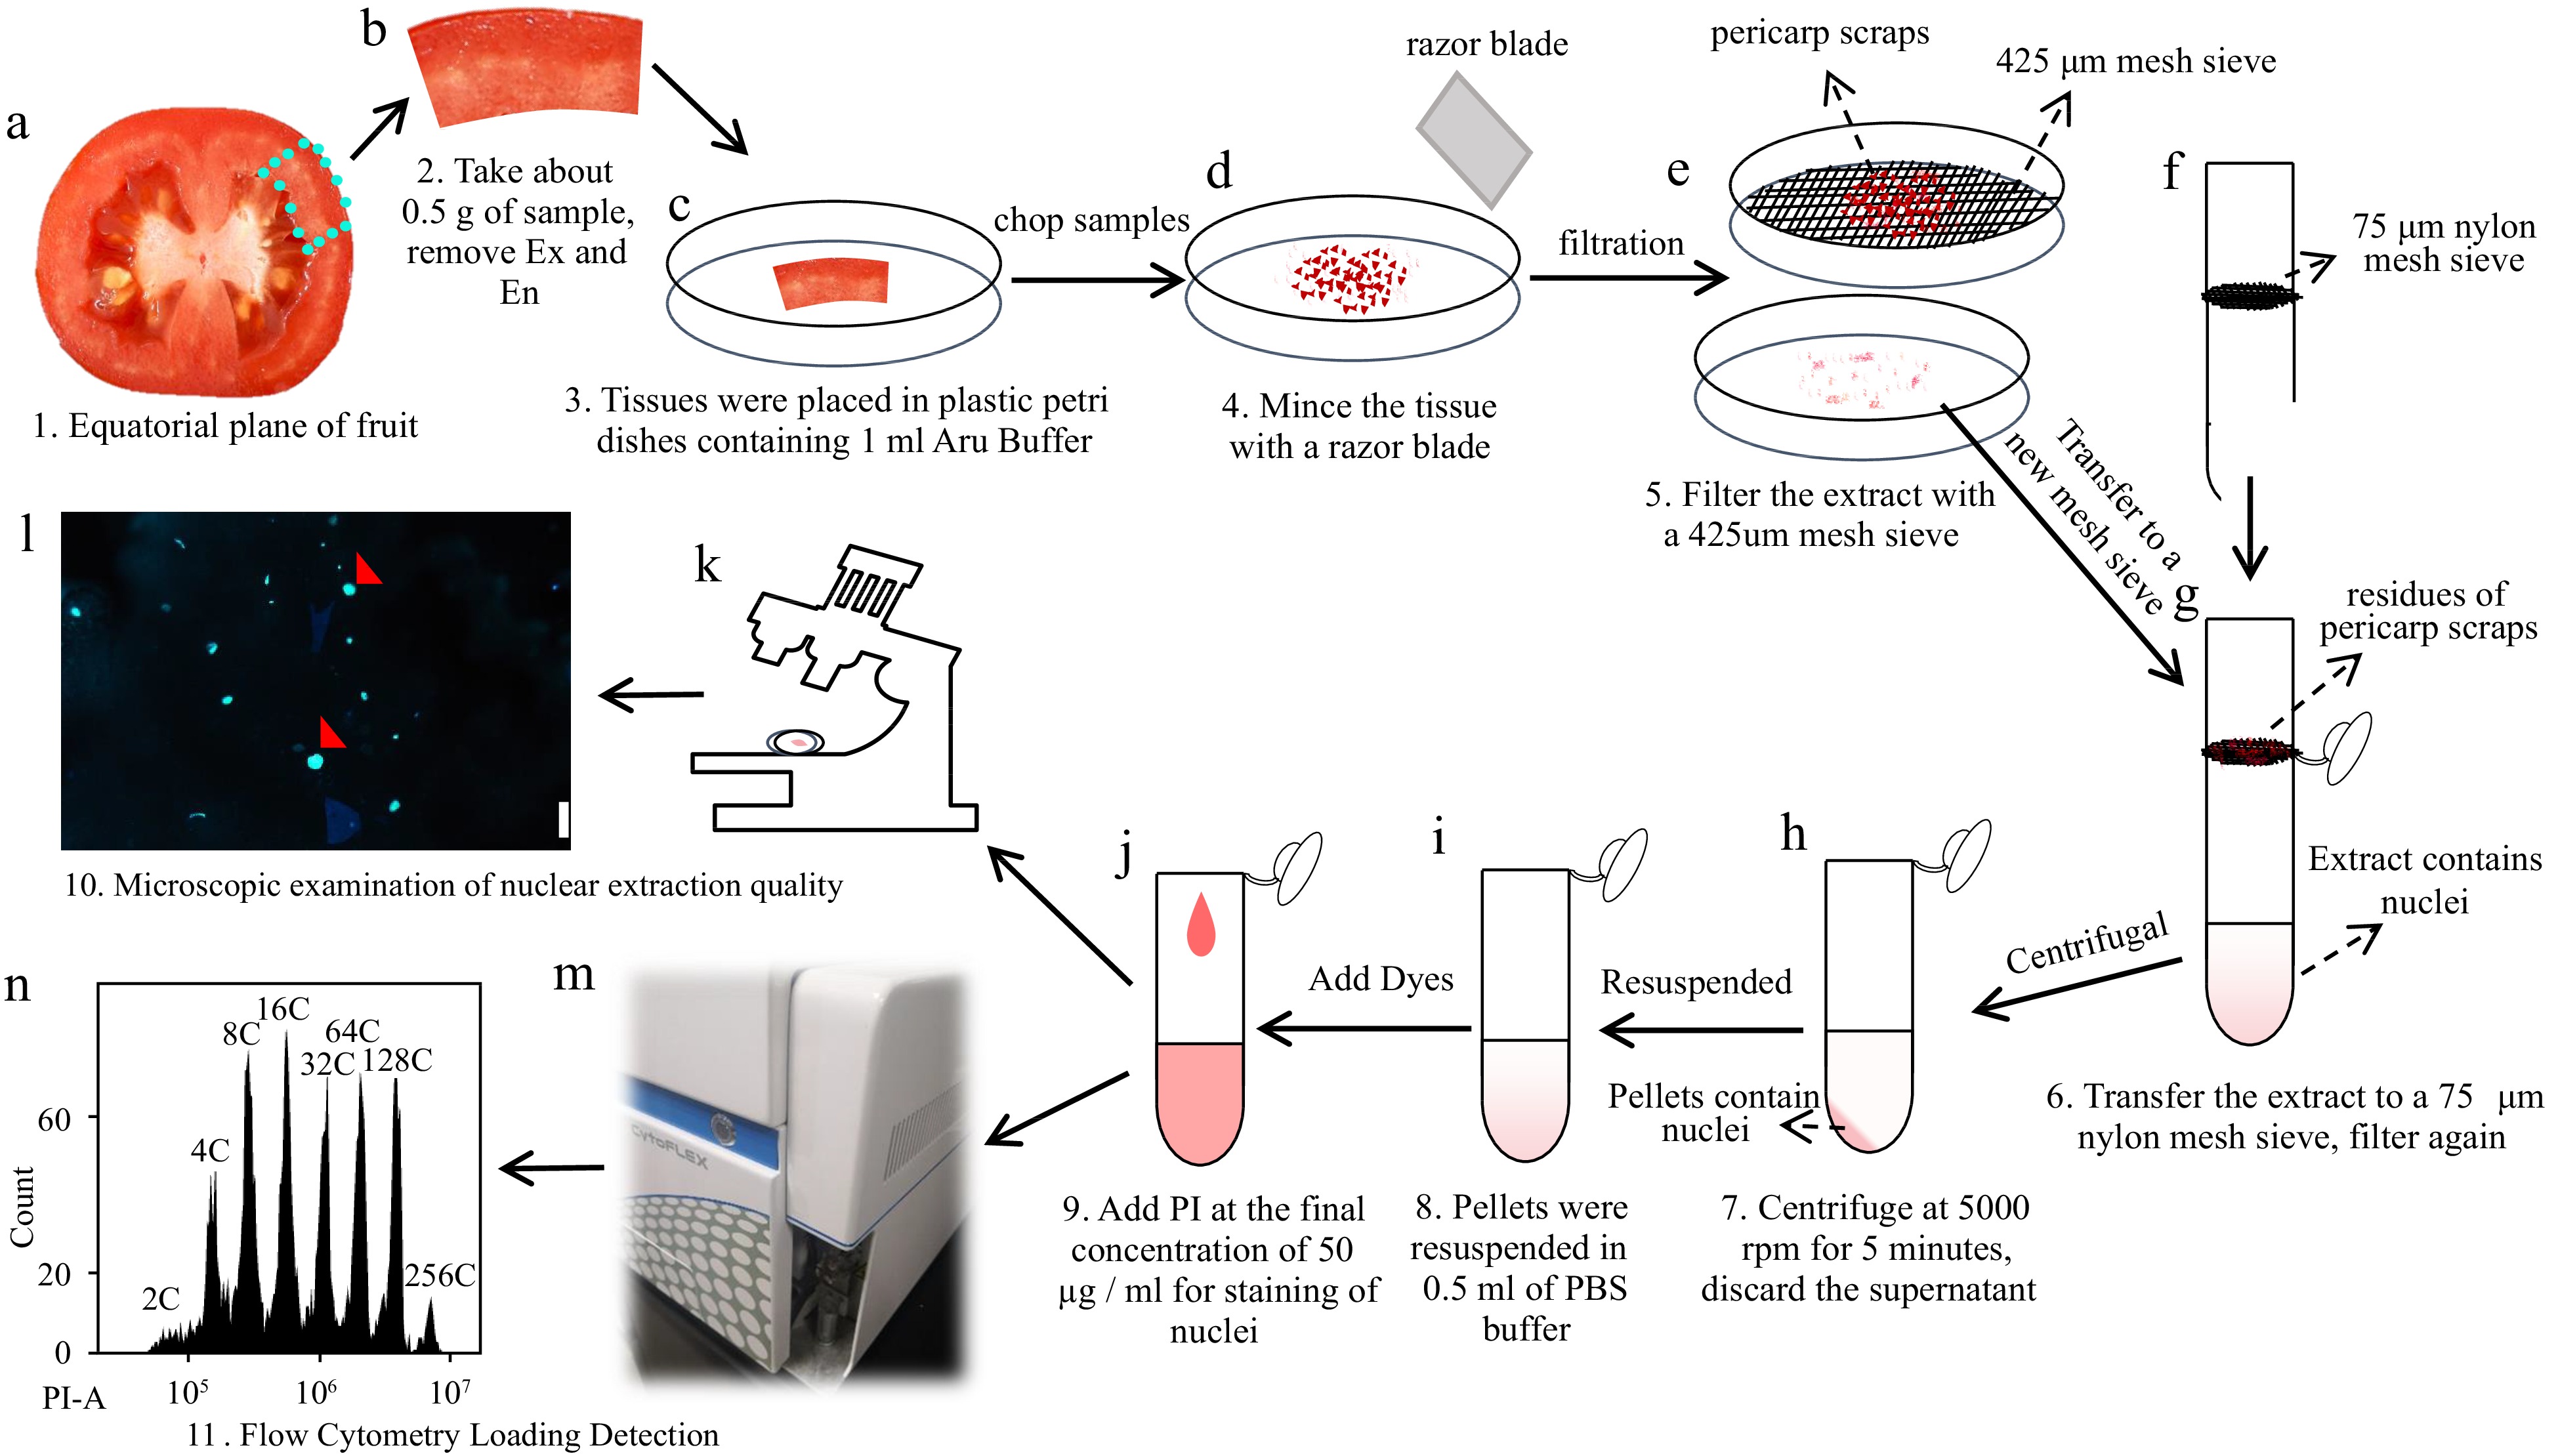
Figure 7.
Workflow diagram illustrating the detection of nuclear DNA ploidy distribution in tomato mesocarp using a flow cytometer. (a)-(d) About 0.5 g of the equatorial mesocarp is taken and chopped into pieces with a razor blade in a plastic petri dish containing 1 ml of 'Aru' buffer. (e)-(g) Lysates were filtered through a 425 μm steel mesh sieve and a 75 μm nylon mesh sieve sequentially. (h), (i) The filtrate is centrifuged at 5000 rpm for 5 min and the supernatant is discarded. The pellet of the nuclei is resuspended using 500 μl PBS buffer (pH 7.4). (j)-(n) PI is added to the resuspended solution at a final concentration of 50 µg/ml for flow cytometric analysis.
-
Treatment Nuclear DNA ploidy distribution EI Value Number
of nucleiEfficiency value 2C 4C 8C 16C 32C 64C 128C 256C Aru + PBS 4.25 ± 0.40%b 11.05 ± 0.38%b 12.57 ± 0.40%a 11.63 ± 0.76%b 17.86 ± 1.17%a 25.48 ± 0.92%a 14.93 ± 0.24%a 2.22 ± 0.40%a 3.75 ± 0.02a 4312 ± 254a 0.39 ± 0.02%b Gal + PBS 3.68 ± 0.46%b 13.39 ± 0.93%a 13.81 ± 0.92%a 12.76 ± 0.12%b 19.38 ± 0.83%a 21.72 ± 0.66%b 13.01 ± 1.74%a 2.24 ± 0.68%a 3.59 ± 0.10a 2133 ± 118c 0.16 ± 0.01%c Bou + PBS 5.35 ± 0.21%a 12.14 ± 0.71%ab 12.18 ± 0.57%a 14.14 ± 0.61%a 19.12 ± 0.21%a 21.24 ± 1.23%b 13.24 ± 0.24%a 2.55 ± 0.23%a 3.59 ± 0.05a 3442 ± 130b 0.58 ± 0.05%a Different letters indicate significant difference with p < 0.05 determined by one-way ANOVA plus Duncan's multiple range test. Table 1.
Impacts of different isolation buffers with PBS buffer resuspension of nuclei on the nuclear DNA ploidy distribution in the mesocarp of red ripe tomato fruit.
-
Treatment Nuclear DNA ploidy distribution EI Value Number
of nucleiEfficiency value 2C 4C 8C 16C 32C 64C 128C 256C Aru 7.88 ± 0.58%bc 27.11 ± 0.30%a 13.70 ± 1.57%bc 14.76 ± 1.86%ab 20.98 ± 1.28%a 13.56 ± 2.71%a 2.02 ± 0.26%bc 0c 2.63 ± 0.06bc 3450 ± 102a 0.81 ± 0.05%b Aru + PBS 10.37 ± 0.23%a 27.35 ± 0.57%a 12.47 ± 1.26%c 13.45 ± 1.28%b 19.01 ± 0.98%ab 14.07 ± 2.01%a 3.11 ± 1.03%abc 0.17 ± 0.14%bc 2.59 ± 0.07bc 2968 ± 449a 1.01 ± 0.15%b Gal 9.39 ± 1.48%ab 27.57 ± 1.47%a 13.82 ± 0.48%bc 16.40 ± 1.48%a 20.48 ± 0.97%a 10.78 ± 0.59%a 1.56 ± 0.12%c 0c 2.50 ± 0.09c 2979 ± 125a 1.38 ± 0.11%a Gal + PBS 7.56 ± 0.53%c 23.23 ± 1.60%b 13.03 ± 0.81%c 15.19 ± 0.83ab 21.14 ± 1.14%a 13.82 ± 1.07%a 5.19 ± 0.49%a 0.84 ± 0.32%a 2.86 ± 0.05a 1676 ± 225b 0.94 ± 0.06%b Bou 7.82 ± 1.00%bc 24.65 ± 0.66%b 16.57 ± 1.23%a 16.27 ± 0.33%a 16.17 ± 1.91%bc 14.00 ± 0.67%a 4.42 ± 1.70%ab 0.10 ± 0.11%c 2.69 ± 0.08b 1922 ± 37b 0.81 ± 0.09%b Bou + PBS 7.45 ± 0.57%c 27.87 ± 0.56%a 15.70 ± 0.96%ab 14.71 ± 0.26%ab 15.62 ± 2.35%c 13.05 ± 1.09%a 4.97 ± 1.99%a 0.64 ± 0.46%ab 2.65 ± 0.07b 2064 ± 214b 1.56 ± 0.20%a Different letters indicate significant difference with p < 0.05 determined by one-way ANOVA plus Duncan's multiple range test. Table 2.
Impacts of different isolation buffers with or without PBS buffer resuspension of nuclei on the nuclear DNA ploidy distribution in the mesocarp of green tomato fruit.
-
Treatment Nuclear DNA ploidy distribution EI Value Number
of nucleiEfficiency value 2C 4C 8C 16C 32C 64C 128C 256C PBS (pH 5.4) 5.22 ± 0.79a 14.72 ± 0.24a 11.93 ± 0.36a 12.75 ± 0.77b 19.95 ± 0.42b 22.56 ± 0.78b 11.63 ± 1.18a 1.22 ± 0.27b 3.48 ± 0.01b 3058 ± 104c 0.43 ± 0.01a PBS (pH 7.4) 3.11 ± 0.14b 11.10 ± 0.45b 11.27 ± 0.25ab 13.65 ± 1.11a 21.69 ± 1.05a 24.75 ± 1.03a 12.40 ± 0.56a 2.02 ± 0.19a 3.74 ± 0.03a 3339 ± 14b 0.37 ± 0.01b PBS (pH 9.0) 2.60 ± 0.14b 10.44 ± 0.22b 10.76 ± 0.32b 14.25 ± 0.12a 22.57 ± 0.48a 25.63 ± 0.27a 11.77 ± 0.16a 1.96 ± 0.05a 3.78 ± 0.02a 3598 ± 36a 0.38 ± 0.01b Different letters indicate significant difference with p < 0.05 determined by one-way ANOVA plus Duncan's multiple range test. Table 3.
Impacts of different pH values of PBS buffer on the nuclear DNA ploidy distribution in the mesocarp of red ripe tomato fruit.
Figures
(7)
Tables
(3)