-
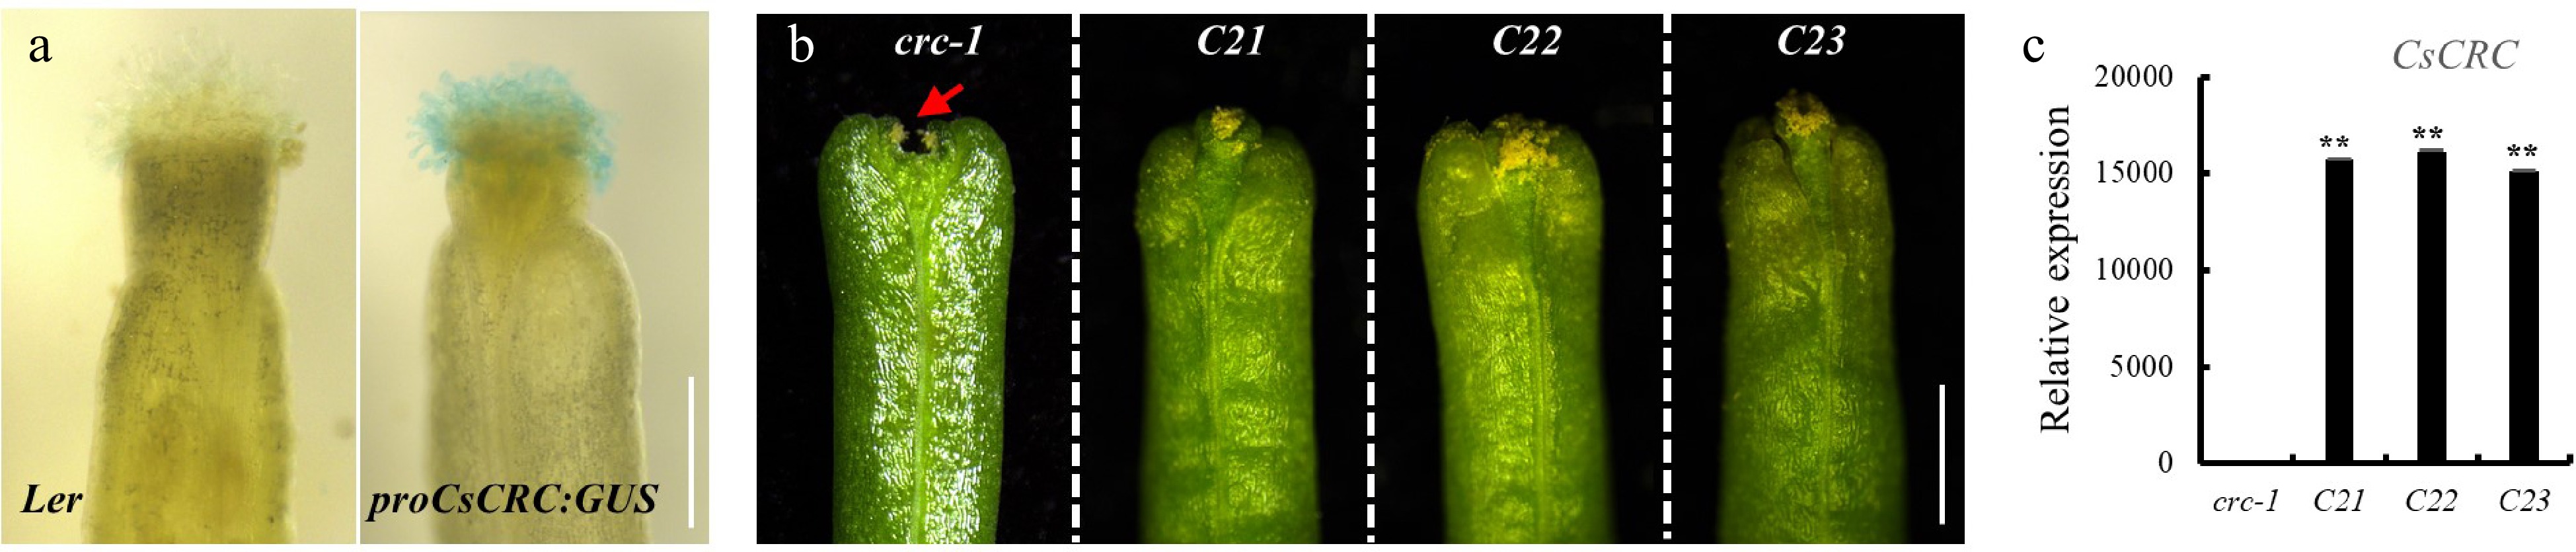
Figure 1.
Ectopic expression of CsCRC in Arabidopsis. (a) proCsCRC:GUS reporter activity in wild-type Arabidopsis Ler showing intense staining in stigma. (b) Ectopic expression of CsCRC rescued the unfused-stigma phenotype in Arabidopsis crc-1 mutant. (c) RT-qPCR analysis of CsCRC overexpression in crc-1 mutant. The arrow indicates the stigma defect in crc-1. **: significance at P < 0.01. Three biological replicates and three technique replicates were performed for each RT-qPCR analysis. Scale bar = 1 mm.
-
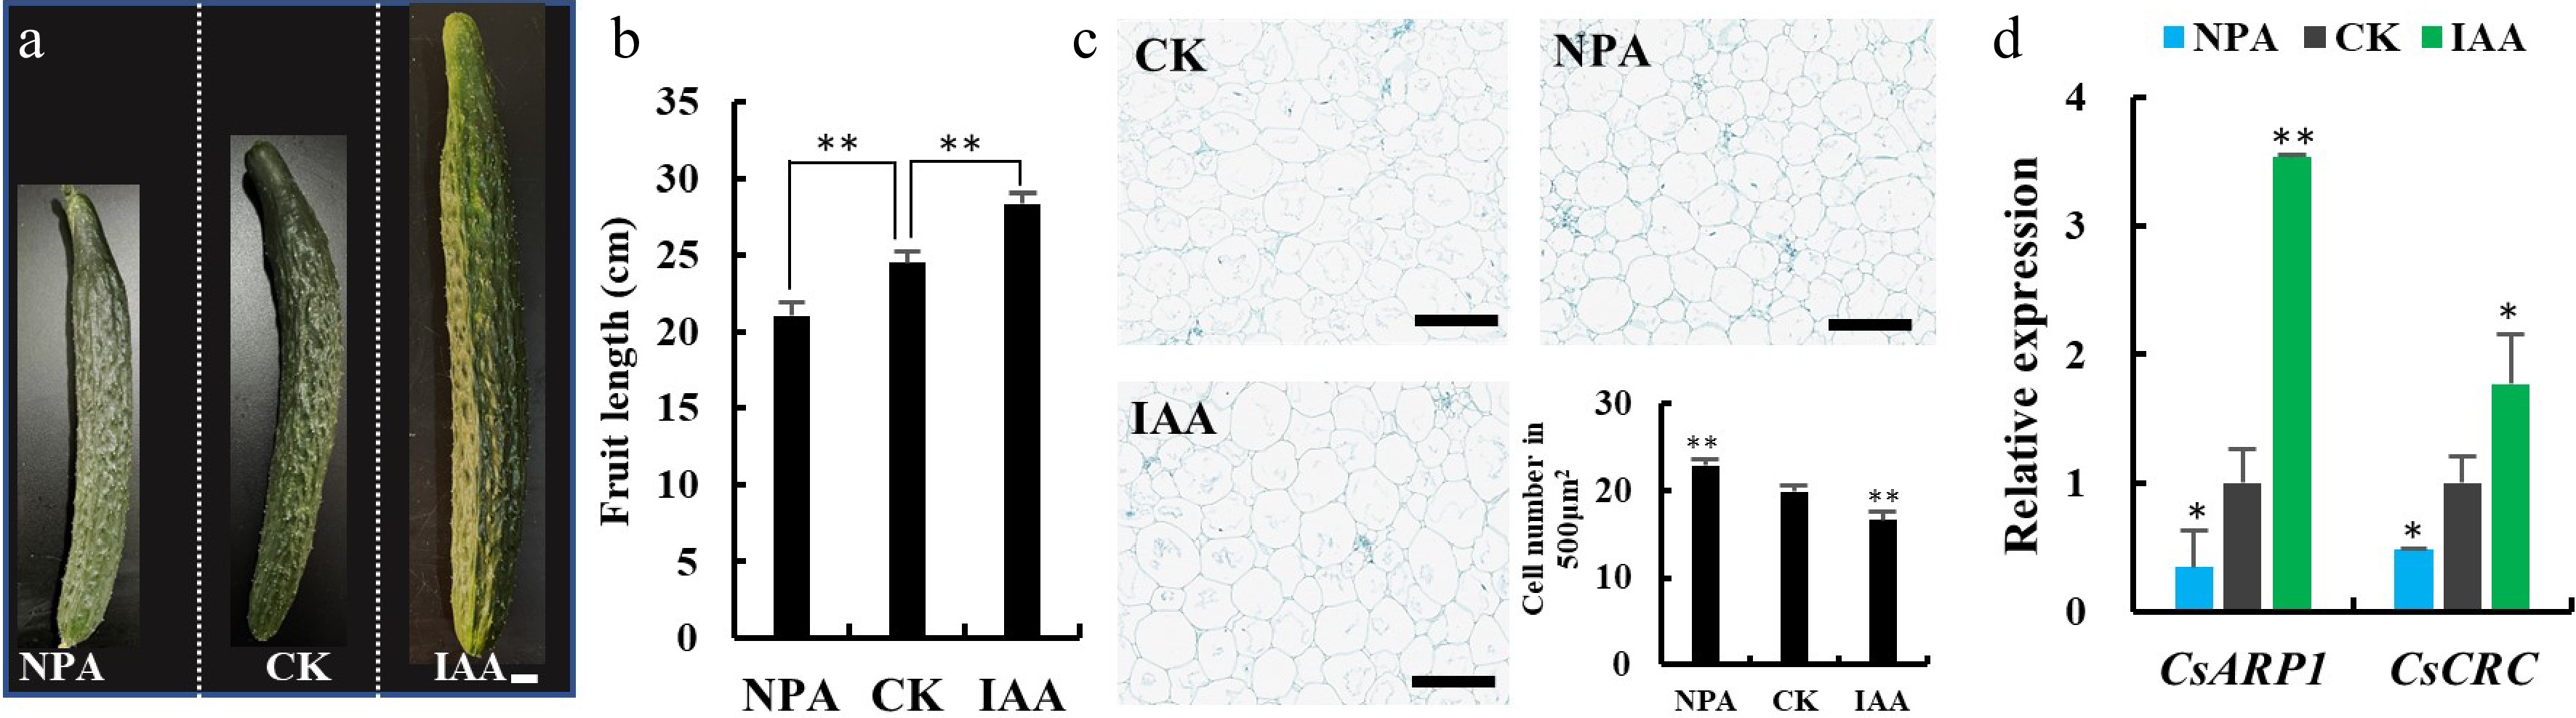
Figure 2.
Auxin promotes fruit elongation and activates the expression of CsCRC and CsARP1. (a) Cucumber fruits at commercial stage upon IAA and NPA treatments. (b) Quantification of fruit length at 10 DAA after treatment. (c) Longitudinal sections in the mesocarp fruits at 10 DAA. Cell numbers in the mesocarp of 10DAA fruit were counted. (d) The relative expression of CsARP1 and CsCRC in cucumber ovaries upon treatment. Scale bars are (a) 1 cm and (c) 200 μm. *: significance at P < 0.05; **: significance at P < 0.01. Three biological replicates and three technical replicates were performed for each RT-qPCR analysis.
-
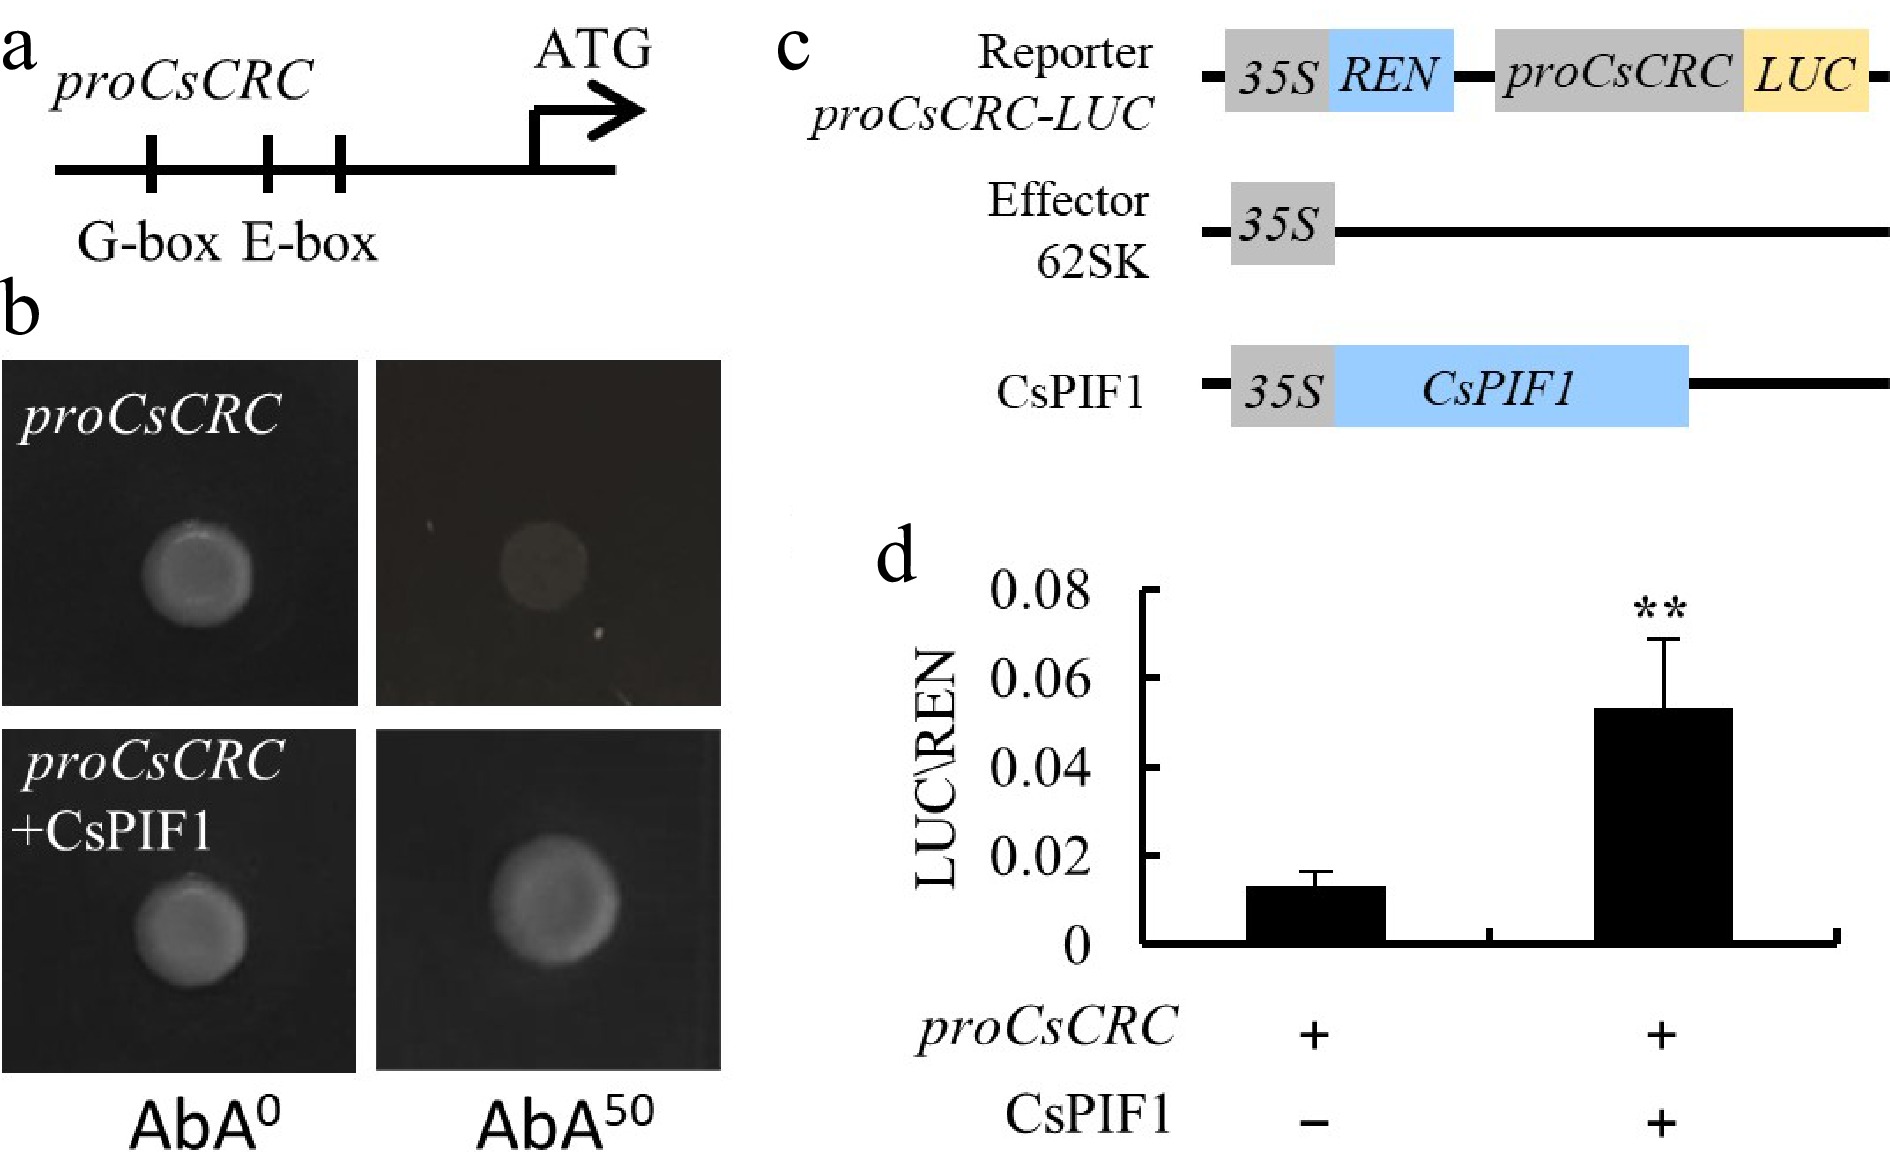
Figure 3.
CsPIF1 is the upstream regulator of CsCRC. (a), (b) Y1H assay showed that CsPIF1 bound to the G-box at the promoter of CsCRC. (c) Schematic diagram of the reporter and effector constructs used for LUC/REN assays. (d) LUC activity measurement after transient expression of proCsCRC:LUC with 35S:CsPIF in tobacco leaves. Error bars represent standard errors. '**: significance at P < 0.01.
-
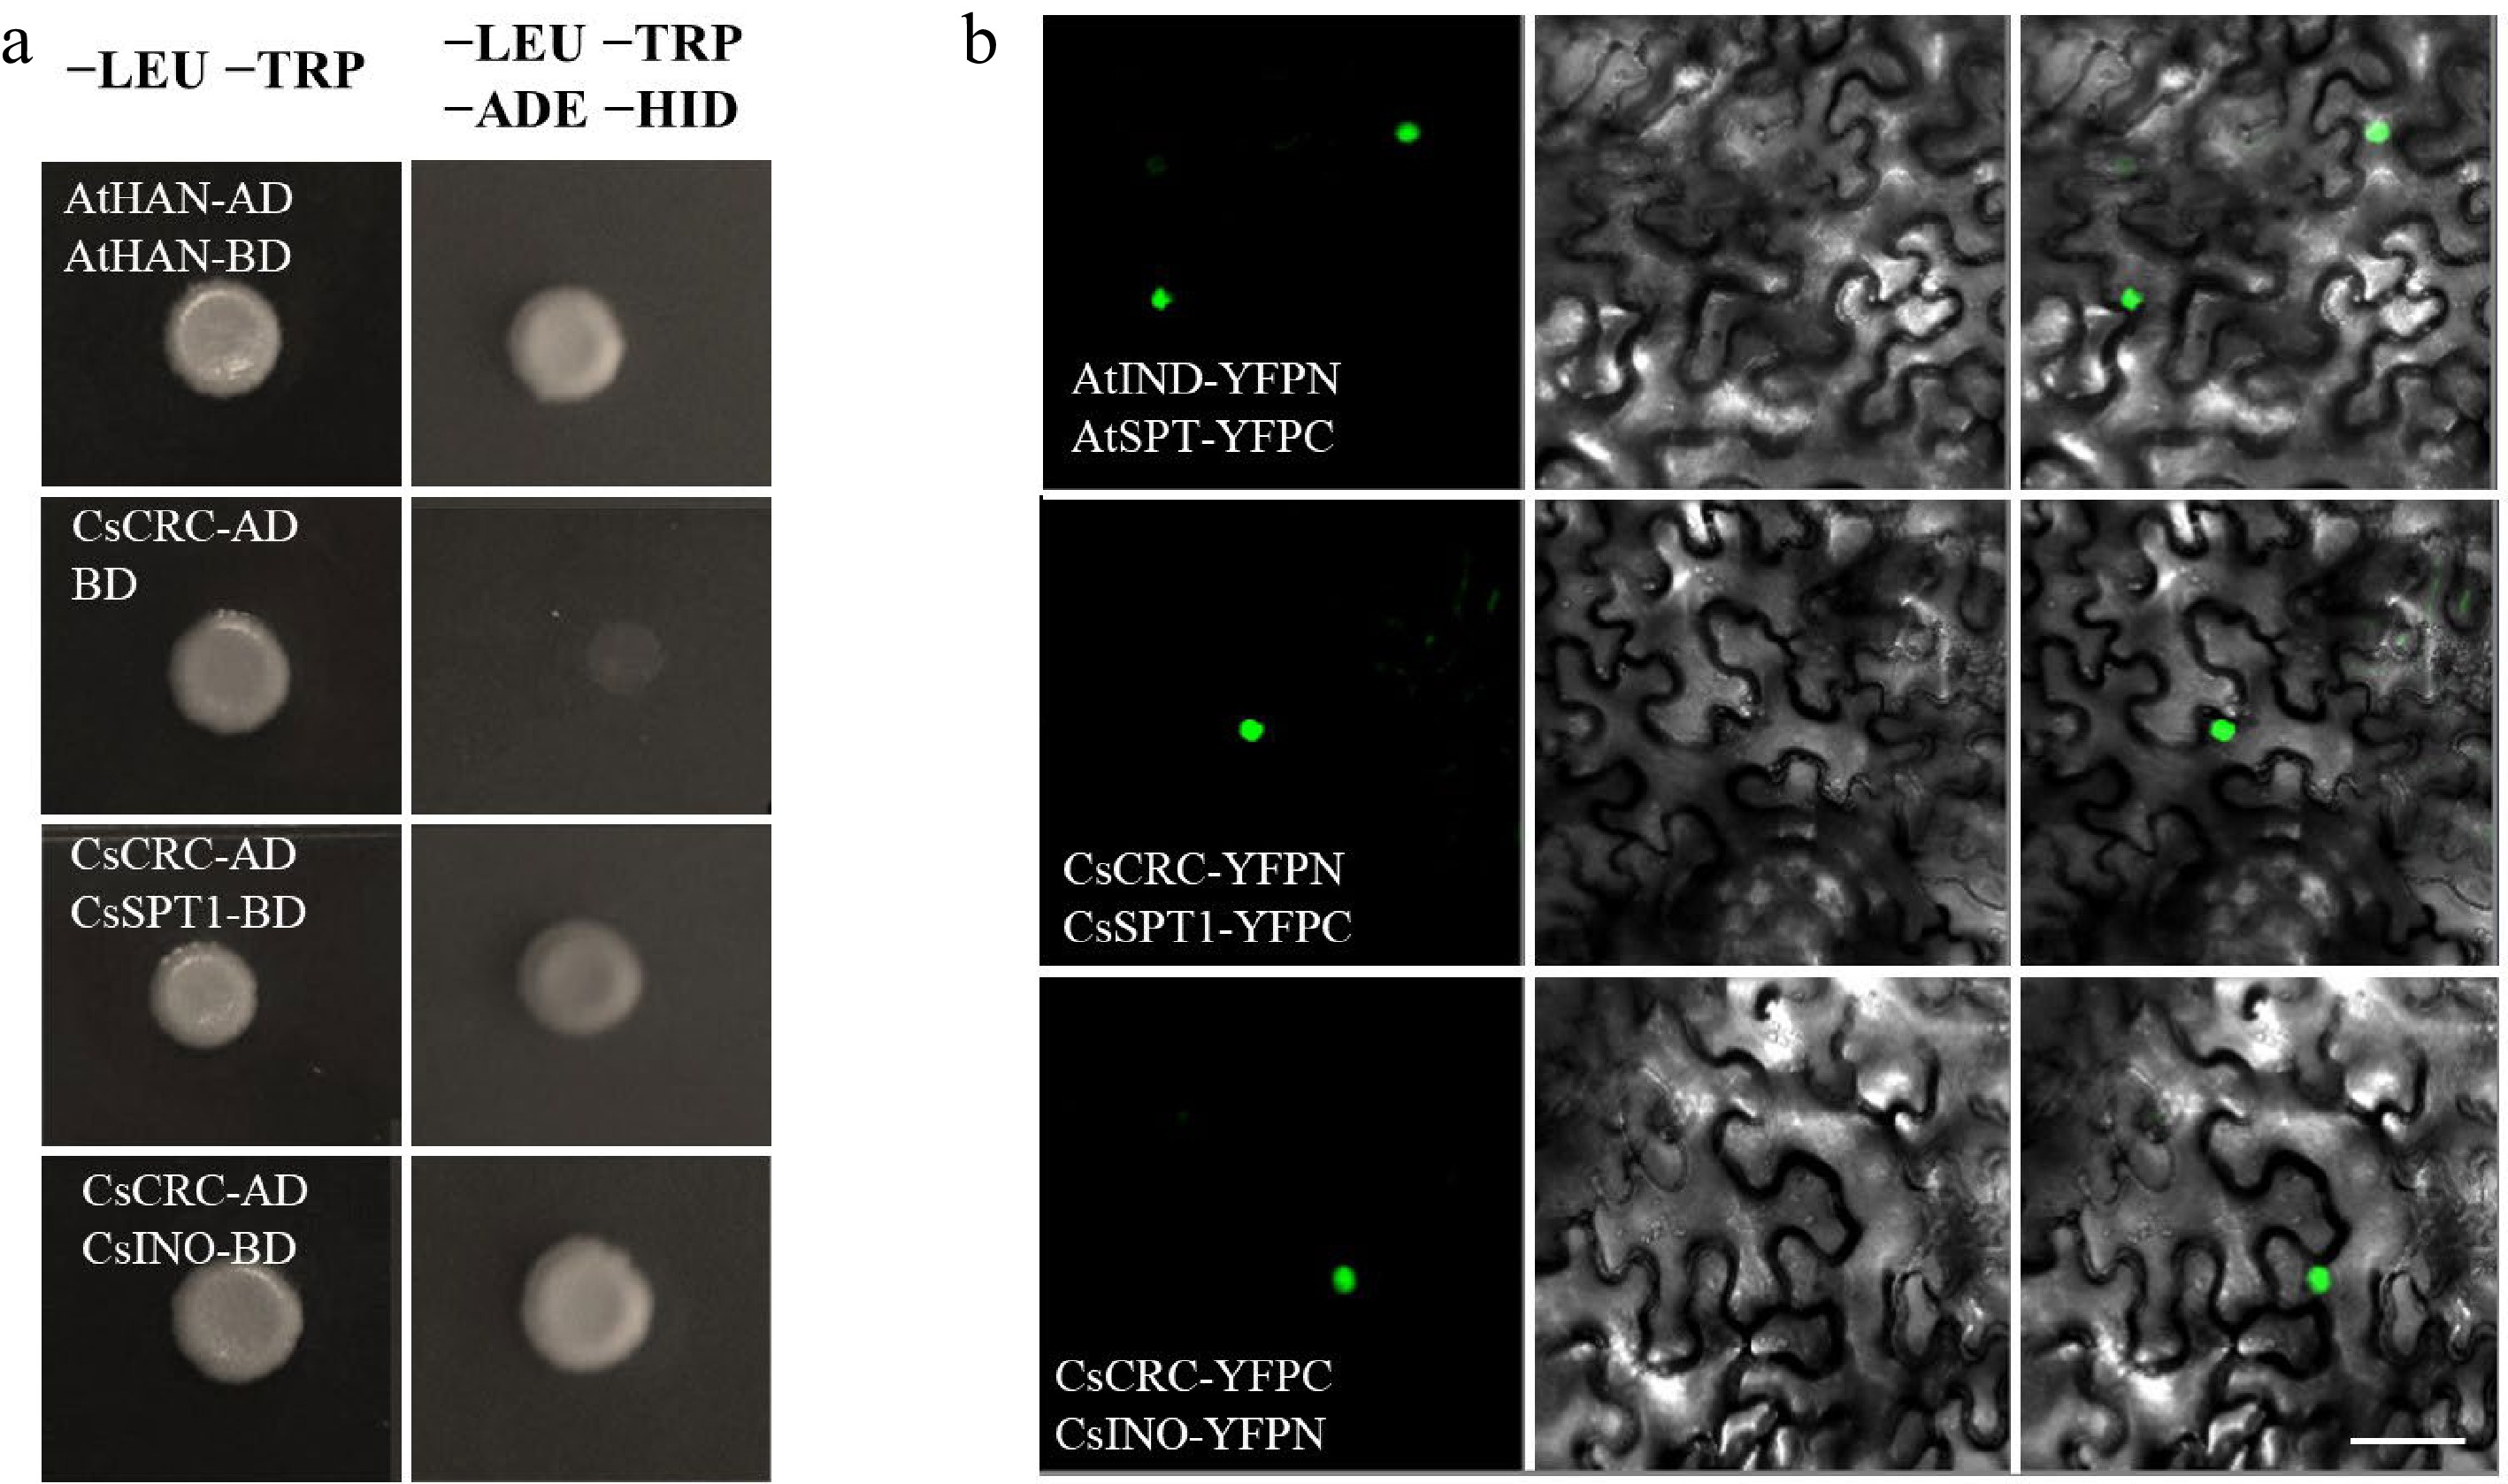
Figure 4.
Protein interactions detected with Y2H and BiFC assays. (a) Y2H assay showed the interaction of CsCRC with CsSPT1 and CsINO. The interaction of AtHAN-BD and AtHAN-AD was used as the positive control. (b) BiFC assay. The combination of AtIND-YFPC and AtSPT-YFPN was used as a positive control. Dark-field, bright-field and merged channels are shown sequentially from left to right. Scale bar = 50 μm.
Figures
(4)
Tables
(0)