-
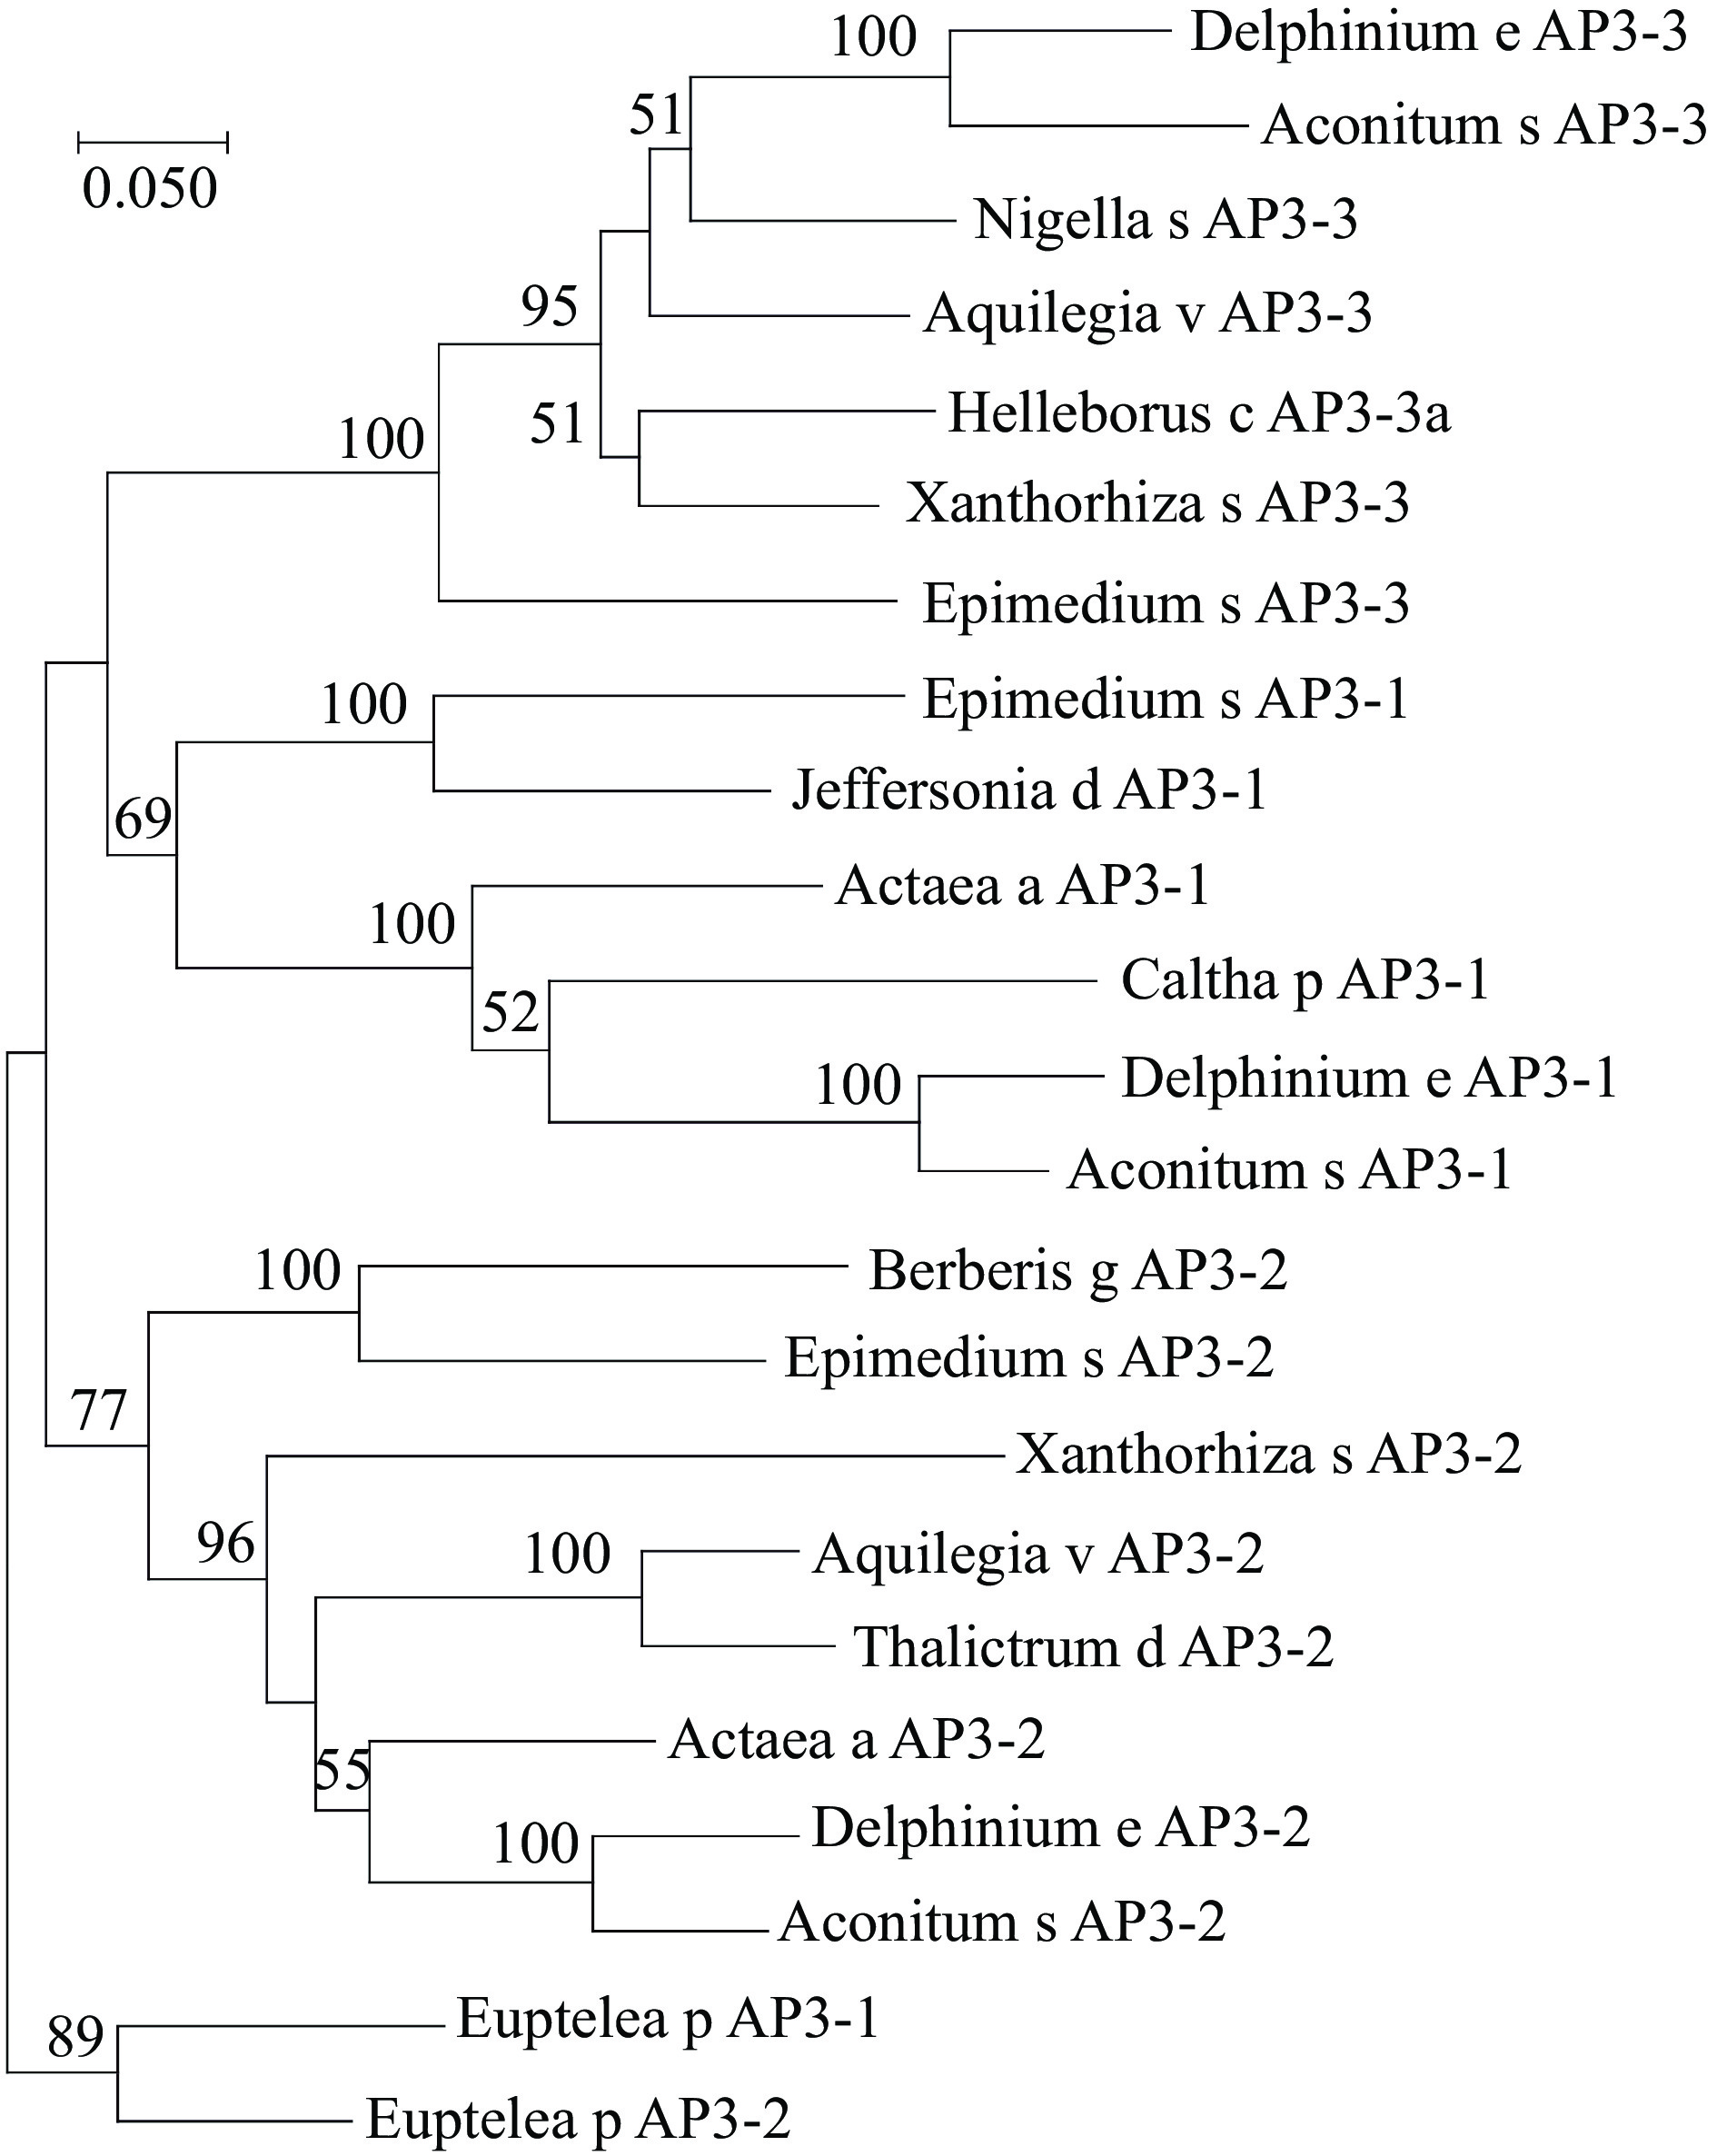
Figure 1.
Phylogeny of AP3 lineage genes. The maximum likelihood tree was produced using MEGA5 from multiple nucleotide alignments and reveals that the phylogenetic position of EsAP3-1, EsAP3-2 and EsAP3-3. Bootstrap values over 50 was shown with 1000 replications. Caltha p AP3-1, EU481813.1; Actaea a AP3-1, HQ647375.1; Delphinium e AP3-1, EU481804.1; Aconitum s AP3-1, EU481818.1; Jeffersonia d AP3-1, EU481791.1; Xanthorhiza s AP3-2, EU481797.1; Delphinium e AP3-3, EU481802.1; Aconitum s AP3-3, EU481816; Nigella s AP3-3, HQ694794.1; Helleborus c AP3-3a AY162876.1; Aquilegia v AP3-3, EF489476.1; Xanthorhiza s AP3-3, EU481796.1; Berberis g AP3-2 AY162859.1; Euptelea p AP3-1, GU357449.1; Euptelea p AP3-2, GU357450.1; Aquilegia v AP3-2, EF489477.1; Thalictrum d AP3-2, AY867876.1; Actaea a AP3-2 HQ647376.1; Delphinium e AP3-2, EU481803.1; Aconitum s AP3-2, EU481817.1.
-
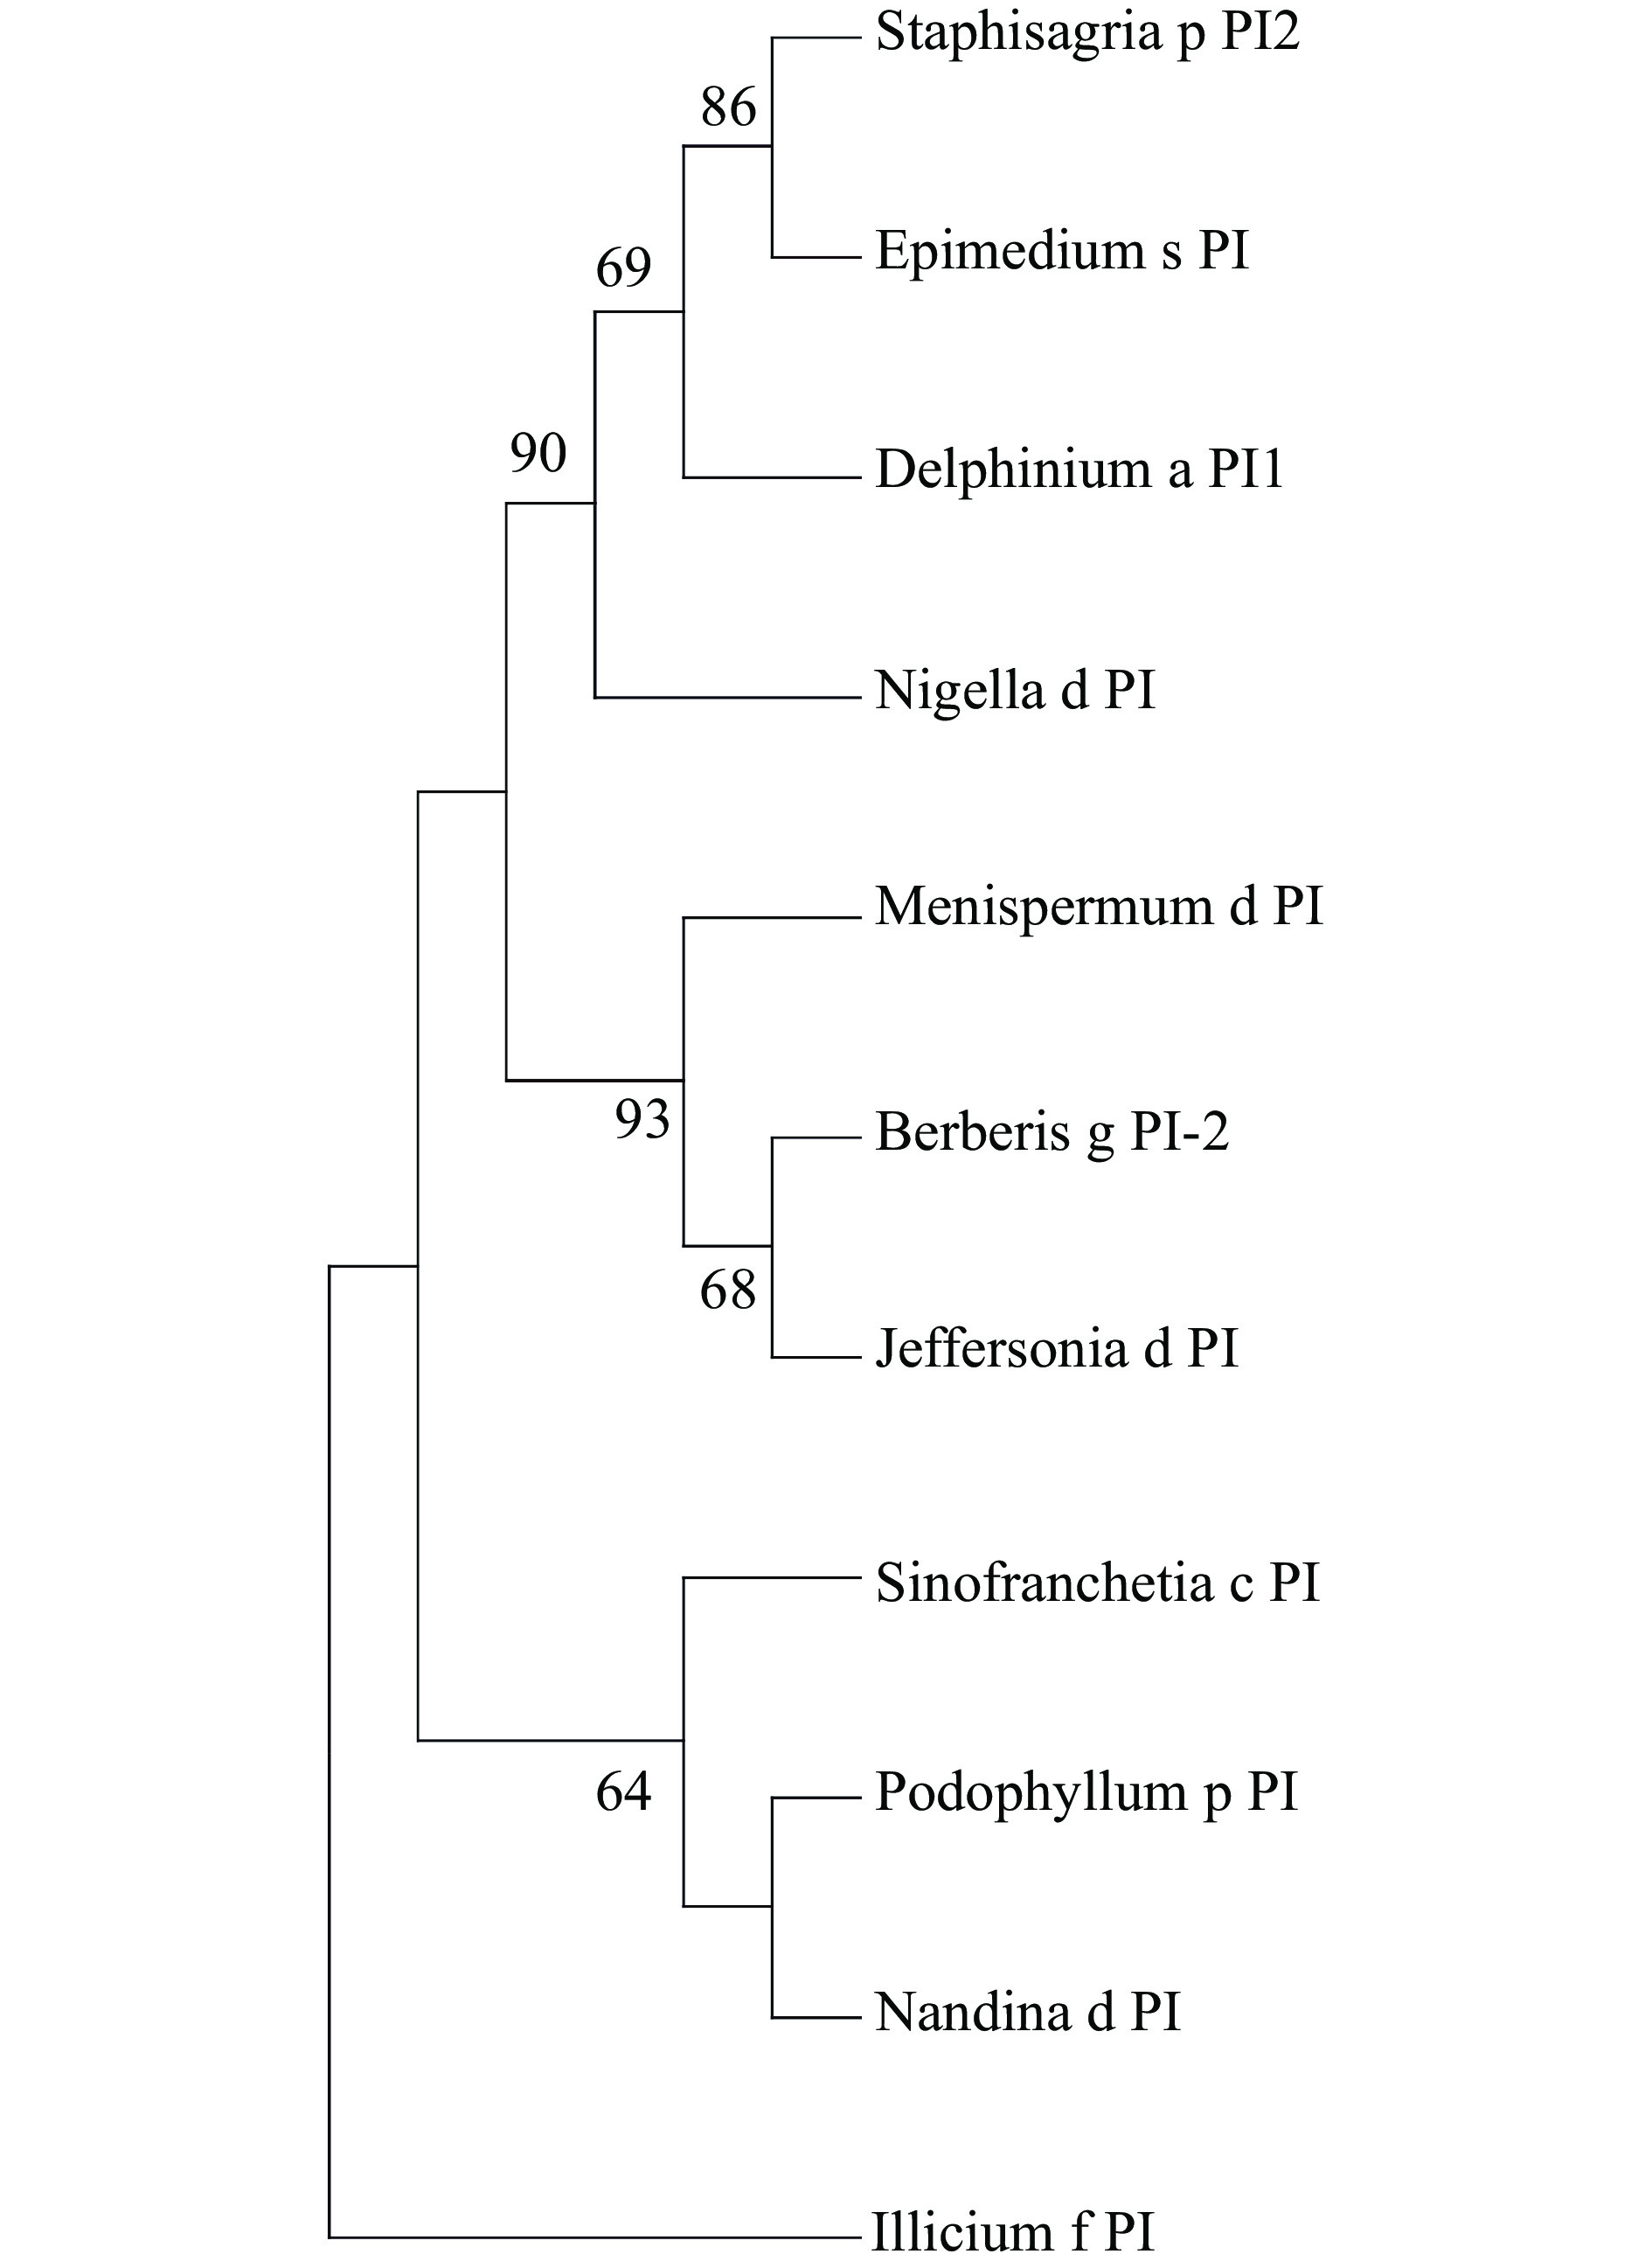
Figure 2.
Phylogeny of PI lineage genes. The ML phylogenetic tree from multiple nucleotide alignments of PI homologs from E. saggitatum and other species was conducted by MEGA software (version 5). The PI sequence from Illicium floridanum was used as an outgroup. Bootstrap test was estimated with 1000 replicate analysis, above 50 support was shown. Genbank Accession Numbers: Podophyllum p PI, HQ694792; Sinofranchetia c PI JQ806397; Staphisagria p PI2 OL469304; Berberis g PI-2 AY162861; Jeffersonia d PI EU481792; Nigella d PI KT984414;Delphinium a PI1 OL469301; Nandina d PI HQ694793; Menispermum d PI EU481787; Illicium f PI AY936224.
-
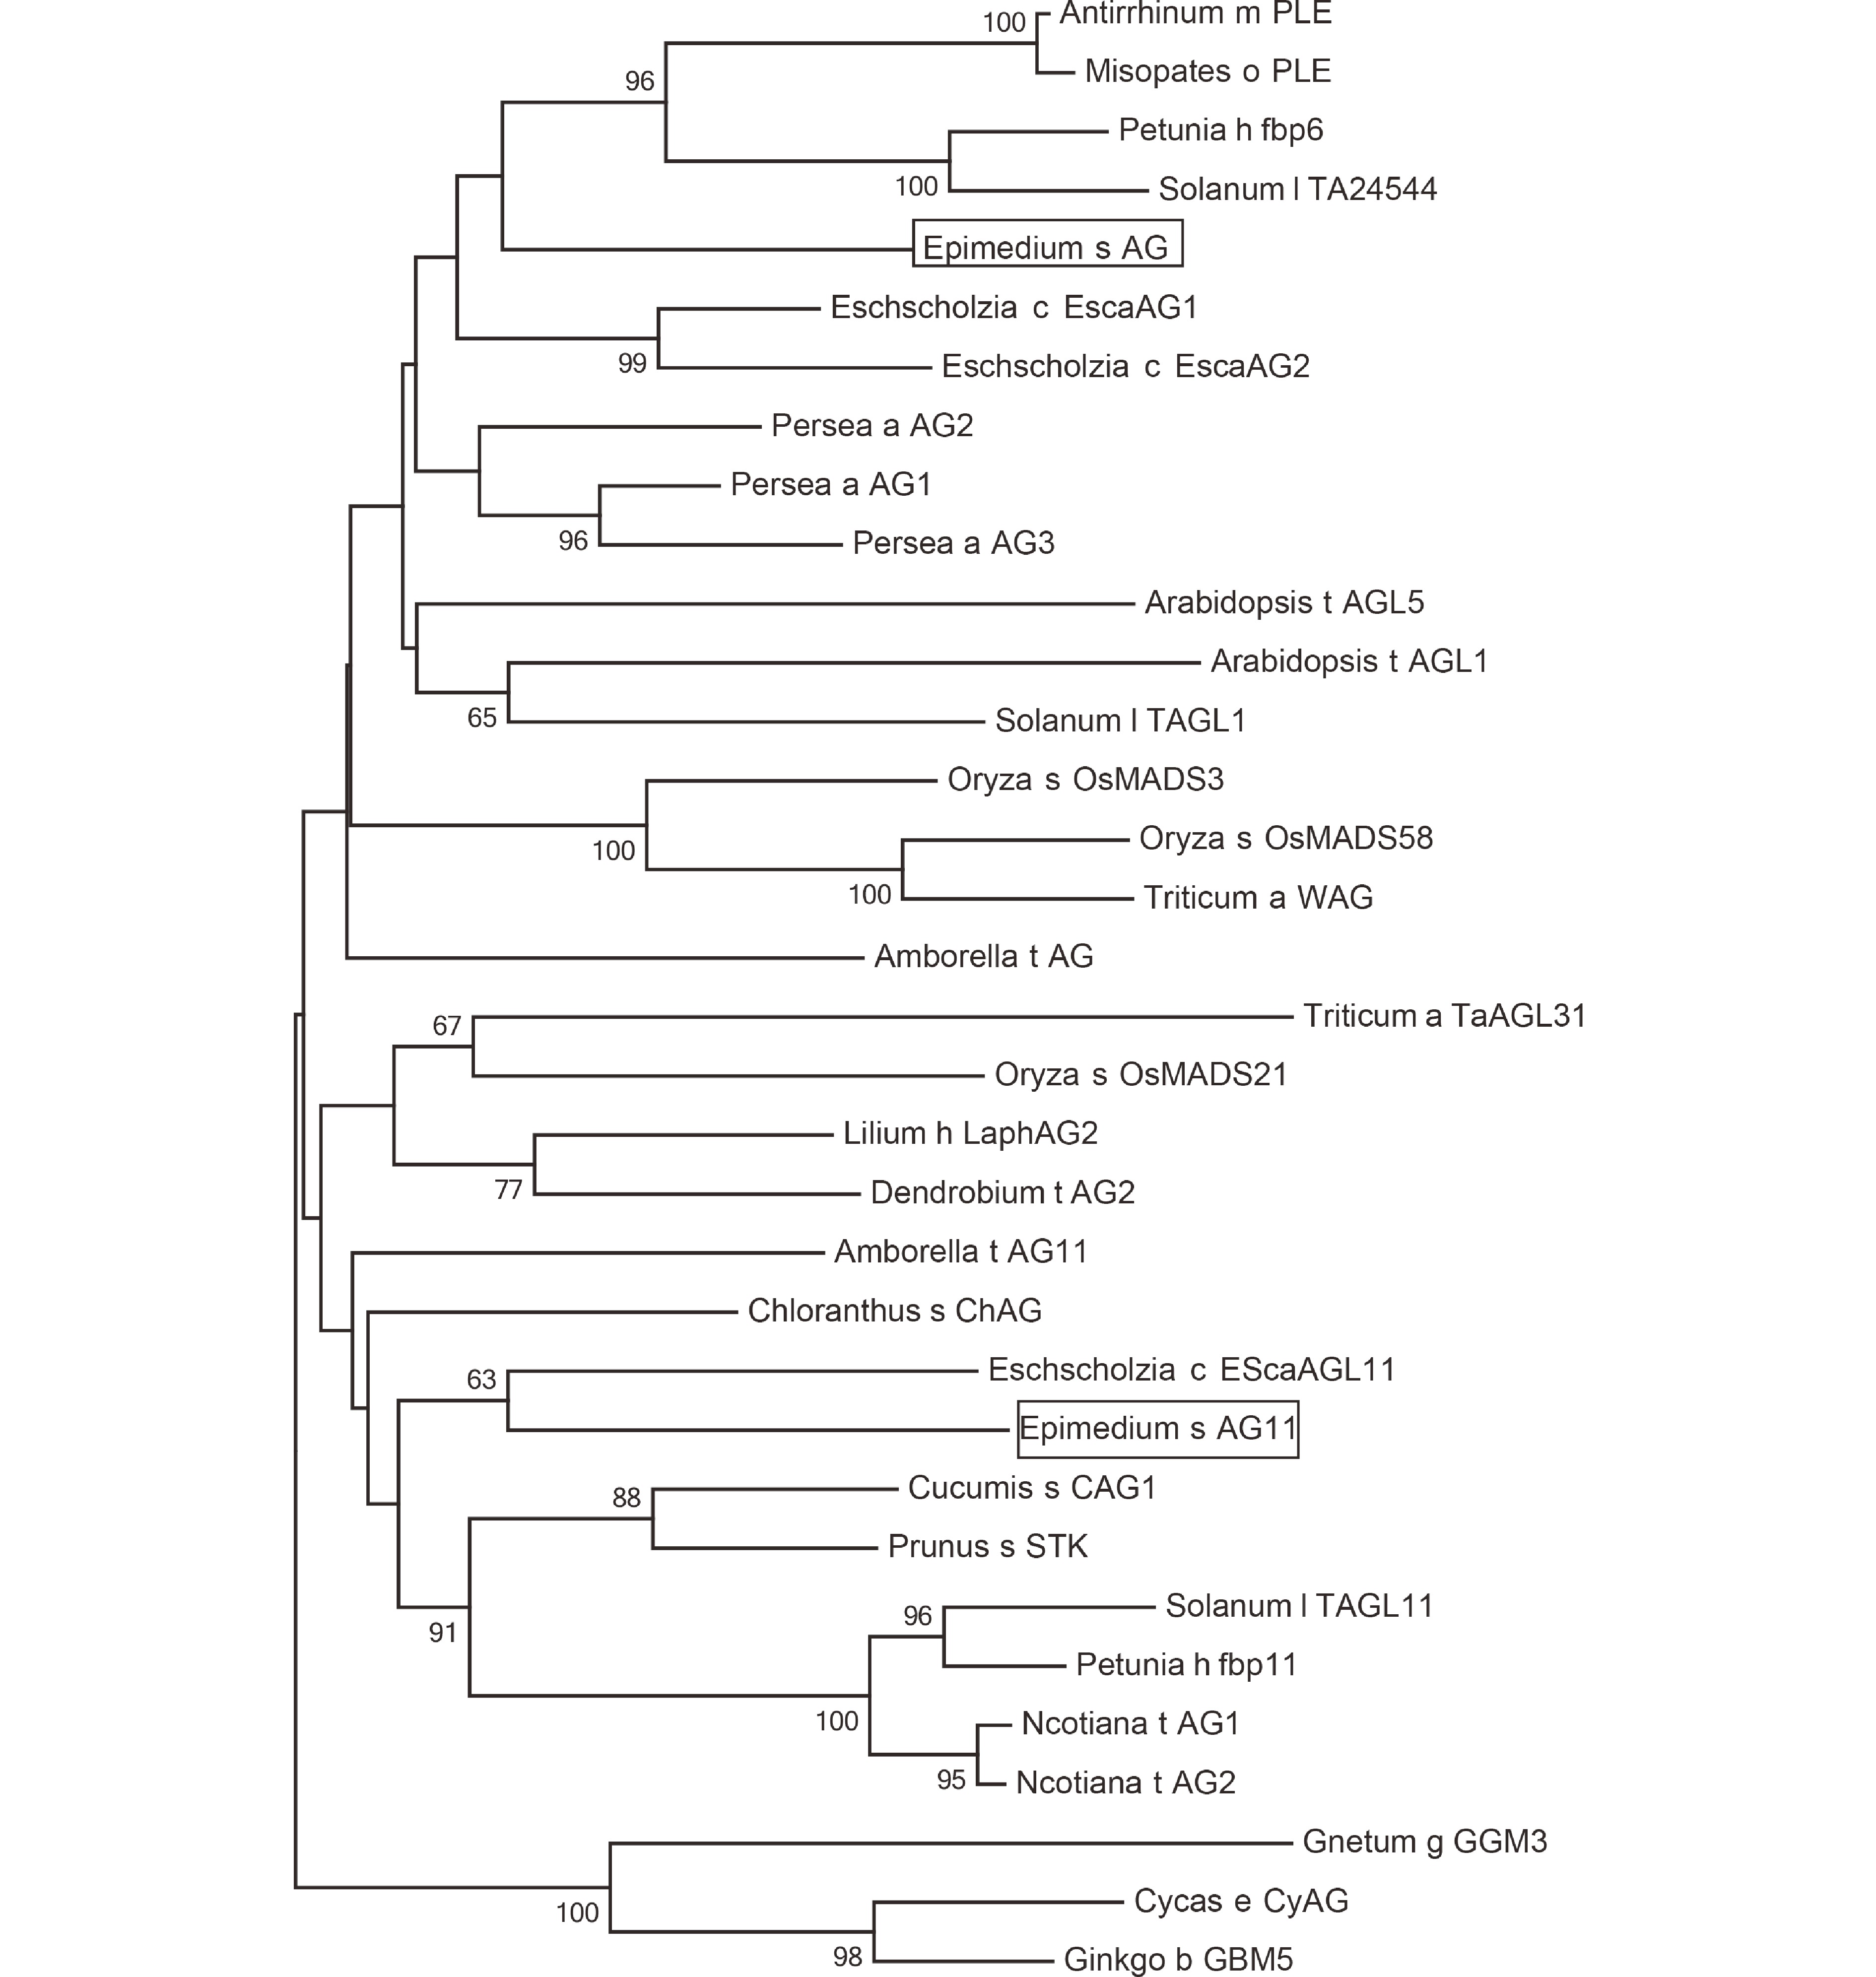
Figure 3.
Phylogeny of AG and AG11 lineage genes from homologs from E. sagittatum and other angiosperm species. The C class genes from Gnetum gnemon, Cycas edentata and Ginkgo biloba sequences were used as an outgroup. The ML phylogenetics tree was constructed by MEGA (version 5). Bootstrap test was estimated with 1000 replicate analysis, above 50 support was shown. Genbank Accession Numbers: Arabidopsis t AGL5, M55553.1; Triticum a TaAGL31, DQ512349.1; Oryza s OsMADS21, FJ750944.1; Arabidopsis t AGL1 NM_118013.2; Eschscholzia c EScaAGL11, DQ088998.1; Lilium h LaphAG2, AB359184.1; Dendrobium t AG2, DQ017703.1; Amborella t AG11, XM_006858527.2; Chloranthus s ChAG, AY464099.1; Solanum l TAGL11, AY098736.2; Nicotiana t AG1, KM205819.1; Nicotiana t AG2, NM_001325570.1; Petunia h fbp11, X81852.1; Cucumis s CAG1, NM_001280577.1; Prunus s STK, GU332504.1; Gnetum g GGM3, AJ132209.1; Oryza s OsMADS3, L37528.1; Oryza s OsMADS58, AB232157.1; Triticum a WAG, AB084577.1; Cycas e CyAG, AF492455.1; Ginkgo b GBM5, GU563899.1; Antirrhinum m PLE, AB516404.1; Misopates o PLE, AM162212.1; Petunia h fbp6, X68675.1; Solanum l TA24544, AY098735.2; Amborella t AG, NM_00 1305835.1; Eschscholzia c EscaAG1, DQ088996.1; Eschscholzia c EscaAG2, DQ088997.1; Persea a AG2, DQ398011.1; Persea a AG1, DQ398021.1; Persea a AG3, DQ398023.1.
-
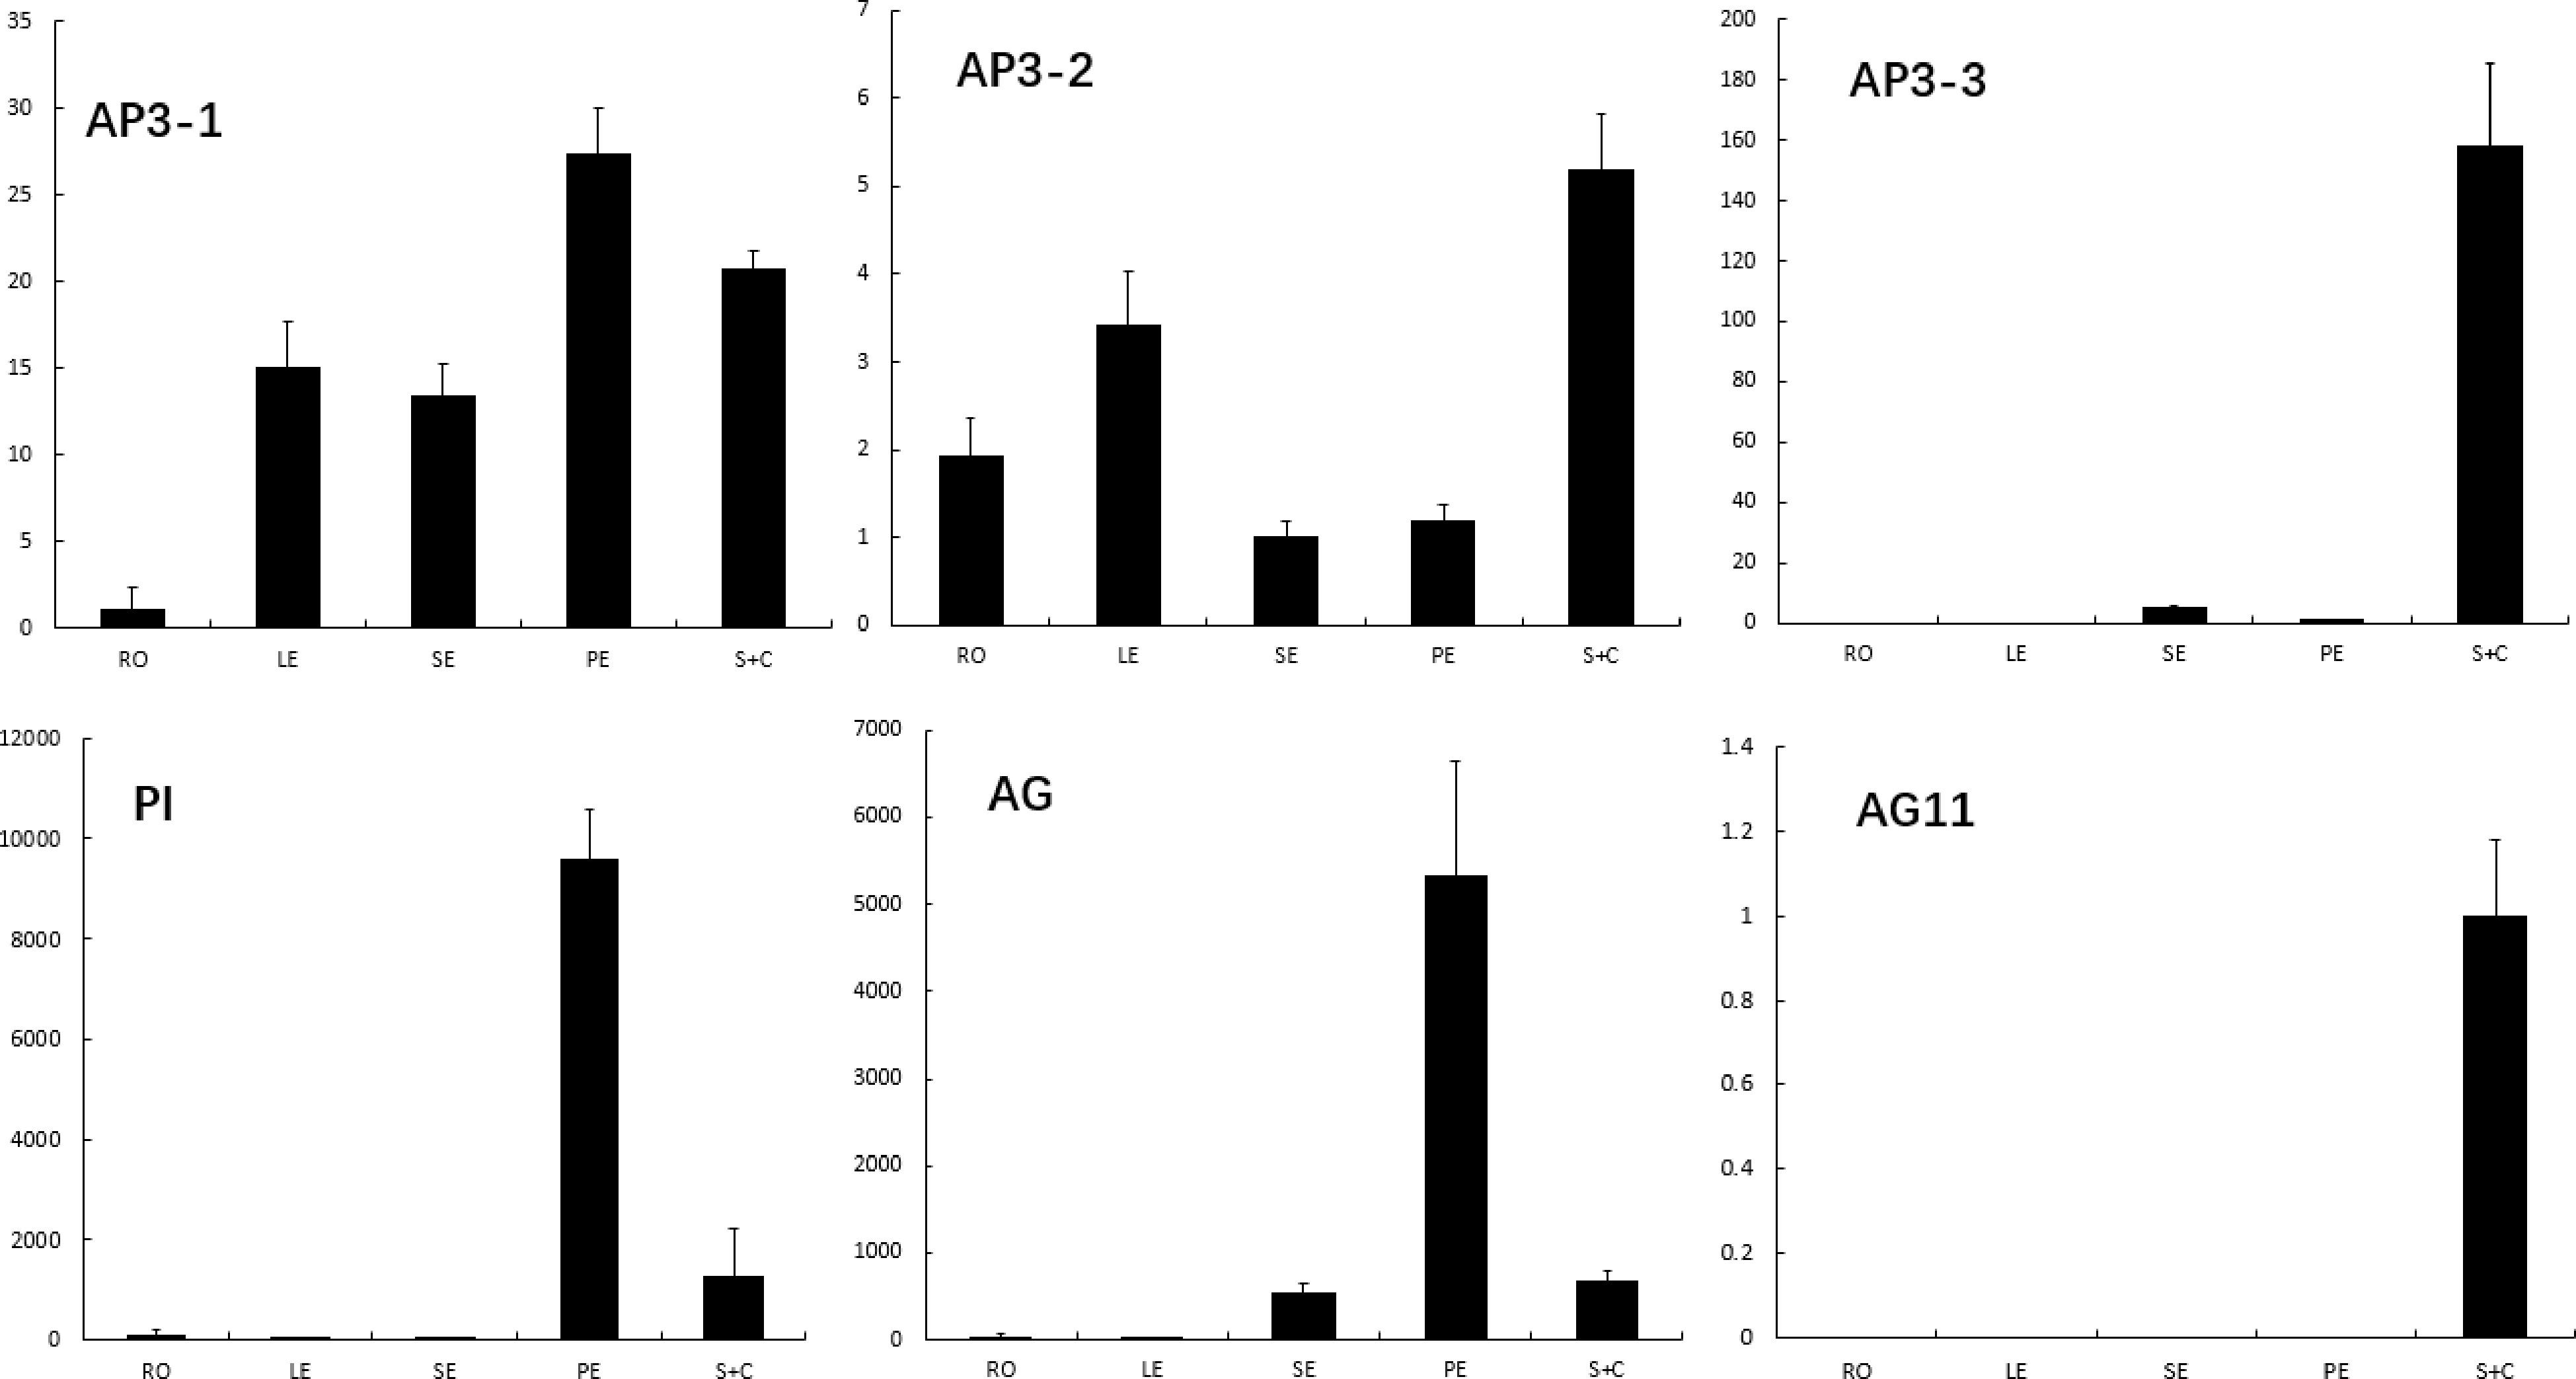
Figure 4.
The expression of E. sagittatum B and C class genes in root, leaf, seqal, petal and combination of stamen and carpel. Error bars represent SE for three technical replicates. The expression of each gene was normalized against the Epimedium actin gene.
-
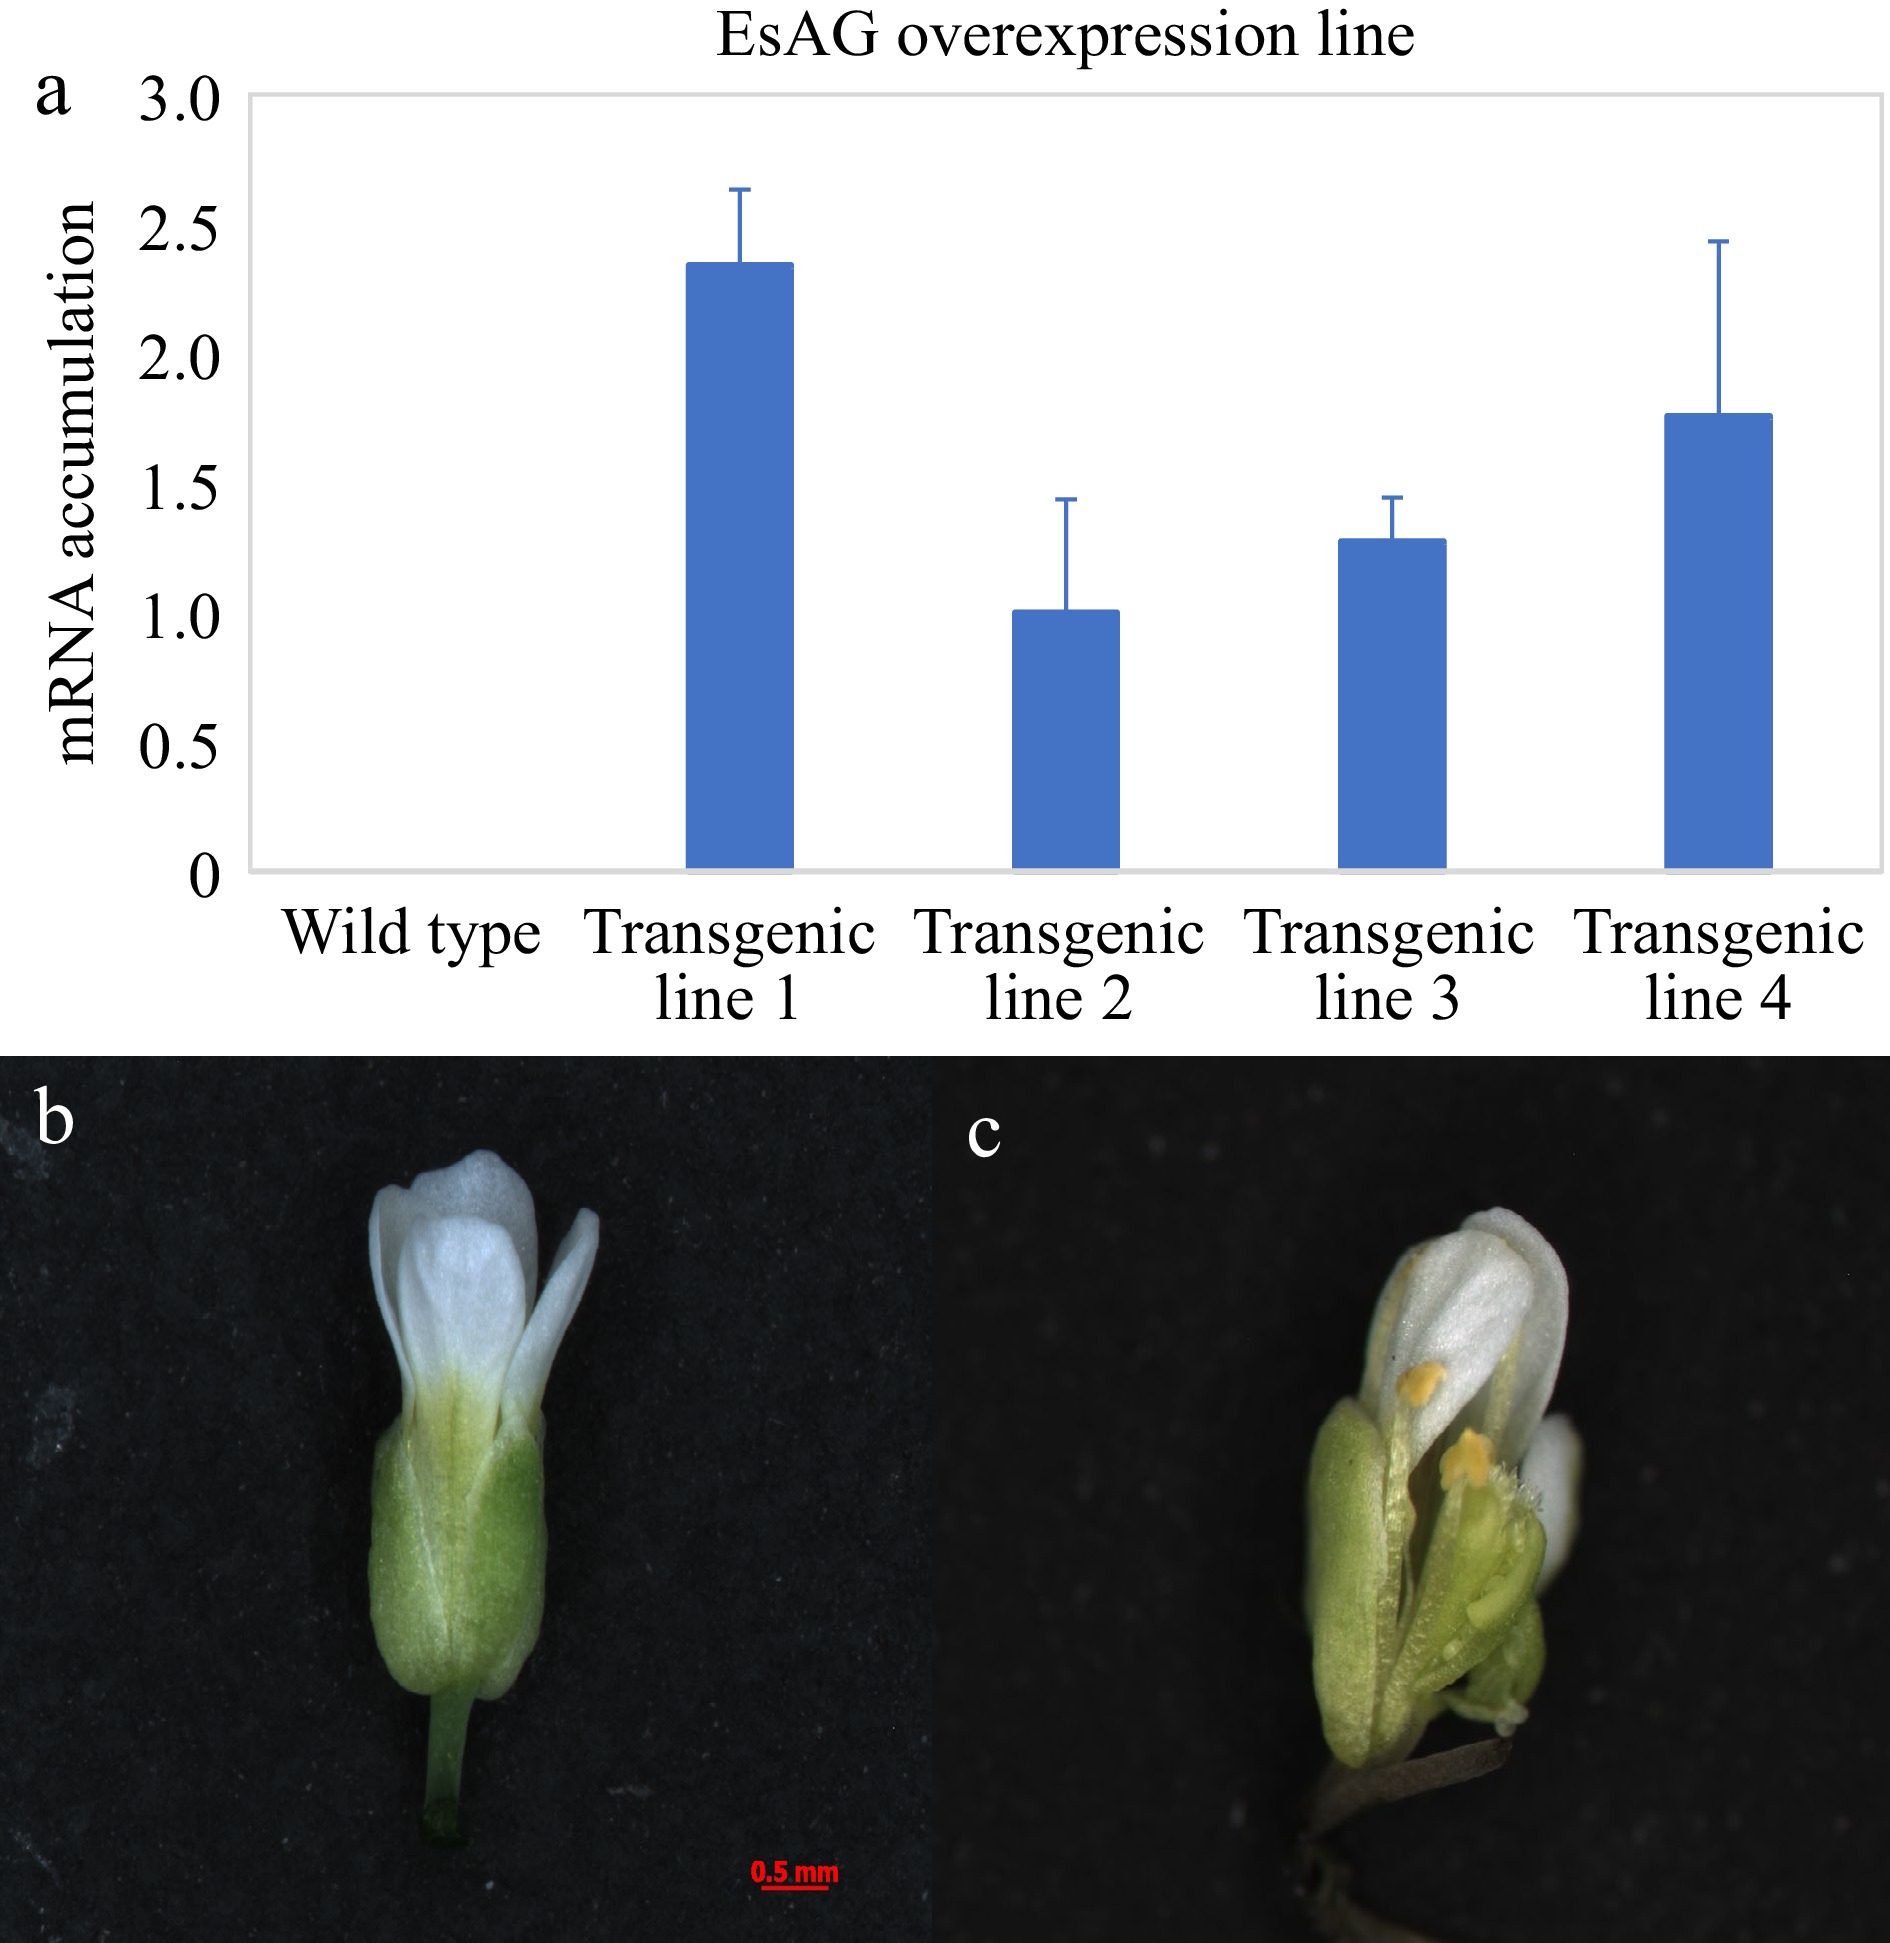
Figure 5.
Functional analysis of EsAG in wild-type Arabidopsis. (a) Analysis of EsAG overexpression lines in 35S::EsAG transgenic Arabidopsis plants. A fragment of Tubulin gene was amplified as an internal control. Error bars represent SE for three technical replicate reactions. (b) The flower of the wild-type Arabidopsis. (c) Phenotype of 35S::EsAG transgenic Arabidopsis in the wild-type background.
-
BD-EsAP3-1 BD-EsAP3-2 BD-EsAP3-3 BD-EsPI BD-EsAG BD-EsAG11 AD-EsAP3-1 + + + + − − AD-EsAP3-2 + − + − − − AD-EsAP3-3 − − − − − − AD-EsPI + − +/− − − − AD-EsAG − − − − − − AD-EsAG11 − − − − − − Table 1.
Data from yeast two-hybrid assay. EsAP3-1, EsAP3-2, EsAP3-3, and EsPI were added to both an activation and GAL4 binding domains. Interactions were analyzed using SD/-Ade/-His/-Trp/-Leu plates containing 10 mM of 3-amino-1,2,4-triazole. Three replicates were analyzed for each experiment.
-
Ternary complex -LTAH + 10 mM 3AT,
28C and LacZiAD-EsPI + pTFT-AP3-1ΔM + BD − AD-EsPI + pTFT-AP3-2ΔM + BD − AD-EsPI + pTFT-AP3-3ΔM + BD − AD-EsPI + pTFT-PIΔM + BD − AD-EsPI + pTFT-AP3-1ΔM + BD-EsAG − AD-EsPI + pTFT-AP3-1ΔM + BD-EsAG11 − AD-EsPI + pTFT-AP3-2ΔM + BD-EsAG + AD-EsPI + pTFT-AP3-2ΔM + BD-EsAG11 + AD-EsPI + pTFT-AP3-3ΔM + BD-EsAG − AD-EsPI + pTFT-AP3-3ΔM + BD-EsAG11 + AD-EsPI + pTFT-PIΔM + BD-EsAG − AD-EsPI + pTFT-PIΔM + BD-EsAG11 + AD + pTFT-AP3-1ΔM + BD-EsAG − AD + pTFT-AP3-1ΔM + BD-EsAG11 − AD + pTFT-AP3-2ΔM + BD-EsAG − AD + pTFT-AP3-2ΔM + BD-EsAG11 − AD + pTFT-AP3-3ΔM + BD-EsAG − AD + pTFT-AP3-3ΔM + BD-EsAG11 − AD + pTFT-PIΔM + BD-EsAG11 − AD + pTFT-PIΔM + BD-EsAG11 − Table 2.
Data from yeast three-hybrid assay examining the formation of higher order protein complexes.
Figures
(5)
Tables
(2)