-
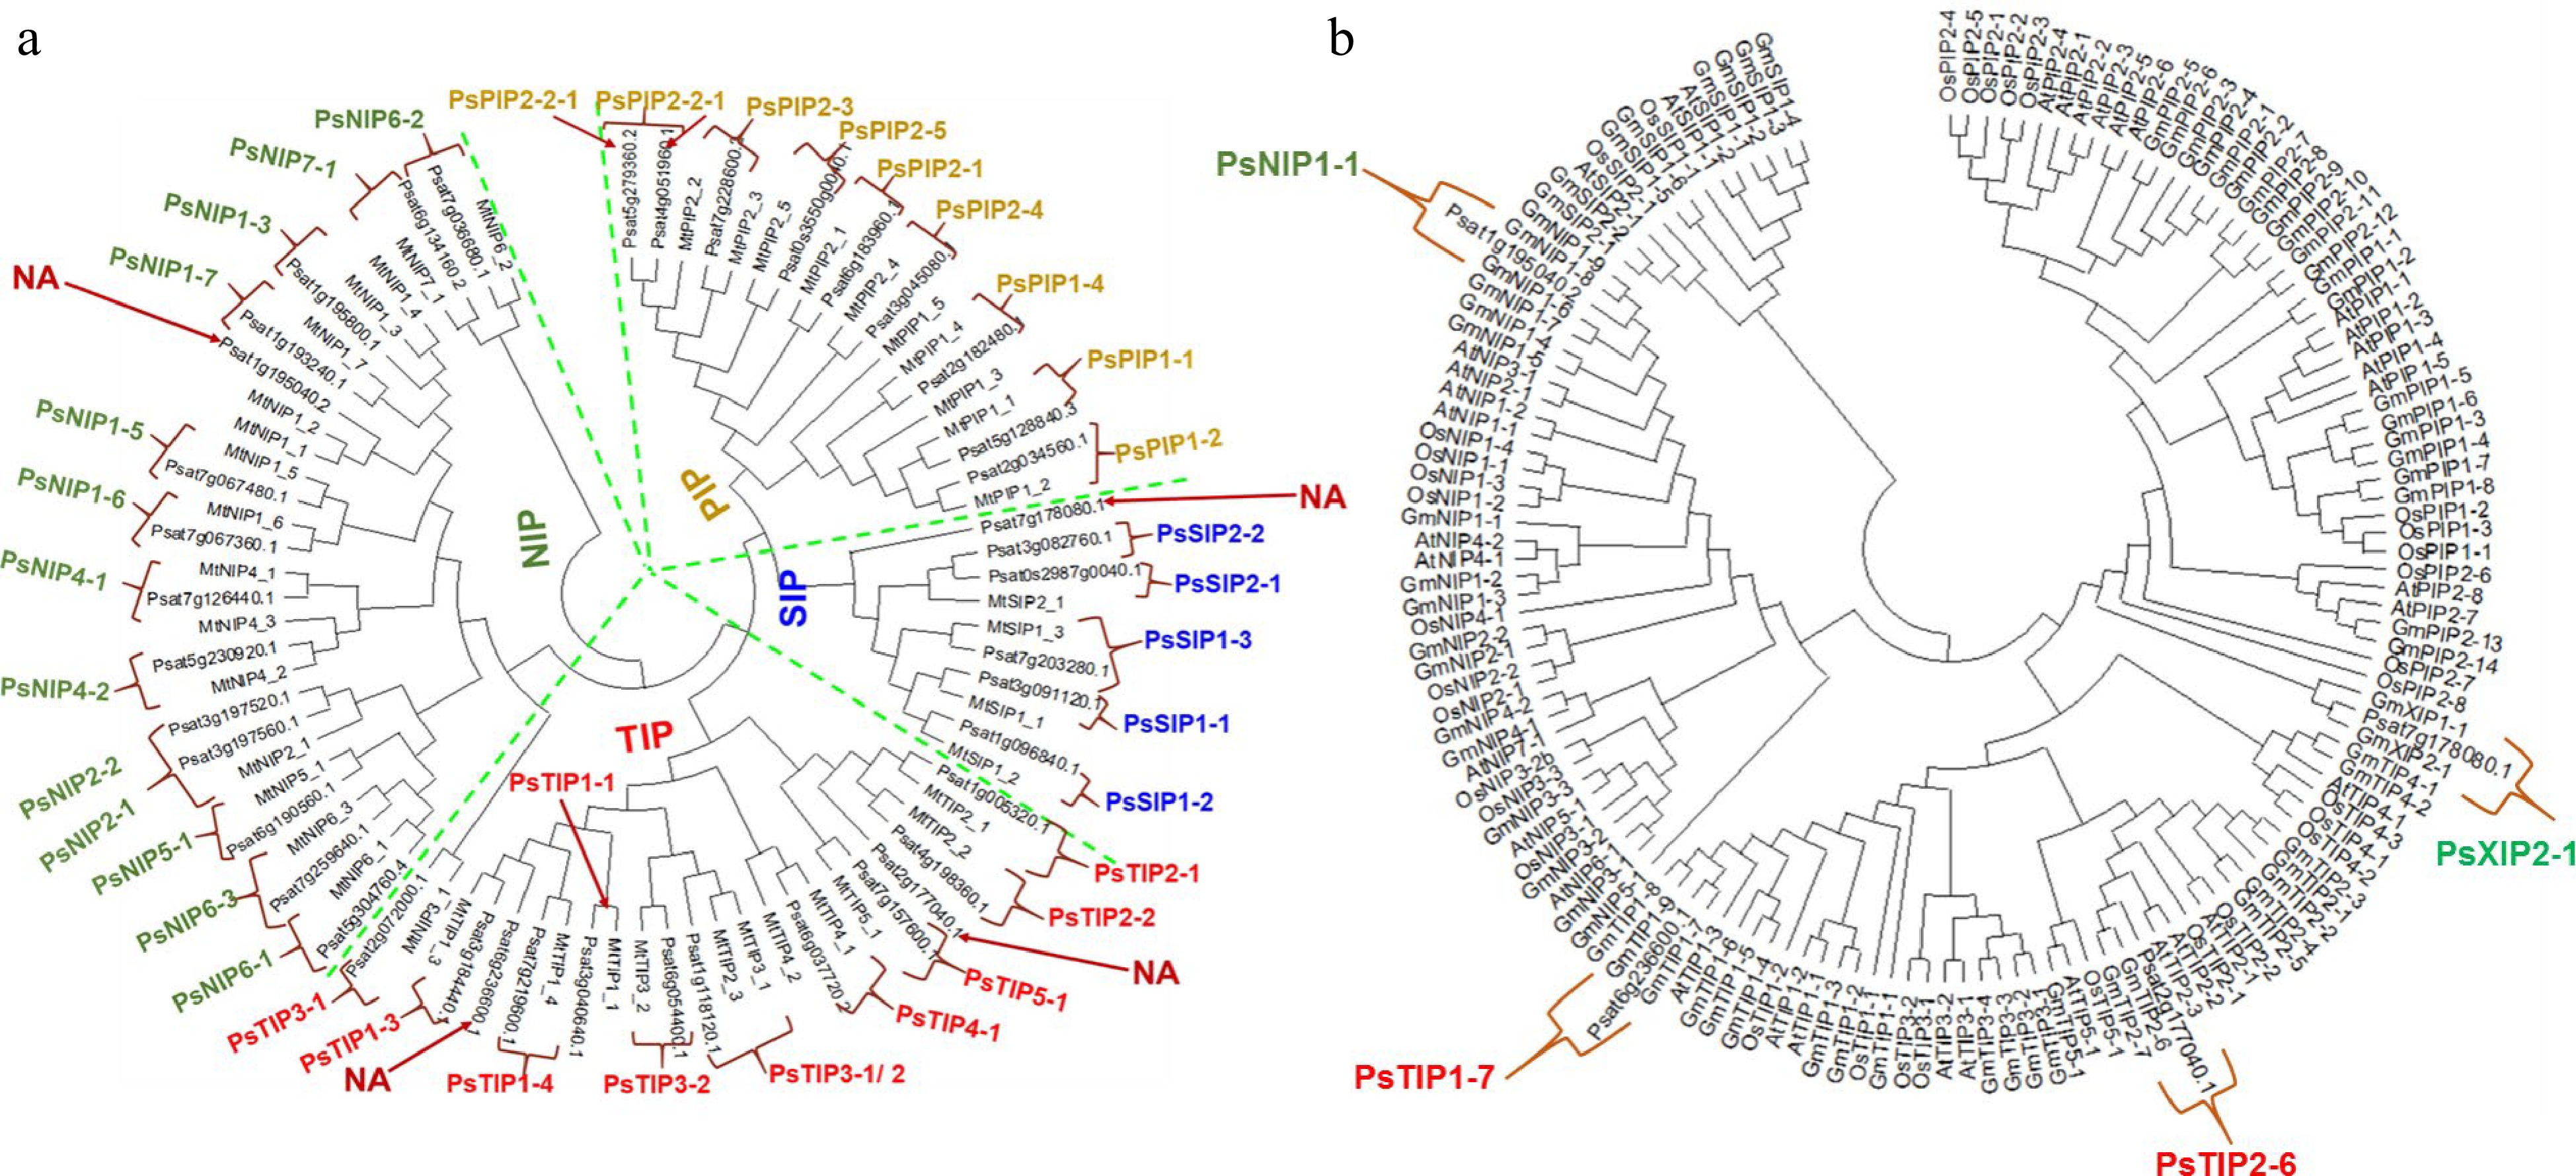
Figure 1.
Phylogenetic analysis of the identified AQPs from pea genome. (a) The pea AQPs proteins aligned with those from the cool-season legume Medicago truncatual. (b) The four un-assigned pea AQPs in (a) (denoted as NA) were further aligned with the AQPs of rice, soybean, and Arabidopsis by using the Clustal W program implemented in MEGA 7 software. The nomenclature of PsAQPs was based on homology with the identified aquaporins that were clustered together.
-
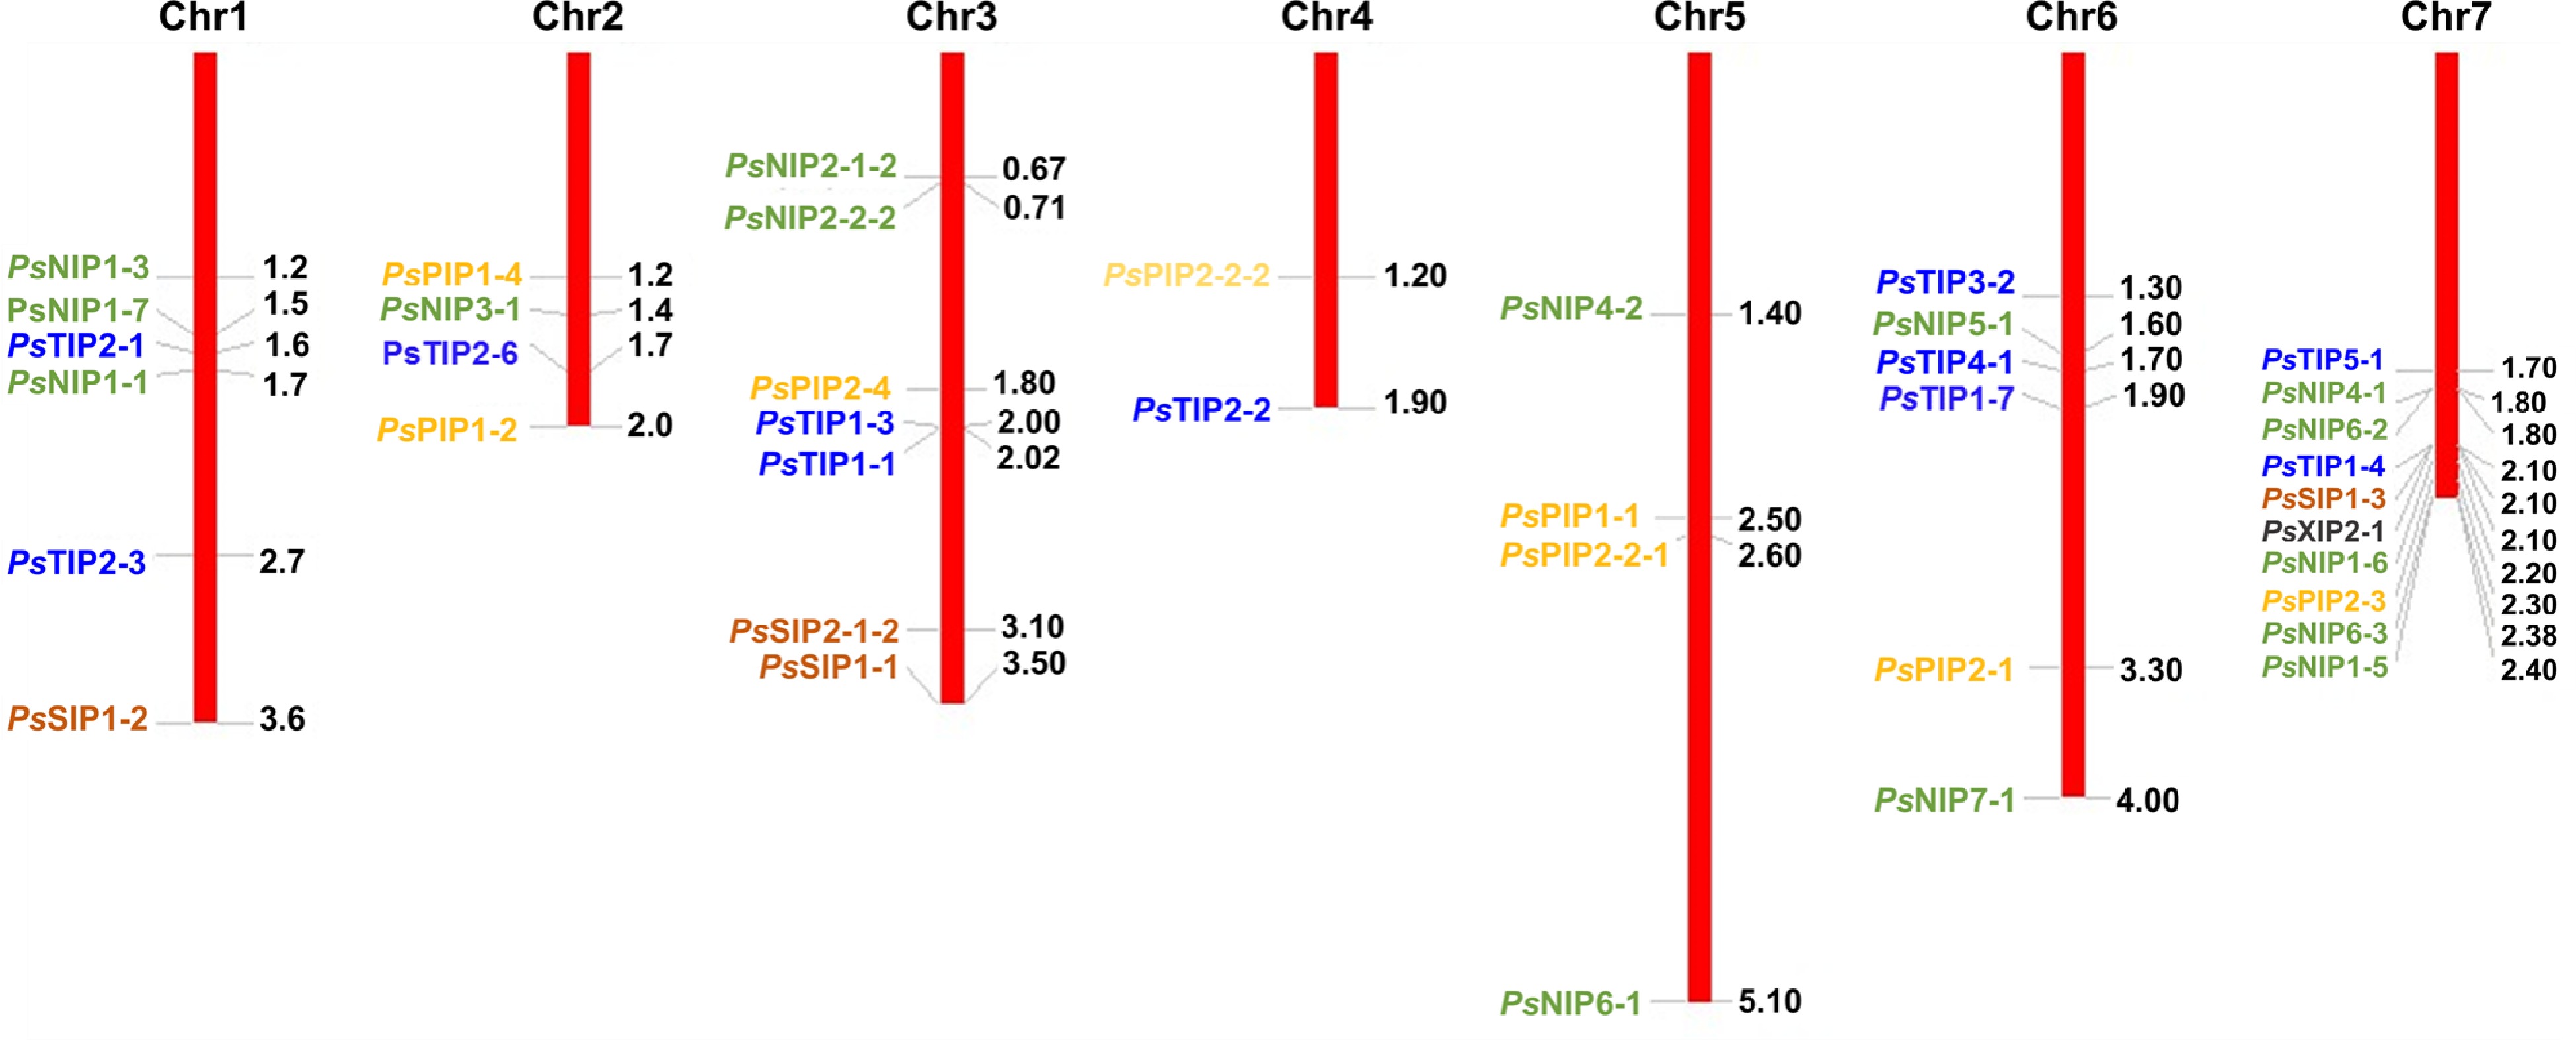
Figure 2.
Chromosomal localization of the 41 PsAQPs on the seven chromosomes of pea. Chr1-7 represents the chromosomes 1 to 7. The numbers on the right of each chromosome show the physical map positions of the AQP genes (Mbp). Blue, green, orange, brown, and black colors represent TIPs, NIPs, PIPs, SIPs, and XIP, respectively.
-
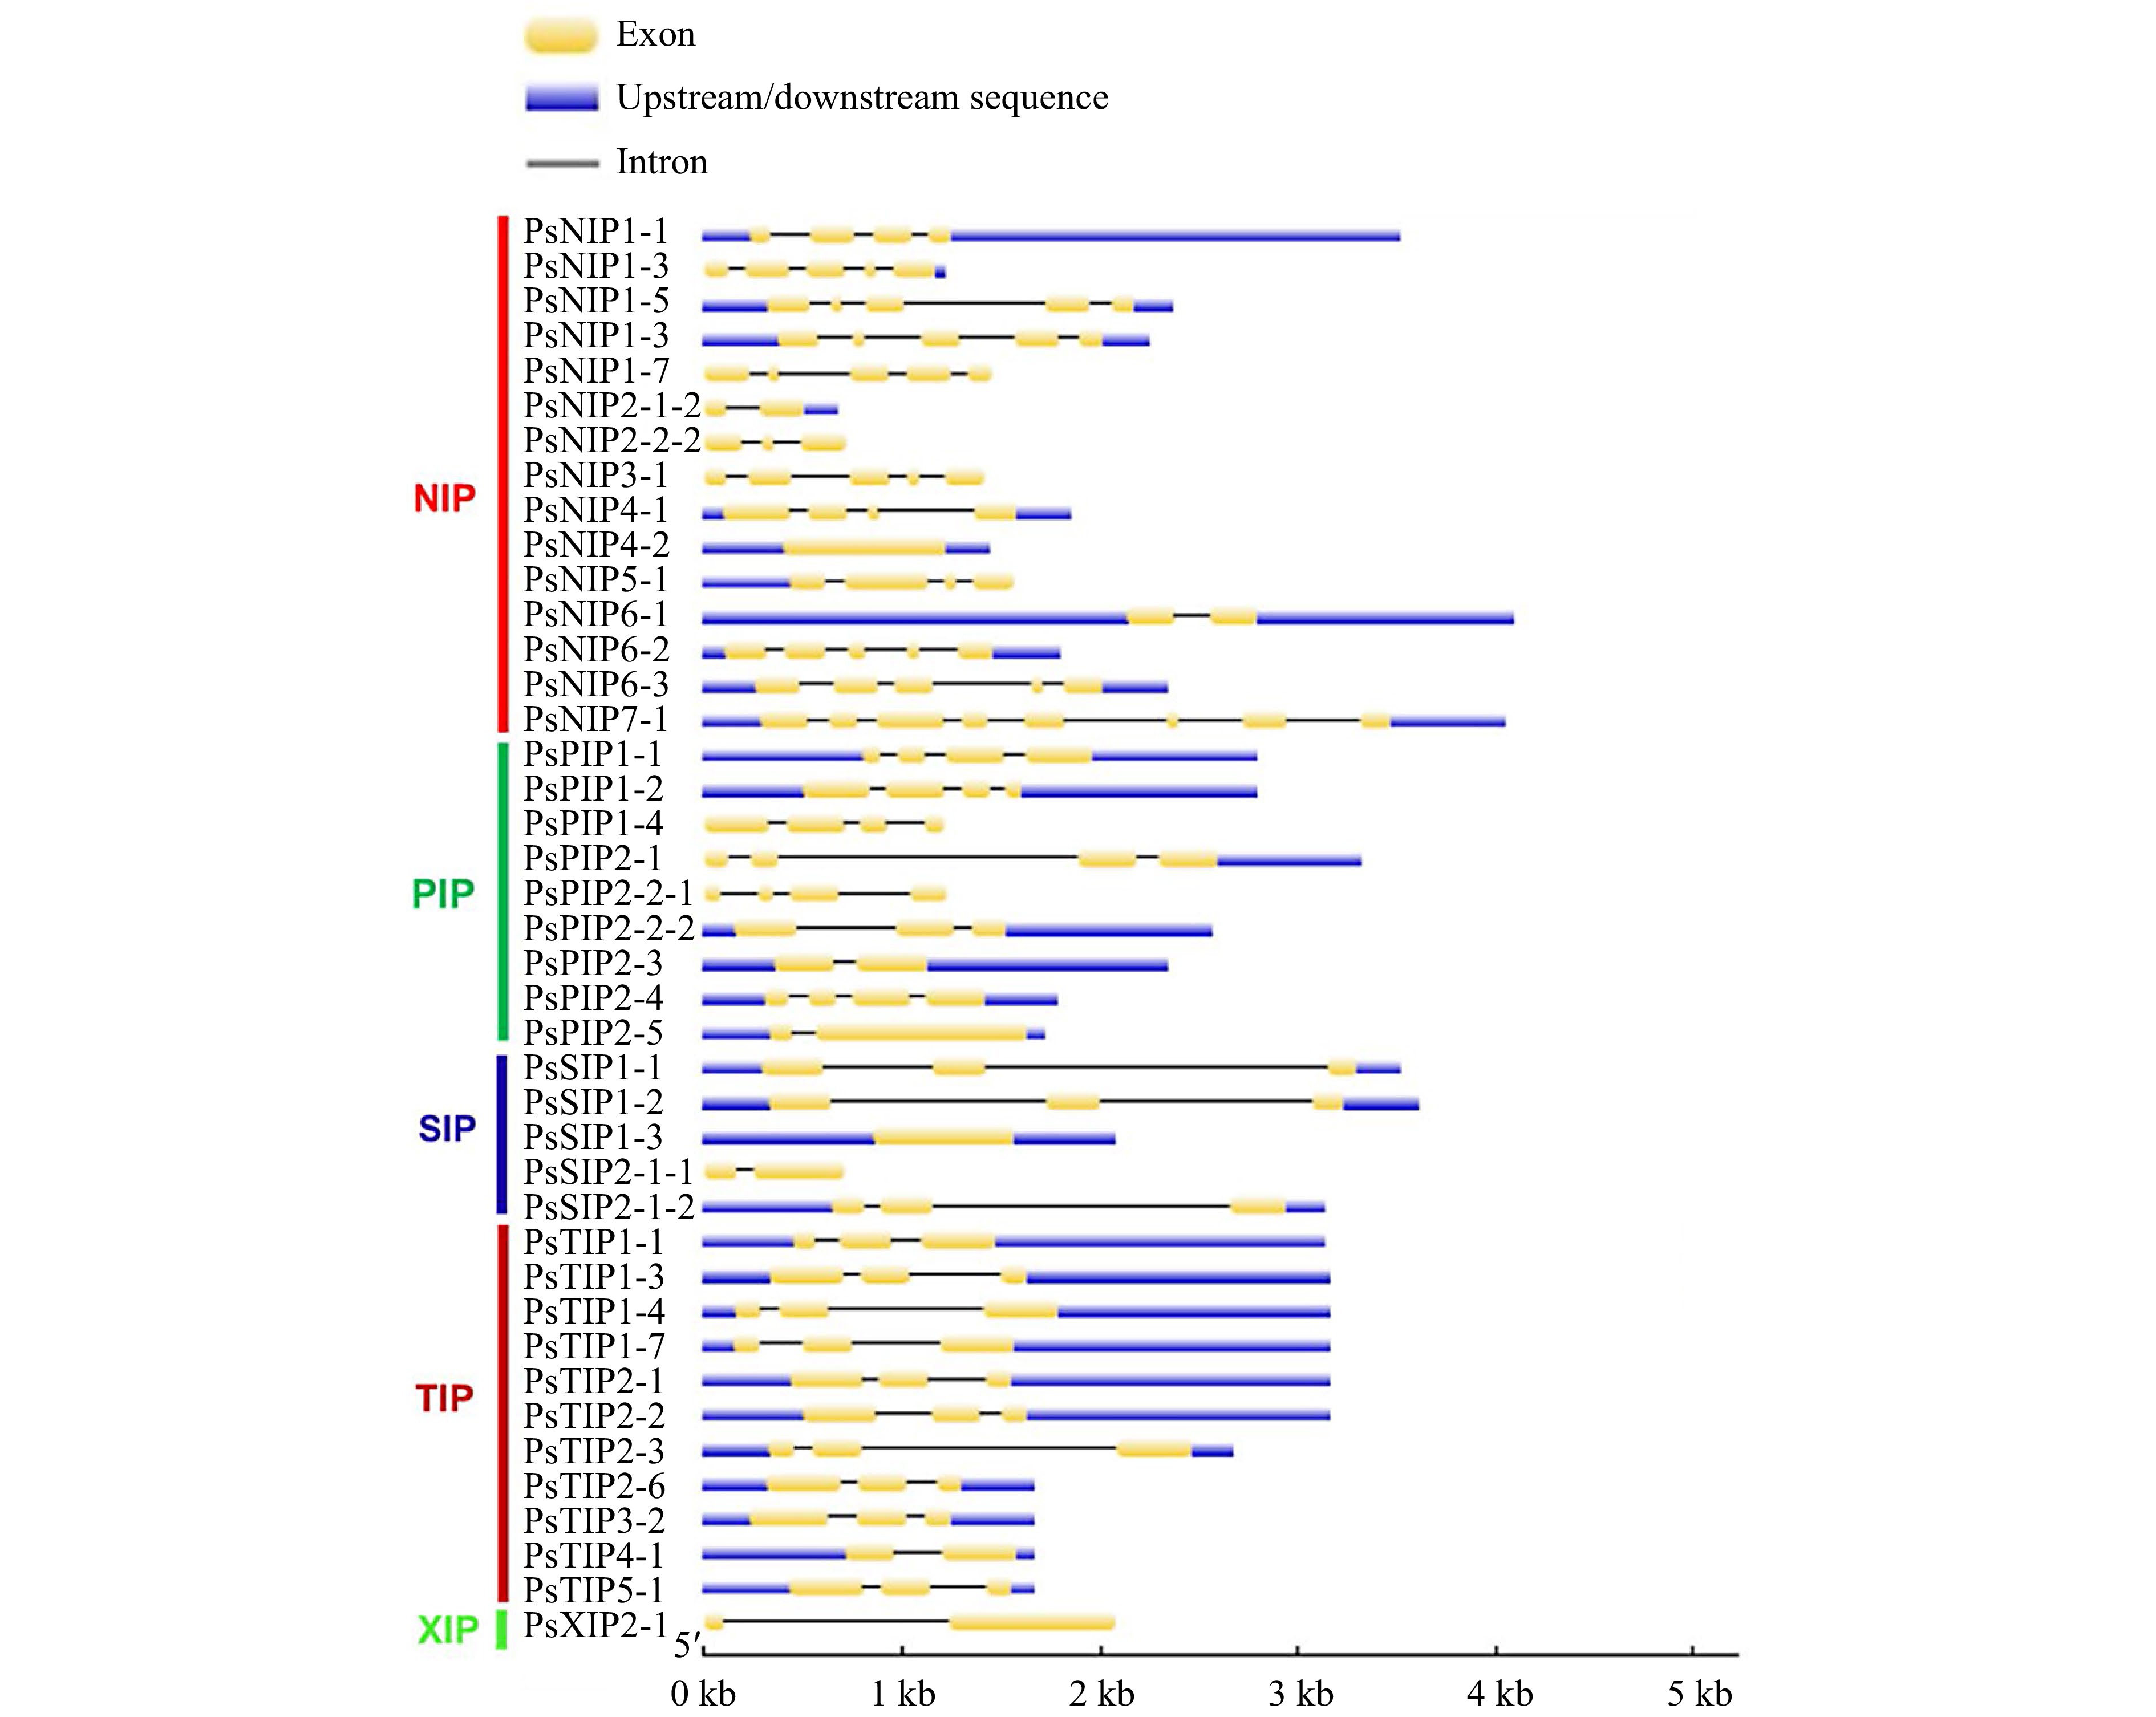
Figure 3.
The exon-intron structures of the AQP genes in pea. Upstream/downstream region, exon, and intron are represented by a blue box, yellow box, and grey line, respectively.
-
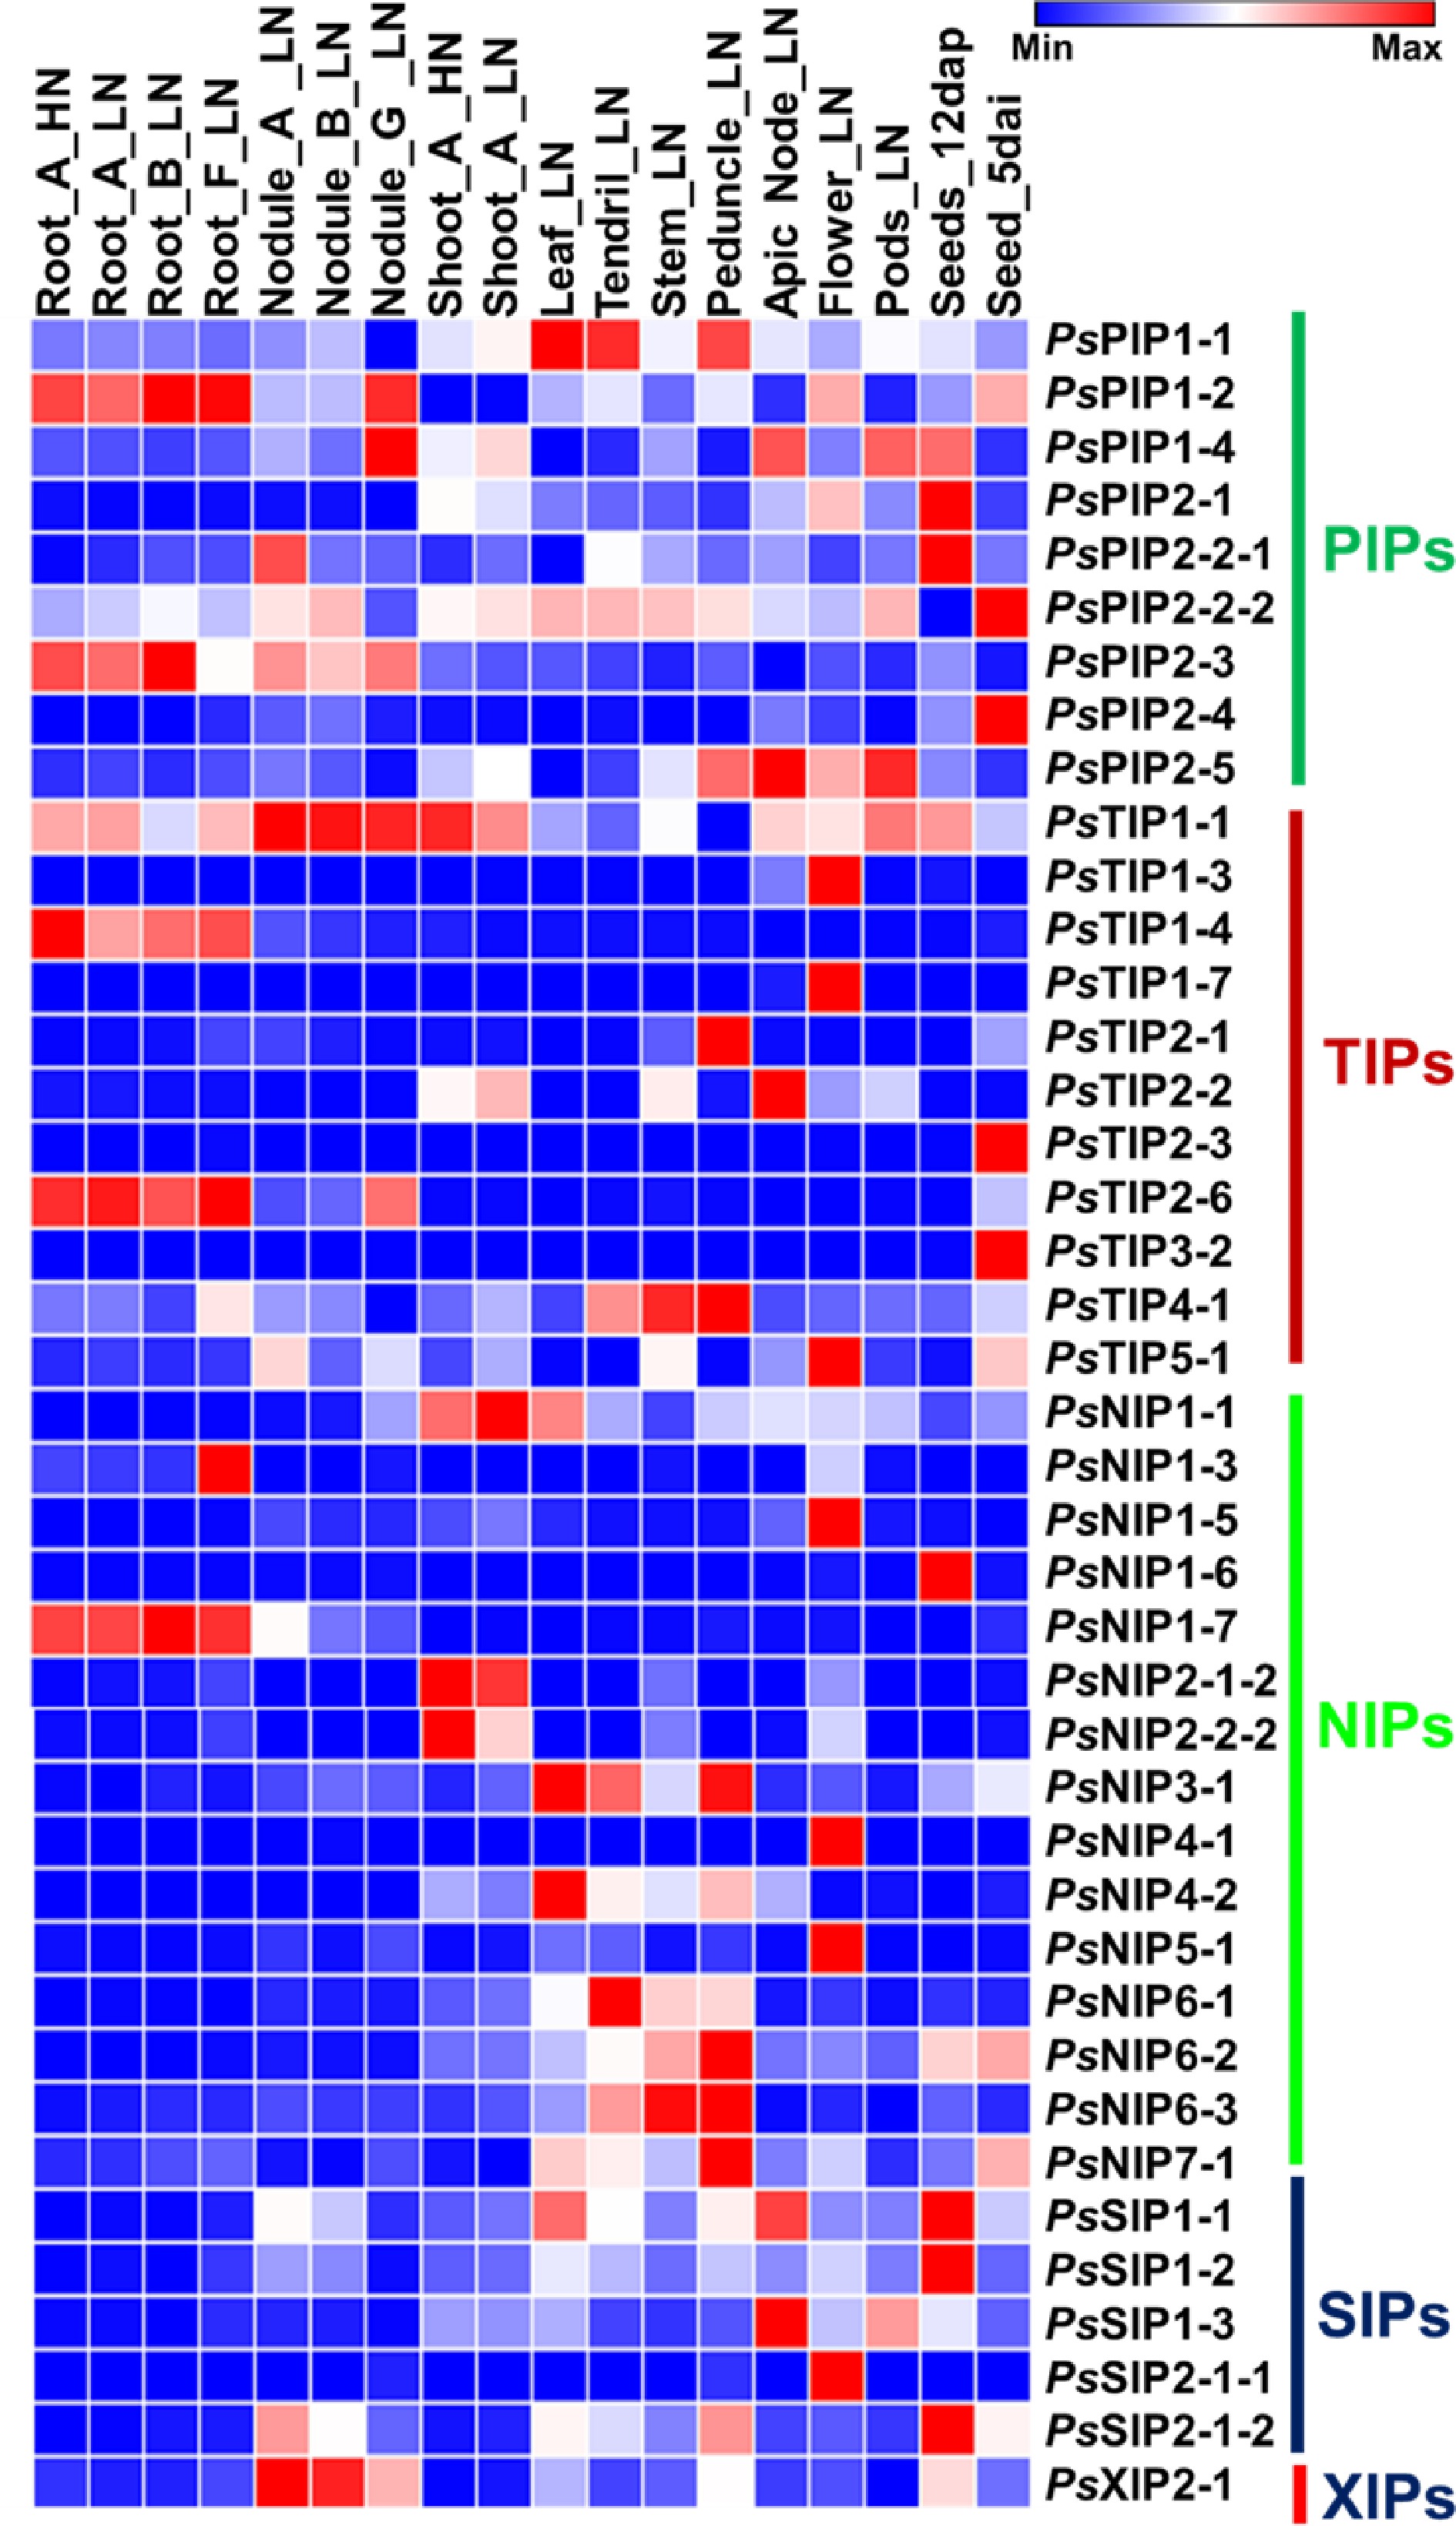
Figure 4.
Heatmap analysis of the expression of pea AQP gene expressions in different tissues using RNA-seq data (PRJNA267198). Normalized expression of aquaporins in terms of reads per kilobase of transcript per million mapped reads (RPKM) showing higher levels of PIPs, NIPs, TIPs SIPs, and XIP expression across the different tissues analyzed. (Stage A represents 7-8 nodes; stage B represents the start of flowering; stage D represents germination, 5 d after imbibition; stage E represents 12 d after pollination; stage F represents 8 d after sowing; stage G represents 18 d after sowing, LN: Low-nitrate; HN: High-nitrate.
-
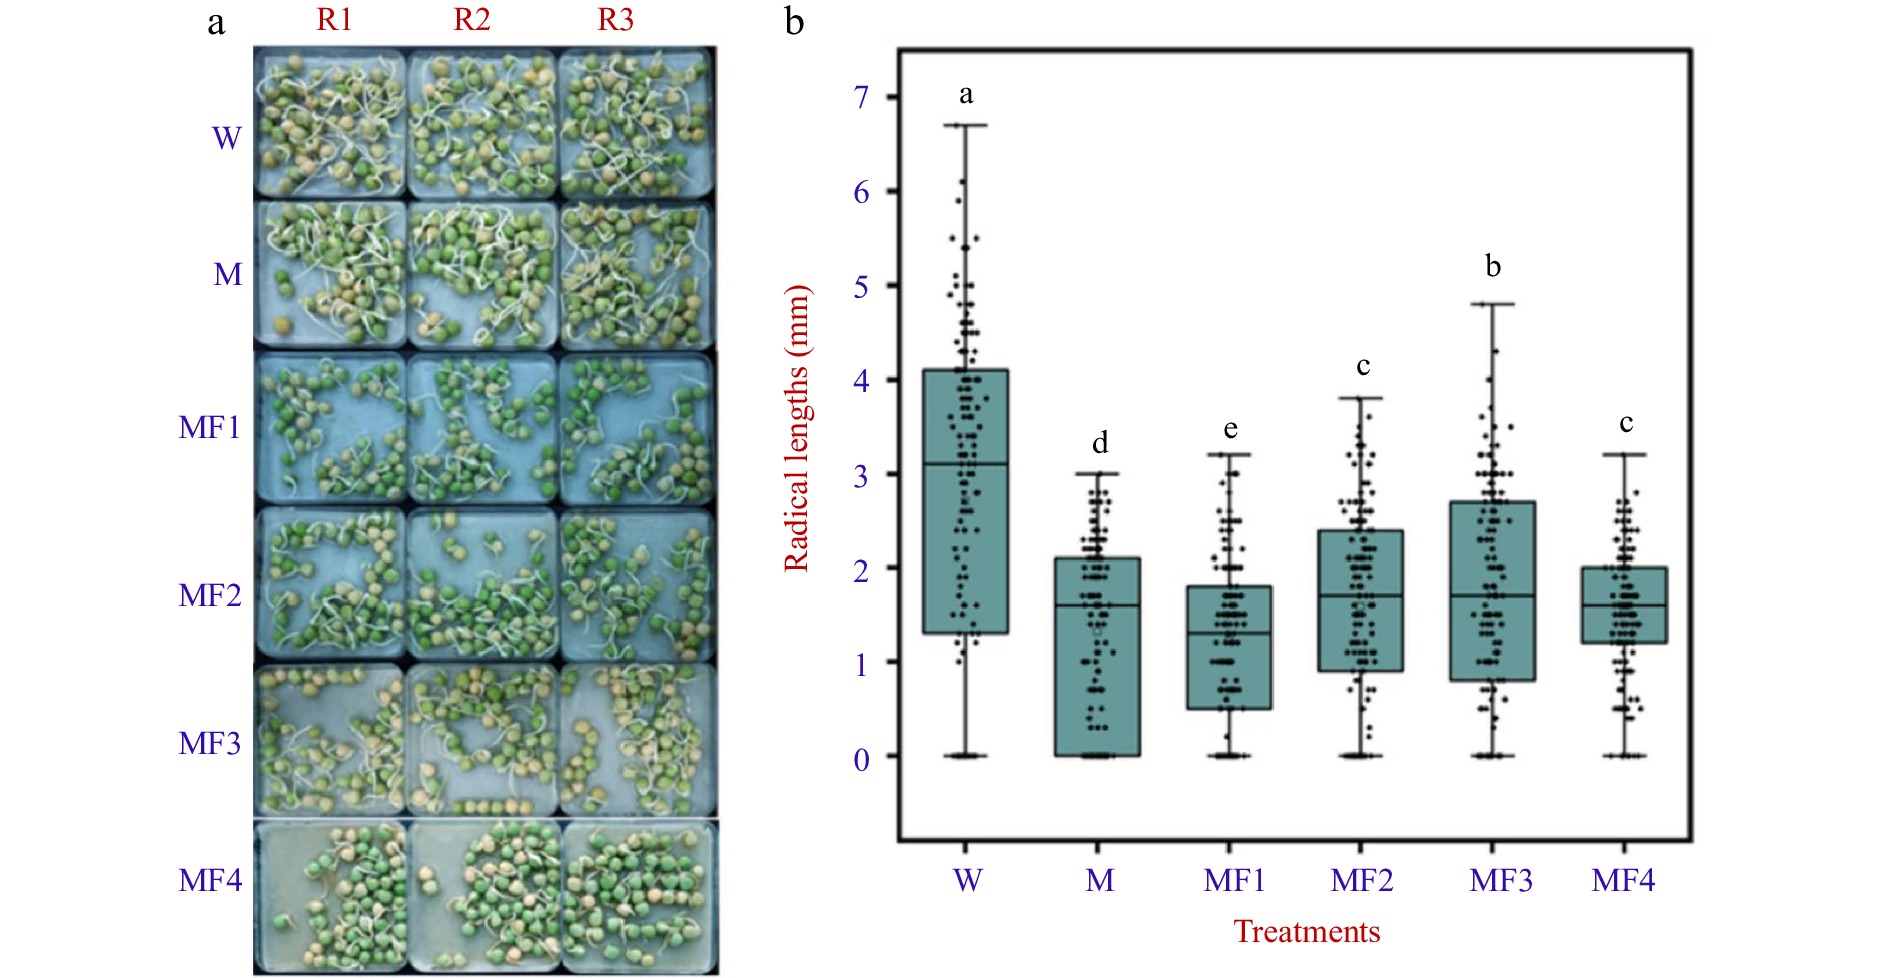
Figure 5.
The visual phenotype and radicle length of pea seeds treated with water (W), 0.3 M mannitol (M), and fullerol of different concentrations dissolved in 0.3 M mannitol (MF). MF1, MF2, MF3, and MF4 indicated fullerol dissolved in 0.3 M mannitol at the concentration of 10, 50, 100, and 500 mg/L, respectively. (a) One hundred and fifty grains of pea seeds each were used for phenotype analysis at 72 h after treatment. Radicle lengths were measured using a ruler in three replicates R1, R2, and R3 in all the treatments. (b) Multiple comparison results determined using the SSR-Test method were shown with lowercase letters to indicate statistical significance (P < 0.05).
-
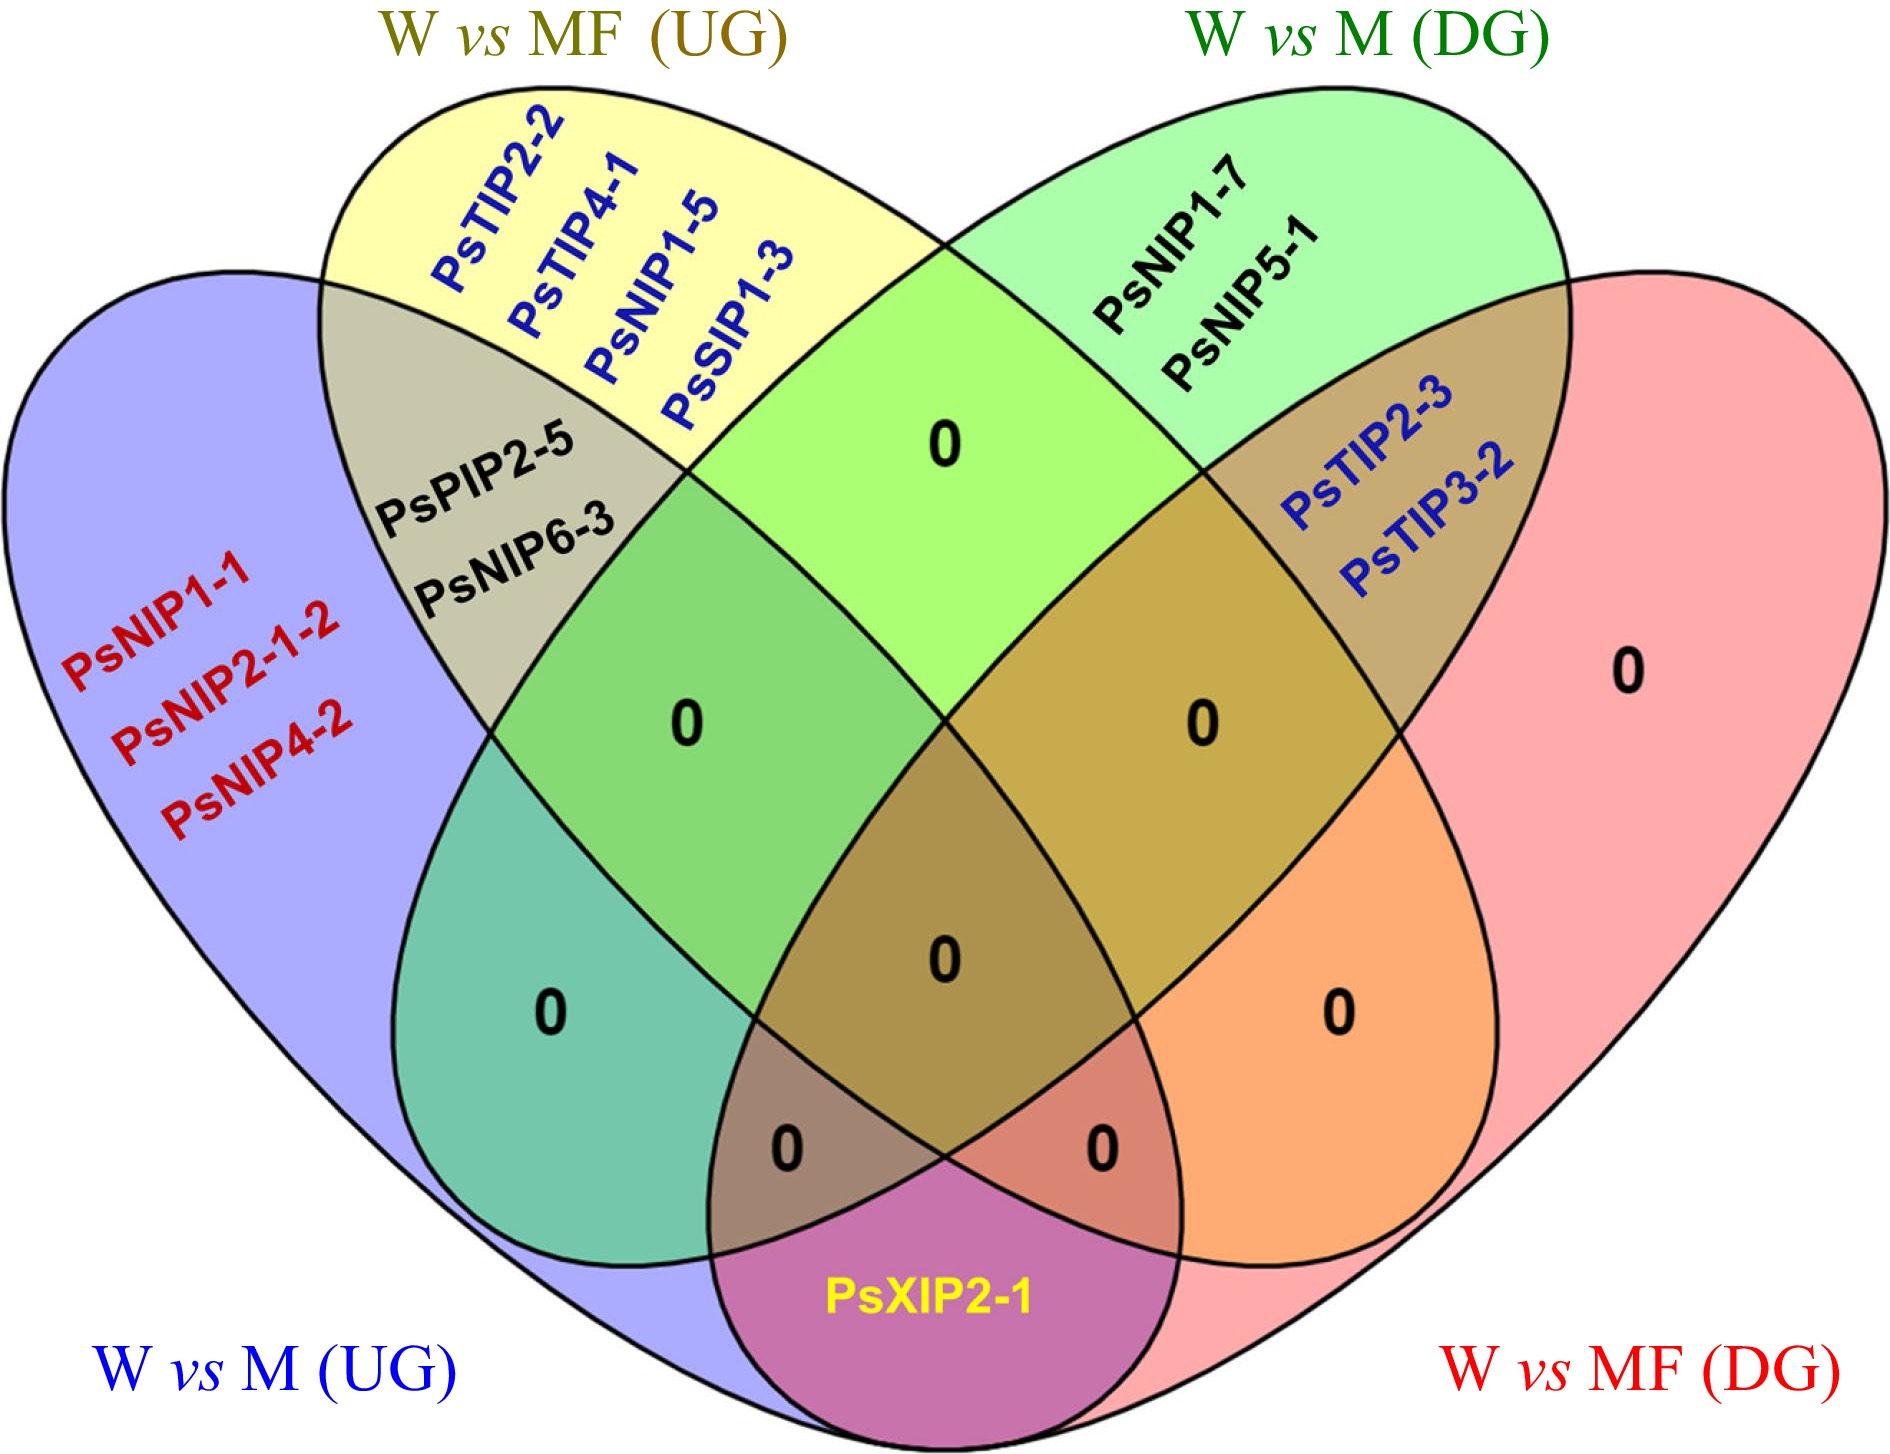
Figure 6.
Venn diagram showing the shared and unique differentially expressed PsAQP genes in imbibing seeds under control (W), Mannitol (M) and Mannitol + Fullerol (MF3) treatments. Up-regulation (UG): PsPIP2-5, PsNIP1-1, PsNIP2-1-2, PsNIP4-2, PsNIP6-3, PsNIP1-5, PsTIP2-2, PsTIP4-1, PsSIP1-3, PsXIP2-1; Down-regulation (DG): PsTIP2-3, PsTIP3-2, PsNIP1-7, PsNIP5-1, PsXIP2-1.
-
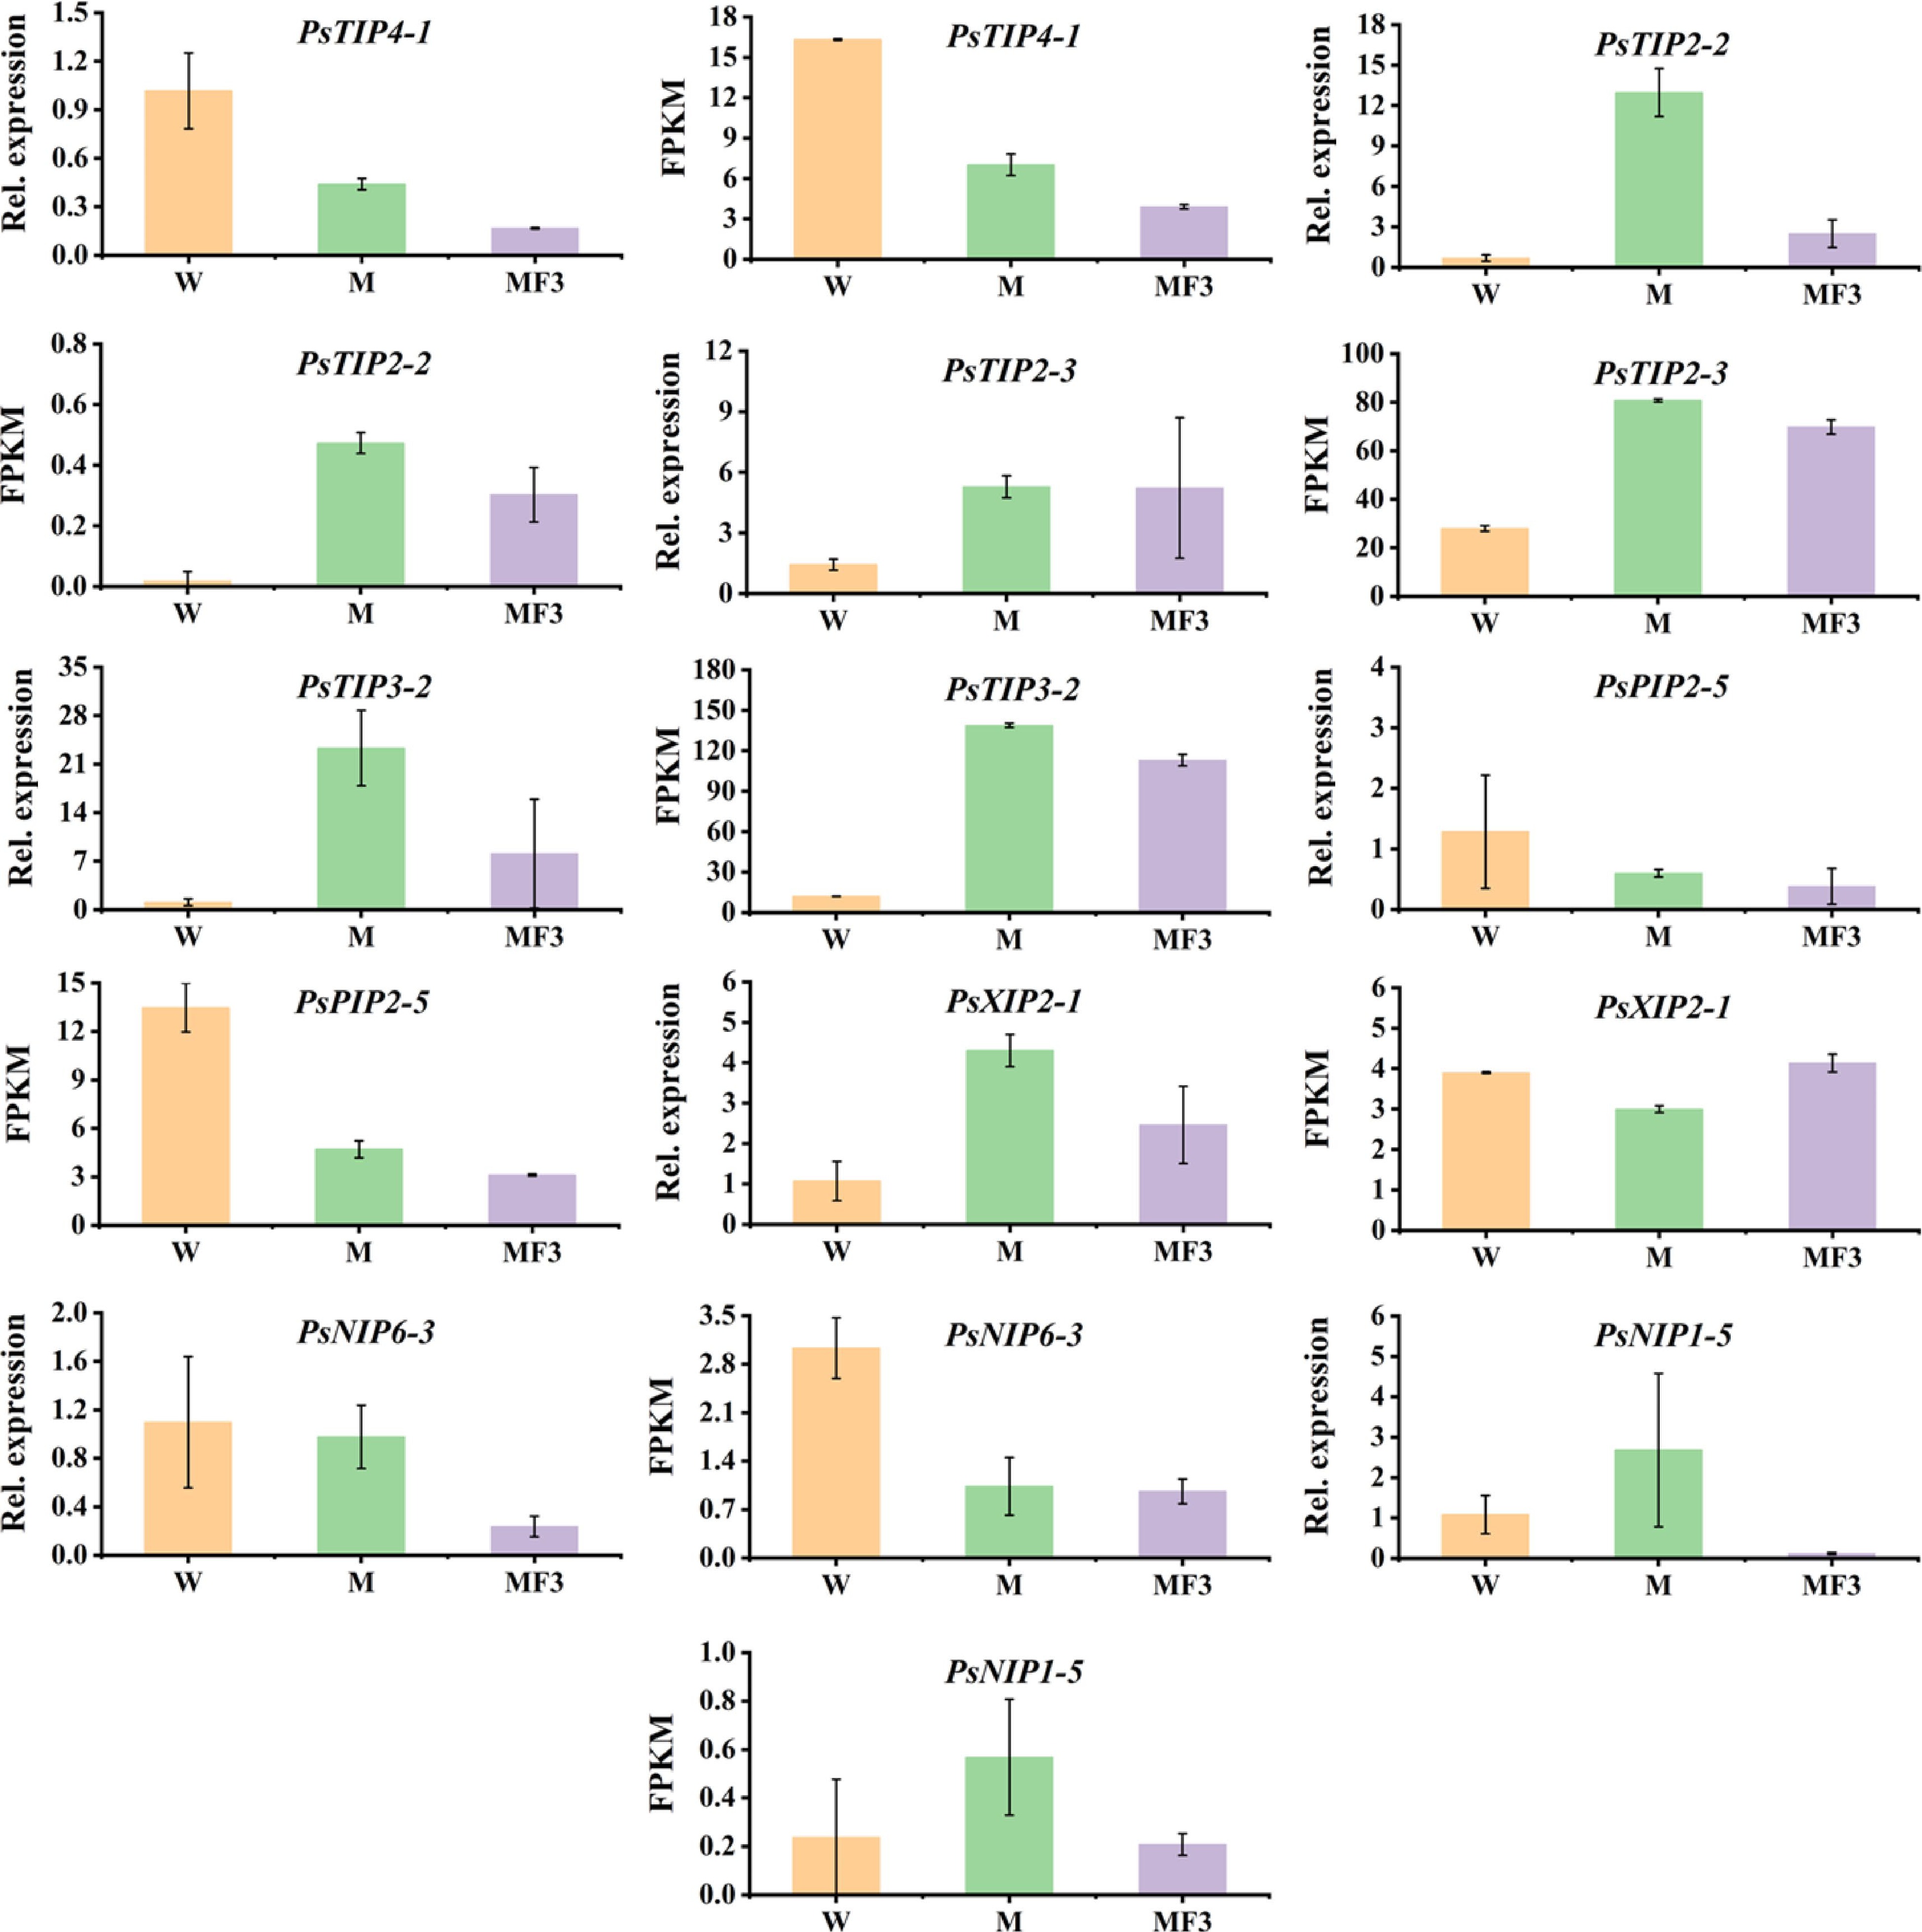
Figure 7.
The expression patterns of seven PsAQPs in imbibing seeds as revealed by RNA-Seq and qRT-PCR. The seeds were sampled after 12 h soaking in three different solutions, namely water (W), 0.3 M mannitol (M), and 100 mg/L fullerol dissolved in 0.3 M mannitol (MF3) solution. Error bars are standard errors calculated from three replicates.
-
Chromosome S. No Gene Name Gene ID Gene length
(bp)Location Start End Transcription length (bp) CDS length
(bp)Protein length
(aa)1 PsPIP1-1 Psat5g128840.3 2507 chr5LG3 231,127,859 231,130,365 675 675 225 2 PsPIP1-2 Psat2g034560.1 1963 chr2LG1 49,355,958 49,357,920 870 870 290 3 PsPIP1-4 Psat2g182480.1 1211 chr2LG1 421,647,518 421,648,728 864 864 288 4 PsPIP2-1 Psat6g183960.1 3314 chr6LG2 369,699,084 369,702,397 864 864 288 5 PsPIP2-2-1 Psat4g051960.1 1223 chr4LG4 86,037,446 86,038,668 585 585 195 6 PsPIP2-2-2 Psat5g279360.2 2556 chr5LG3 543,477,849 543,480,404 2555 789 263 7 PsPIP2-3 Psat7g228600.2 2331 chr7LG7 458,647,213 458,649,543 2330 672 224 8 PsPIP2-4 Psat3g045080.1 1786 chr3LG5 100,017,377 100,019,162 864 864 288 9 PsPIP2-5 Psat0s3550g0040.1 1709 scaffold03550 20,929 22,637 1191 1191 397 10 PsTIP1-1 Psat3g040640.1 2021 chr3LG5 89,426,473 89,428,493 753 753 251 11 PsTIP1-3 Psat3g184440.1 2003 chr3LG5 393,920,756 393,922,758 759 759 253 12 PsTIP1-4 Psat7g219600.1 2083 chr7LG7 441,691,937 441,694,019 759 759 253 13 PsTIP1-7 Psat6g236600.1 1880 chr6LG2 471,659,417 471,661,296 762 762 254 14 PsTIP2-1 Psat1g005320.1 1598 chr1LG6 7,864,810 7,866,407 750 750 250 15 PsTIP2-2 Psat4g198360.1 1868 chr4LG4 407,970,525 407,972,392 750 750 250 16 PsTIP2-3 Psat1g118120.1 2665 chr1LG6 230,725,833 230,728,497 768 768 256 17 PsTIP2-6 Psat2g177040.1 1658 chr2LG1 416,640,482 416,642,139 750 750 250 18 PsTIP3-2 Psat6g054400.1 1332 chr6LG2 54,878,003 54,879,334 780 780 260 19 PsTIP4-1 Psat6g037720.2 1689 chr6LG2 30,753,624 30,755,312 1688 624 208 20 PsTIP5-1 Psat7g157600.1 1695 chr7LG7 299,716,873 299,718,567 762 762 254 21 PsNIP1-1 Psat1g195040.2 1864 chr1LG6 346,593,853 346,595,716 1863 645 215 22 PsNIP1-3 Psat1g195800.1 1200 chr1LG6 347,120,121 347,121,335 819 819 273 23 PsNIP1-5 Psat7g067480.1 2365 chr7LG7 109,420,633 109,422,997 828 828 276 24 PsNIP1-6 Psat7g067360.1 2250 chr7LG7 109,270,462 109,272,711 813 813 271 25 PsNIP1-7 Psat1g193240.1 1452 chr1LG6 344,622,606 344,624,057 831 831 277 26 PsNIP2-1-2 Psat3g197520.1 669 chr3LG5 420,092,382 420,093,050 345 345 115 27 PsNIP2-2-2 Psat3g197560.1 716 chr3LG5 420,103,168 420,103,883 486 486 162 28 PsNIP3-1 Psat2g072000.1 1414 chr2LG1 133,902,470 133,903,883 798 798 266 29 PsNIP4-1 Psat7g126440.1 1849 chr7LG7 209,087,362 209,089,210 828 828 276 30 PsNIP4-2 Psat5g230920.1 1436 chr5LG3 463,340,575 463,342,010 825 825 275 31 PsNIP5-1 Psat6g190560.1 1563 chr6LG2 383,057,323 383,058,885 867 867 289 32 PsNIP6-1 Psat5g304760.4 5093 chr5LG3 573,714,868 573,719,960 5092 486 162 33 PsNIP6-2 Psat7g036680.1 2186 chr7LG7 61,445,341 61,447,134 762 762 254 34 PsNIP6-3 Psat7g259640.1 2339 chr7LG7 488,047,315 488,049,653 918 918 306 35 PsNIP7-1 Psat6g134160.2 4050 chr6LG2 260,615,019 260,619,068 4049 1509 503 36 PsSIP1-1 Psat3g091120.1 3513 chr3LG5 187,012,329 187,015,841 738 738 246 37 PsSIP1-2 Psat1g096840.1 3609 chr1LG6 167,126,599 167,130,207 744 744 248 38 PsSIP1-3 Psat7g203280.1 2069 chr7LG7 401,302,247 401,304,315 720 720 240 39 PsSIP2-1-1 Psat0s2987g0040.1 706 scaffold02987 177,538 178,243 621 621 207 40 PsSIP2-1-2 Psat3g082760.1 3135 chr3LG5 173,720,100 173,723,234 720 720 240 41 PsXIP2-1 Psat7g178080.1 2077 chr7LG7 335,167,251 335,169,327 942 942 314 bp: base pair, aa: amino acid. Table 1.
Description and distribution of aquaporin genes identified in the garden pea genome.
-
S. No AQPs Gene Length TMH NPA NPA ar/R selectivity filter pI WoLF PSORT Plant-mPLoc LB LE H2 H5 LE1 LE2 Plasma membrane intrinsic proteins (PIPs) 1 PsPIP1-1 Psat5g128840.3 225 4 NPA 0 F 0 0 0 8.11 Plas Plas 2 PsPIP1-2 Psat2g034560.1 290 2 NPA NPA F H T R 9.31 Plas Plas 3 PsPIP1-4 Psat2g182480.1 288 6 NPA NPA F H T R 9.29 Plas Plas 4 PsPIP2-1 Psat6g183960.1 288 6 NPA NPA F H T 0 8.74 Plas Plas 5 PsPIP2-2-1 Psat4g051960.1 195 3 0 0 F H T R 8.88 Plas Plas 6 PsPIP2-2-2 Psat5g279360.2 263 5 NPA NPA F H T R 5.71 Plas Plas 7 PsPIP2-3 Psat7g228600.2 224 4 NPA 0 F F 0 0 6.92 Plas Plas 8 PsPIP2-4 Psat3g045080.1 288 6 NPA NPA F H T R 8.29 Plas Plas Tonoplast intrinsic proteins (TIPs) 1 PsTIP1-1 Psat3g040640.1 251 7 NPA NPA H I A V 6.34 Plas Vacu 2 PsTIP1-3 Psat3g184440.1 253 6 NPA NPA H I A V 5.02 Plas/Vacu Vacu 3 PsTIP1-4 Psat7g219600.1 253 7 NPA NPA H I A V 4.72 Vacu Vacu 4 PsTIP1-7 Psat6g236600.1 254 6 NPA NPA H I A V 5.48 Plas/Vacu Vacu 5 PsTIP2-1 Psat1g005320.1 250 6 NPA NPA H I G R 8.08 Vacu Vacu 6 PsTIP2-2 Psat4g198360.1 250 6 NPA NPA H I G R 5.94 Plas/Vacu Vacu 7 PsTIP2-3 Psat1g118120.1 256 6 NPA NPA H I A L 6.86 Plas/Vacu Vacu 8 PsTIP2-6 Psat2g177040.1 250 6 NPA NPA H I G R 4.93 Vacu Vacu 9 PsTIP3-2 Psat6g054400.1 260 6 NPA NPA H I A R 7.27 Plas/Vacu Vacu 10 PsTIP4-1 Psat6g037720.2 208 6 NPA NPA H I A R 6.29 Vac/ plas Vacu 11 PsTIP5-1 Psat7g157600.1 254 7 NPA NPA N V G C 8.2 Vacu /plas Vacu/Plas Nodulin-26 like intrisic proteins (NIPs) 1 PsNIP1-1 Psat1g195040.2 215 5 NPA 0 W V F 0 6.71 Plas Plas 2 PsNIP1-3 Psat1g195800.1 273 5 NPA NPV W V A R 6.77 Plas Plas 3 PsNIP1-5 Psat7g067480.1 276 6 NPA NPV W V A N 8.98 Plas Plas 4 PsNIP1-6 Psat7g067360.1 271 6 NPA NPA W V A R 8.65 Plas/Vacu Plas 5 PsNIP1-7 Psat1g193240.1 277 6 NPA NPA W I A R 6.5 Plas/Vacu Plas 6 PsNIP2-1-2 Psat3g197520.1 115 2 NPA O G 0 0 0 9.64 Plas Plas 7 PsNIP2-2-2 Psat3g197560.1 162 3 0 NPA 0 S G R 6.51 Plas Plas 8 PsNIP3-1 Psat2g072000.1 266 5 NPA NPA S I A R 8.59 Plas/Vacu Plas 9 PsNIP4-1 Psat7g126440.1 276 6 NPA NPA W V A R 6.67 Plas Plas 10 PsNIP4-2 Psat5g230920.1 275 6 NPA NPA W L A R 7.01 Plas Plas 11 PsNIP5-1 Psat6g190560.1 289 5 NPS NPV A I G R 7.1 Plas Plas 12 PsNIP6-1 Psat5g304760.4 162 2 NPA 0 I 0 0 0 9.03 Plas Plas 13 PsNIP6-2 Psat7g036680.1 254 0 0 0 G 0 0 0 5.27 Chlo Plas/Nucl 14 PsNIP6-3 Psat7g259640.1 306 6 NPA NPV T I G R 8.32 Plas Plas 15 PsNIP7-1 Psat6g134160.2 503 0 NLK 0 W G Q R 8.5 Vacu Chlo/Nucl Small basic intrinsic proteins (SIPs) 1 PsSIP1-1 Psat3g091120.1 246 6 NPT NPA V L P N 9.54 Plas Plas/Vacu 2 PsSIP1-2 Psat1g096840.1 248 5 NTP NPA I V P L 9.24 Vacu Plas/Vacu 3 PsSIP1-3 Psat7g203280.1 240 6 NPS NPA N L P N 10.32 Chlo Plas 4 PsSIP2-1-2 Psat3g082760.1 240 4 NPL NPA Y L G S 10.28 Plas Plas Uncharacterized X intrinsic proteins (XIPs) 1 PsXIP2-1 Psat7g178080.1 314 6 SPV NPA V V R M 7.89 Plas Plas Length: protein length (aa); pI: Isoelectric point; Trans-membrane helicase (TMH) represents for the numbers of Trans-membrane helices predicted by TMHMM Server v.2.0 tool; WoLF PSORT and Plant-mPLoc: best possible cellualr localization predicted by the WoLF PSORT and Plant-mPLoc tool, respectively (Chlo Chloroplast, Plas Plasma membrane, Vacu Vacuolar membrane, Nucl Nucleus); LB: Loop B, L: Loop E; NPA: Asparagine-Proline-Alanine; H2 represents for Helix 2, H5 represents for Helix 5, LE1 represents for Loop E1, LE2 represents for Loop E2, Ar/R represents for Aromatic/Arginine. Table 2.
Protein information, conserved amino acid residues, trans-membrane domains, selectivity filter, and predicted subcellular localization of the 39 full-length pea aquaporins.
Figures
(7)
Tables
(2)