-
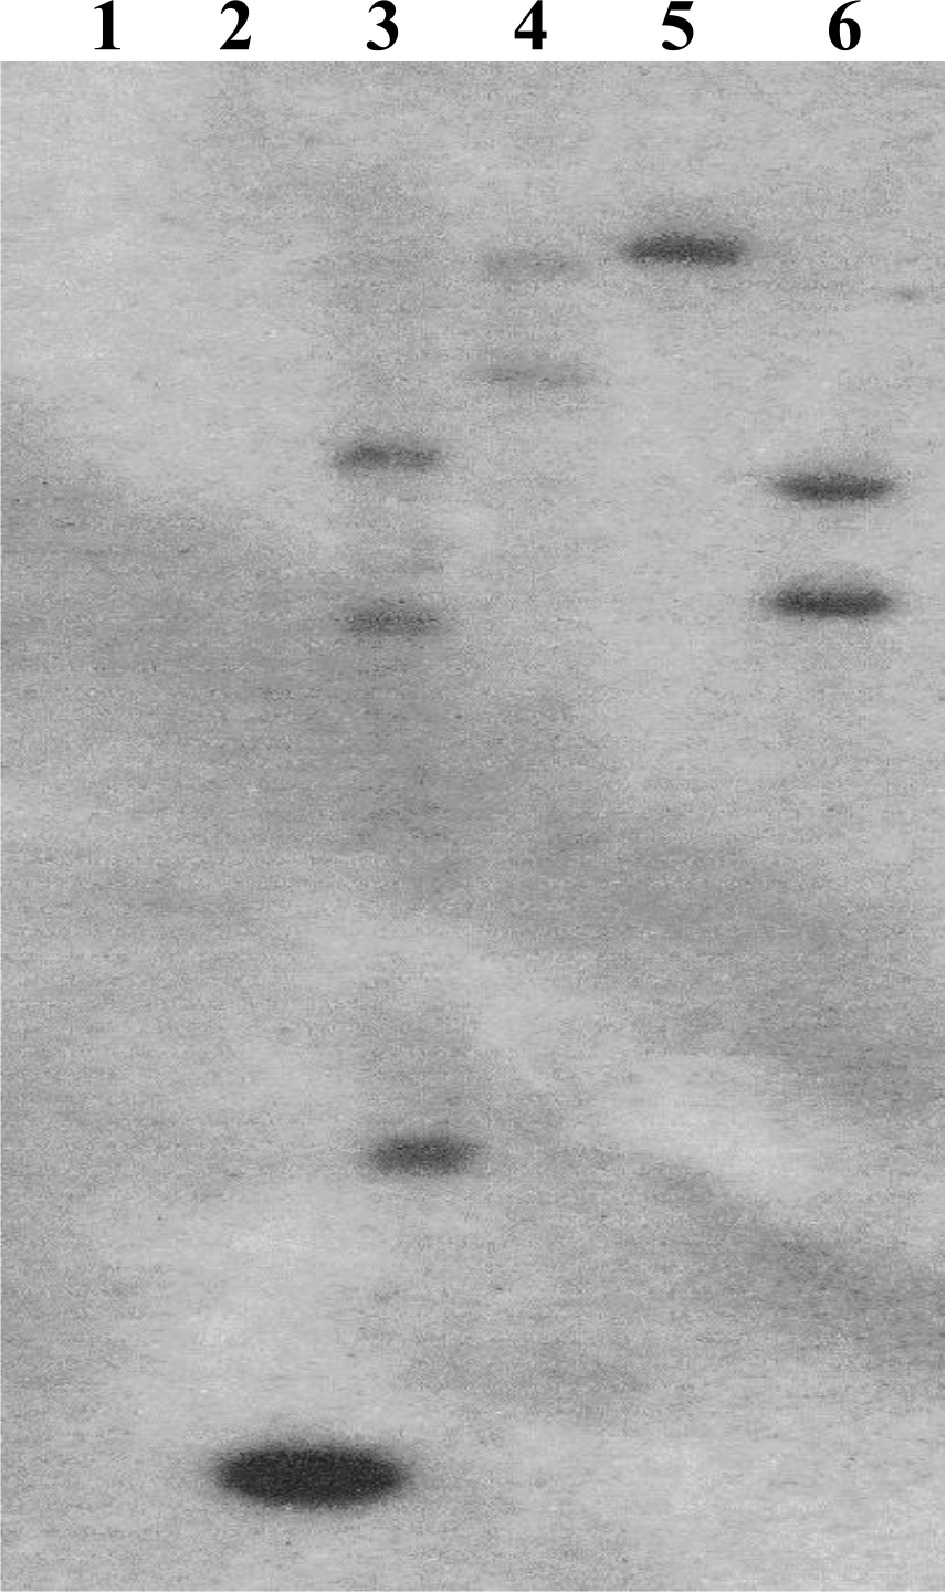
Figure 1.
Southern blot confirmation of transgene insertion. A portion of the hygromycin selection gene was used as a probe. (1) HR8 negative control, (2) 1 kb positive standard, (3) SHN4-1, (4) SHN5-2, (5) SHN6-3, (6) SHN7-2.
-
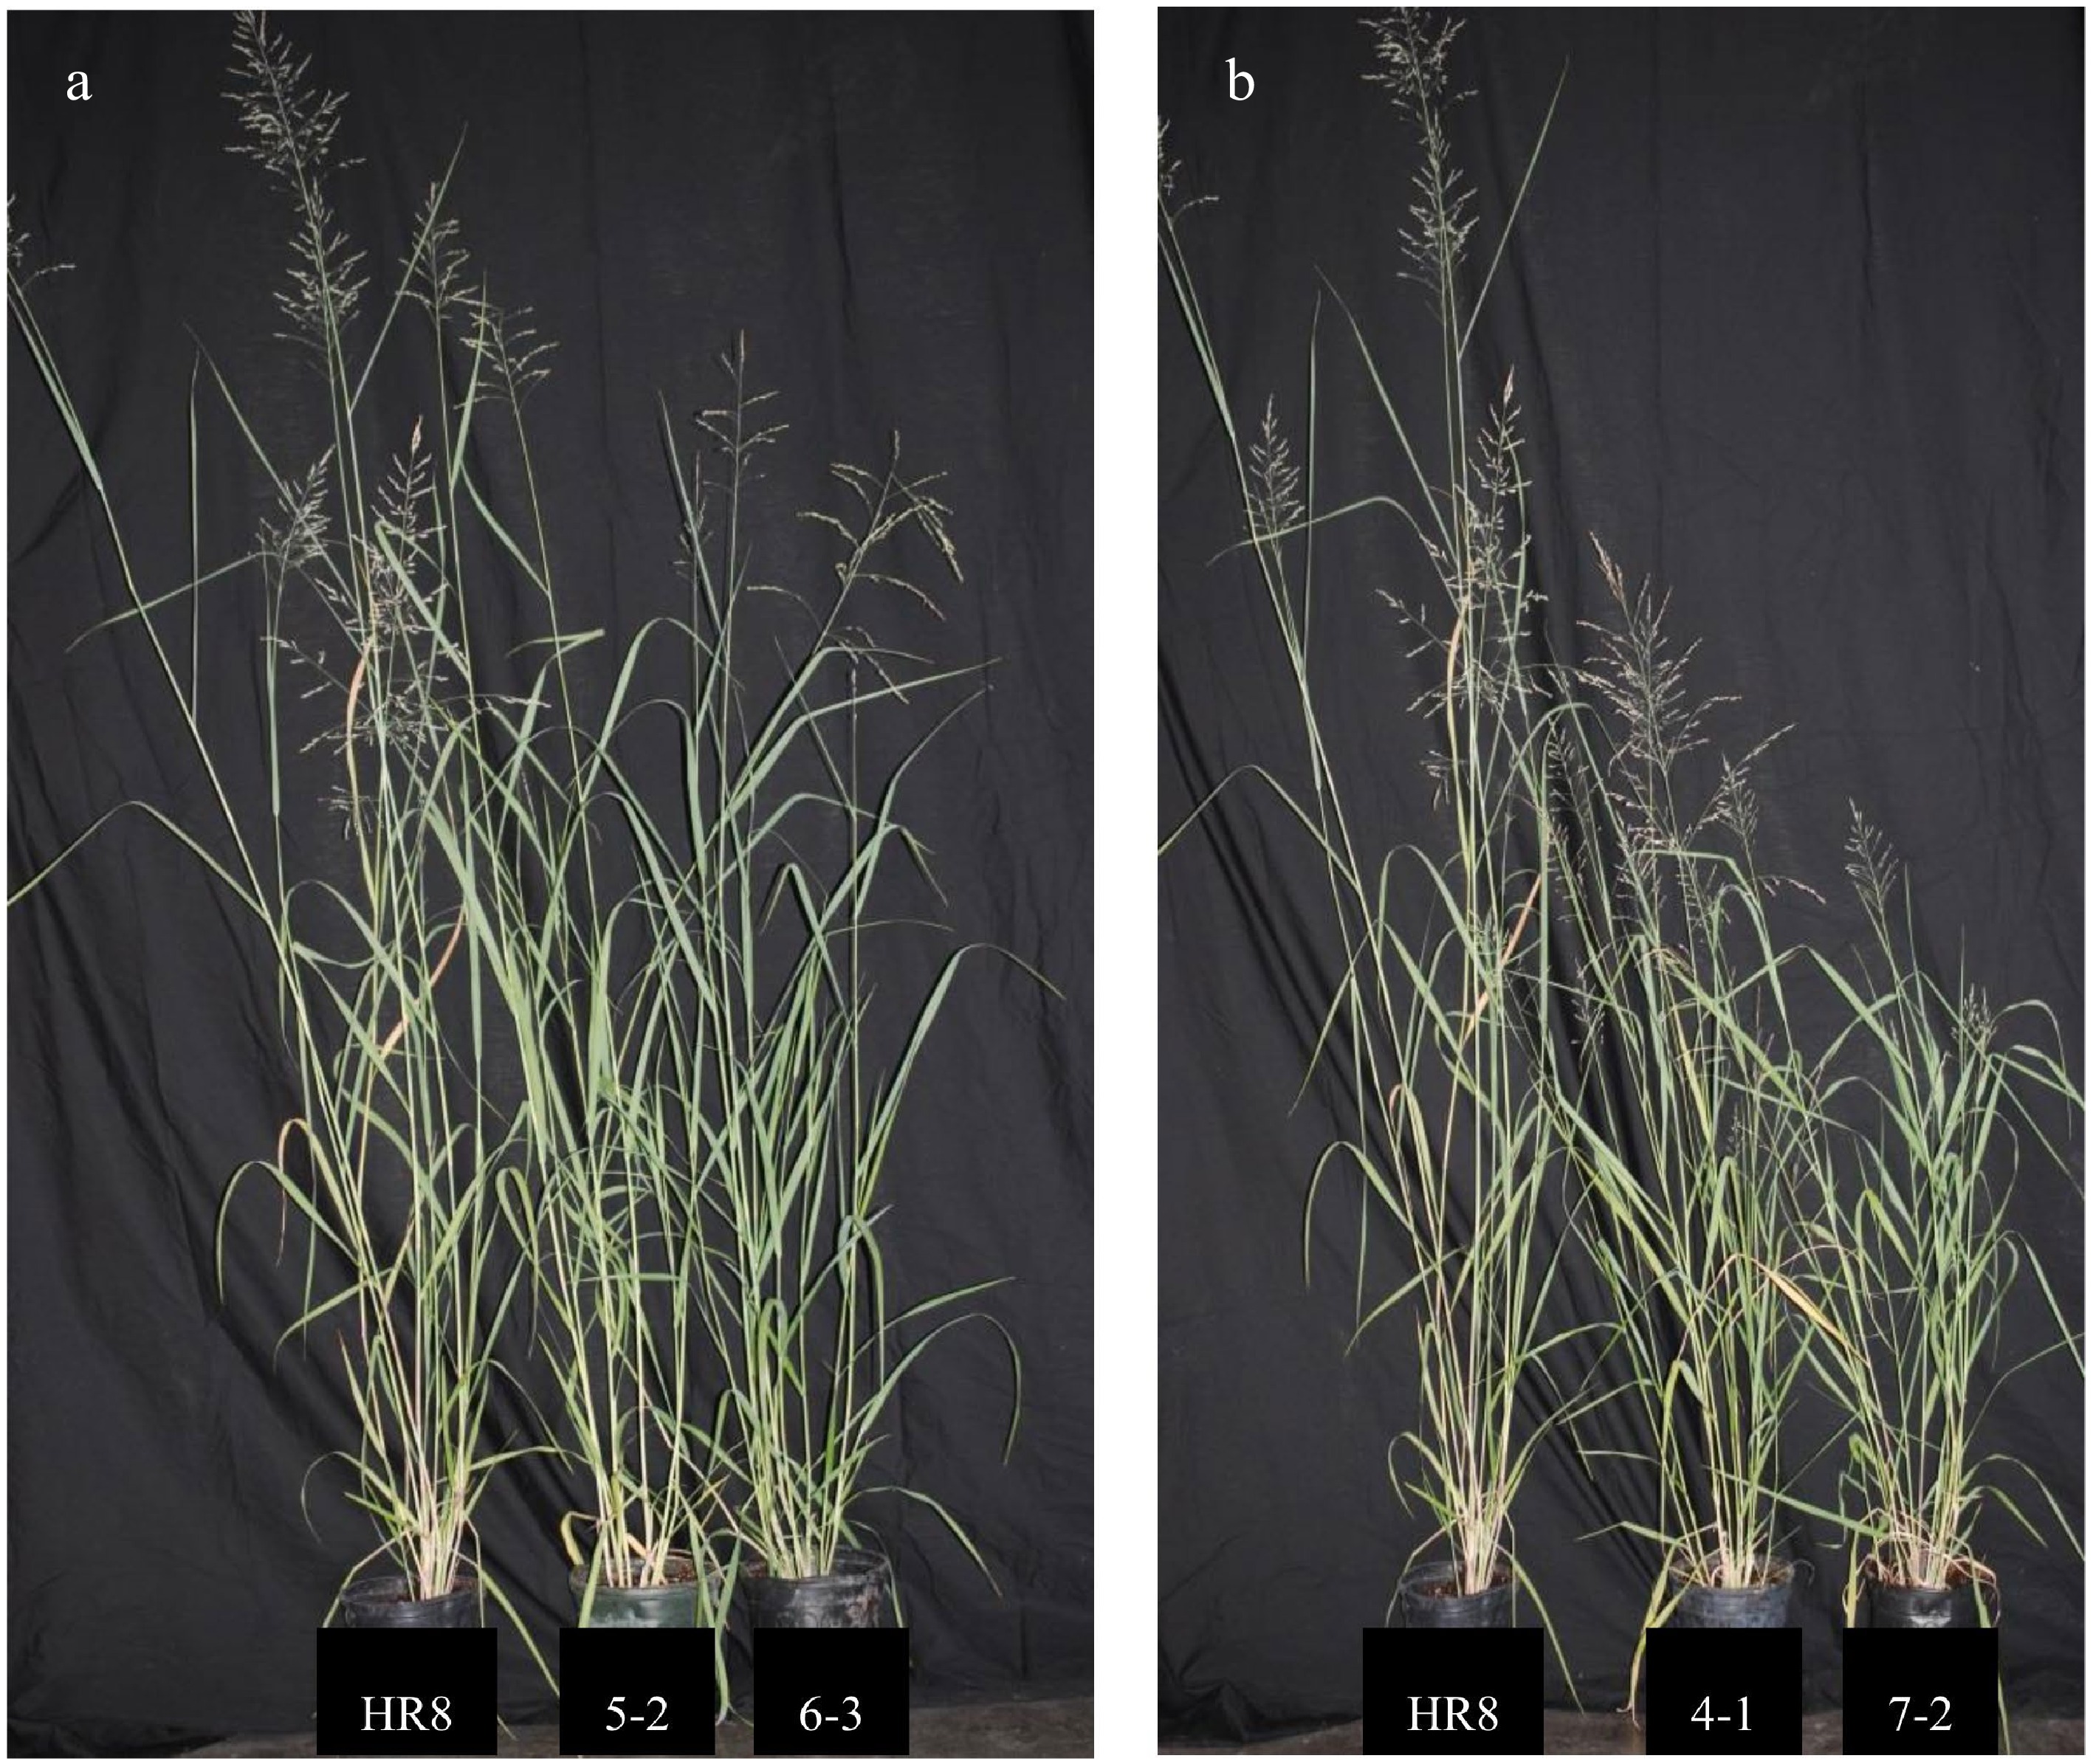
Figure 2.
AtSHN3-overexpressing transgenic switchgrass lines are smaller than wild-type plants. (a) HR8 control plant (left) in comparison to SHN 5-2 (middle) and SHN 6-3 (right). (b) HR8 control plant (left) in comparison to SHN 4-1 (middle) and SHN 7-2 (right).
-
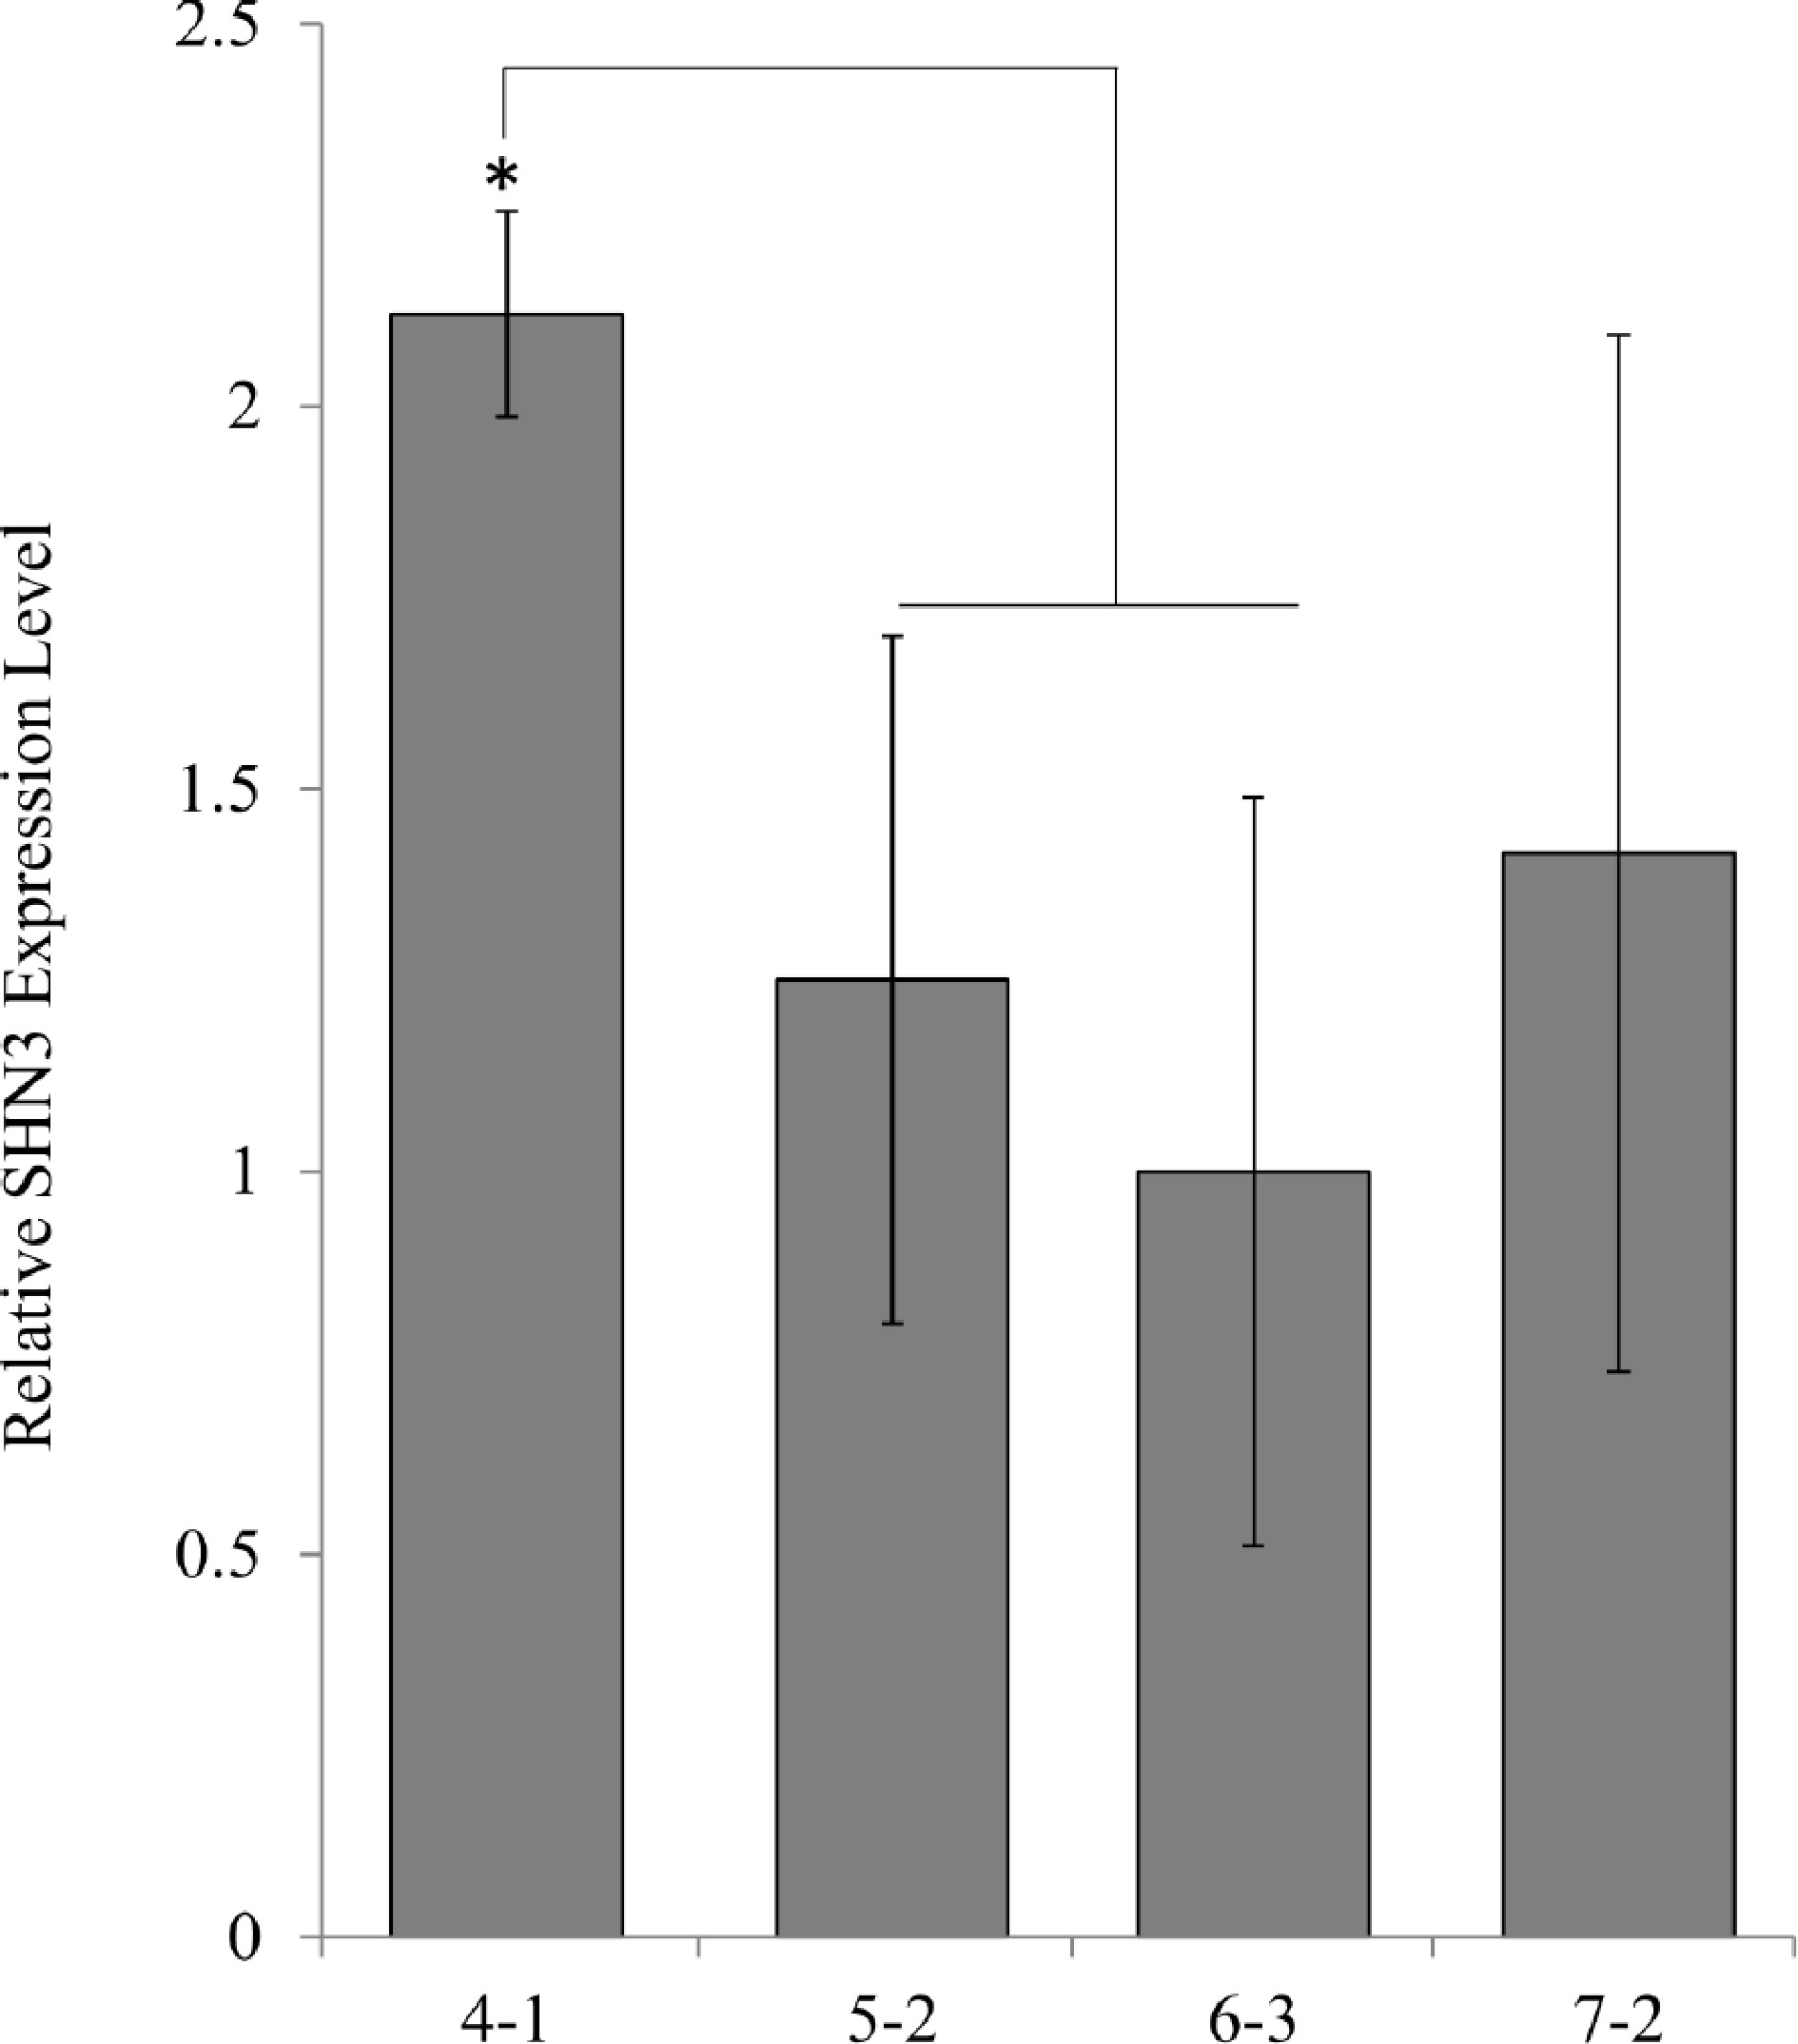
Figure 3.
qPCR analysis of transgene expression levels in AtSHN3 transgenic plants. Expression levels were normalized to the values obtained for SHN3 6-3, which contains one transgene insertion. N = 3, the error bars are standard deviations.
-
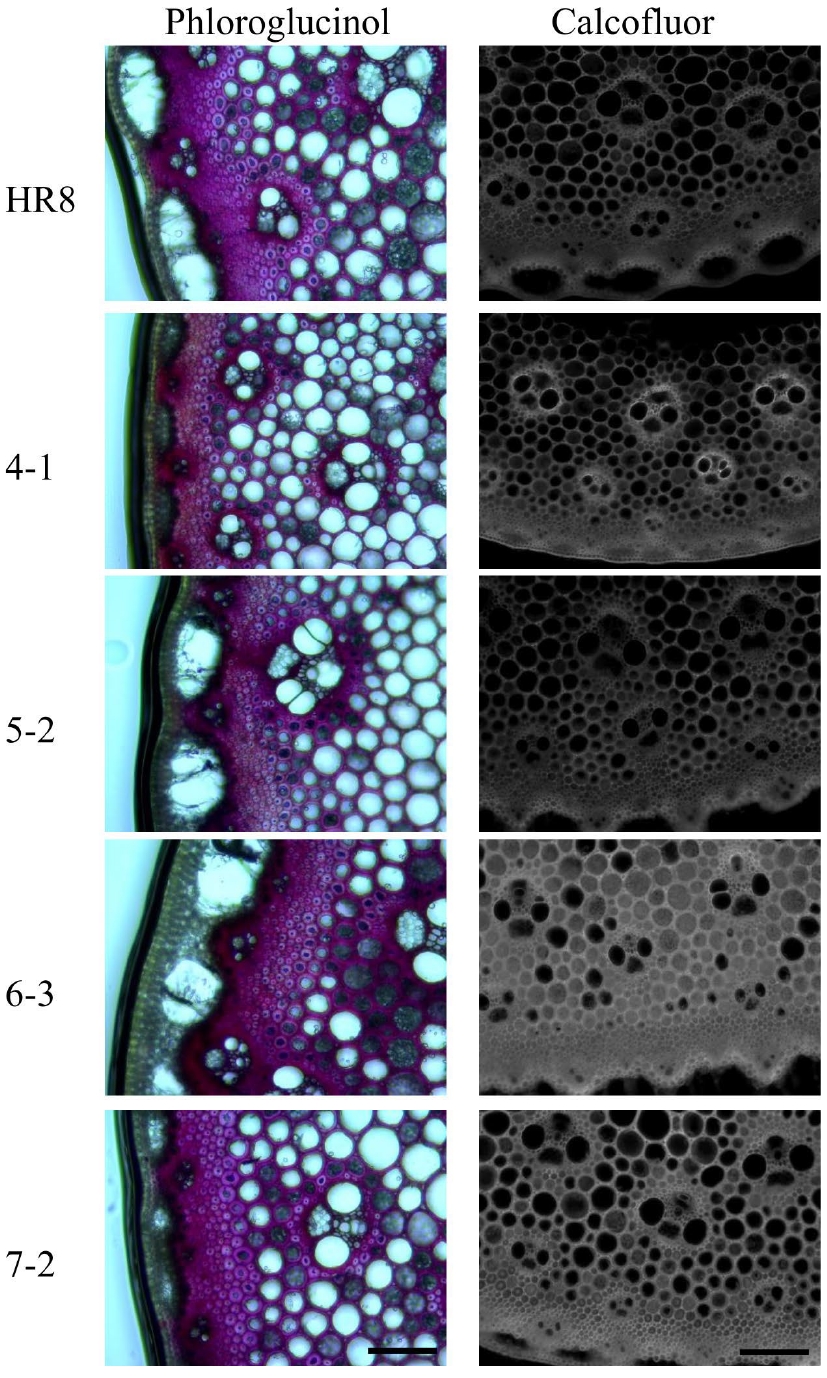
Figure 4.
Phloroglucinol and calcofluor staining of I2 stem sections of wild-type and AtSHN3 transgenics. The tiller segment sections of wild-type and AtSHN3 transgenics were stained with either Phloroglucinol or calcofluor white, and observed under a microscope. Lignin stained with Phloroglucinol is in cherry pink color and the cellulose stained with calcofluor white is showing fluorescence under UV light. All experiments were performed at least twice with similar results.
-
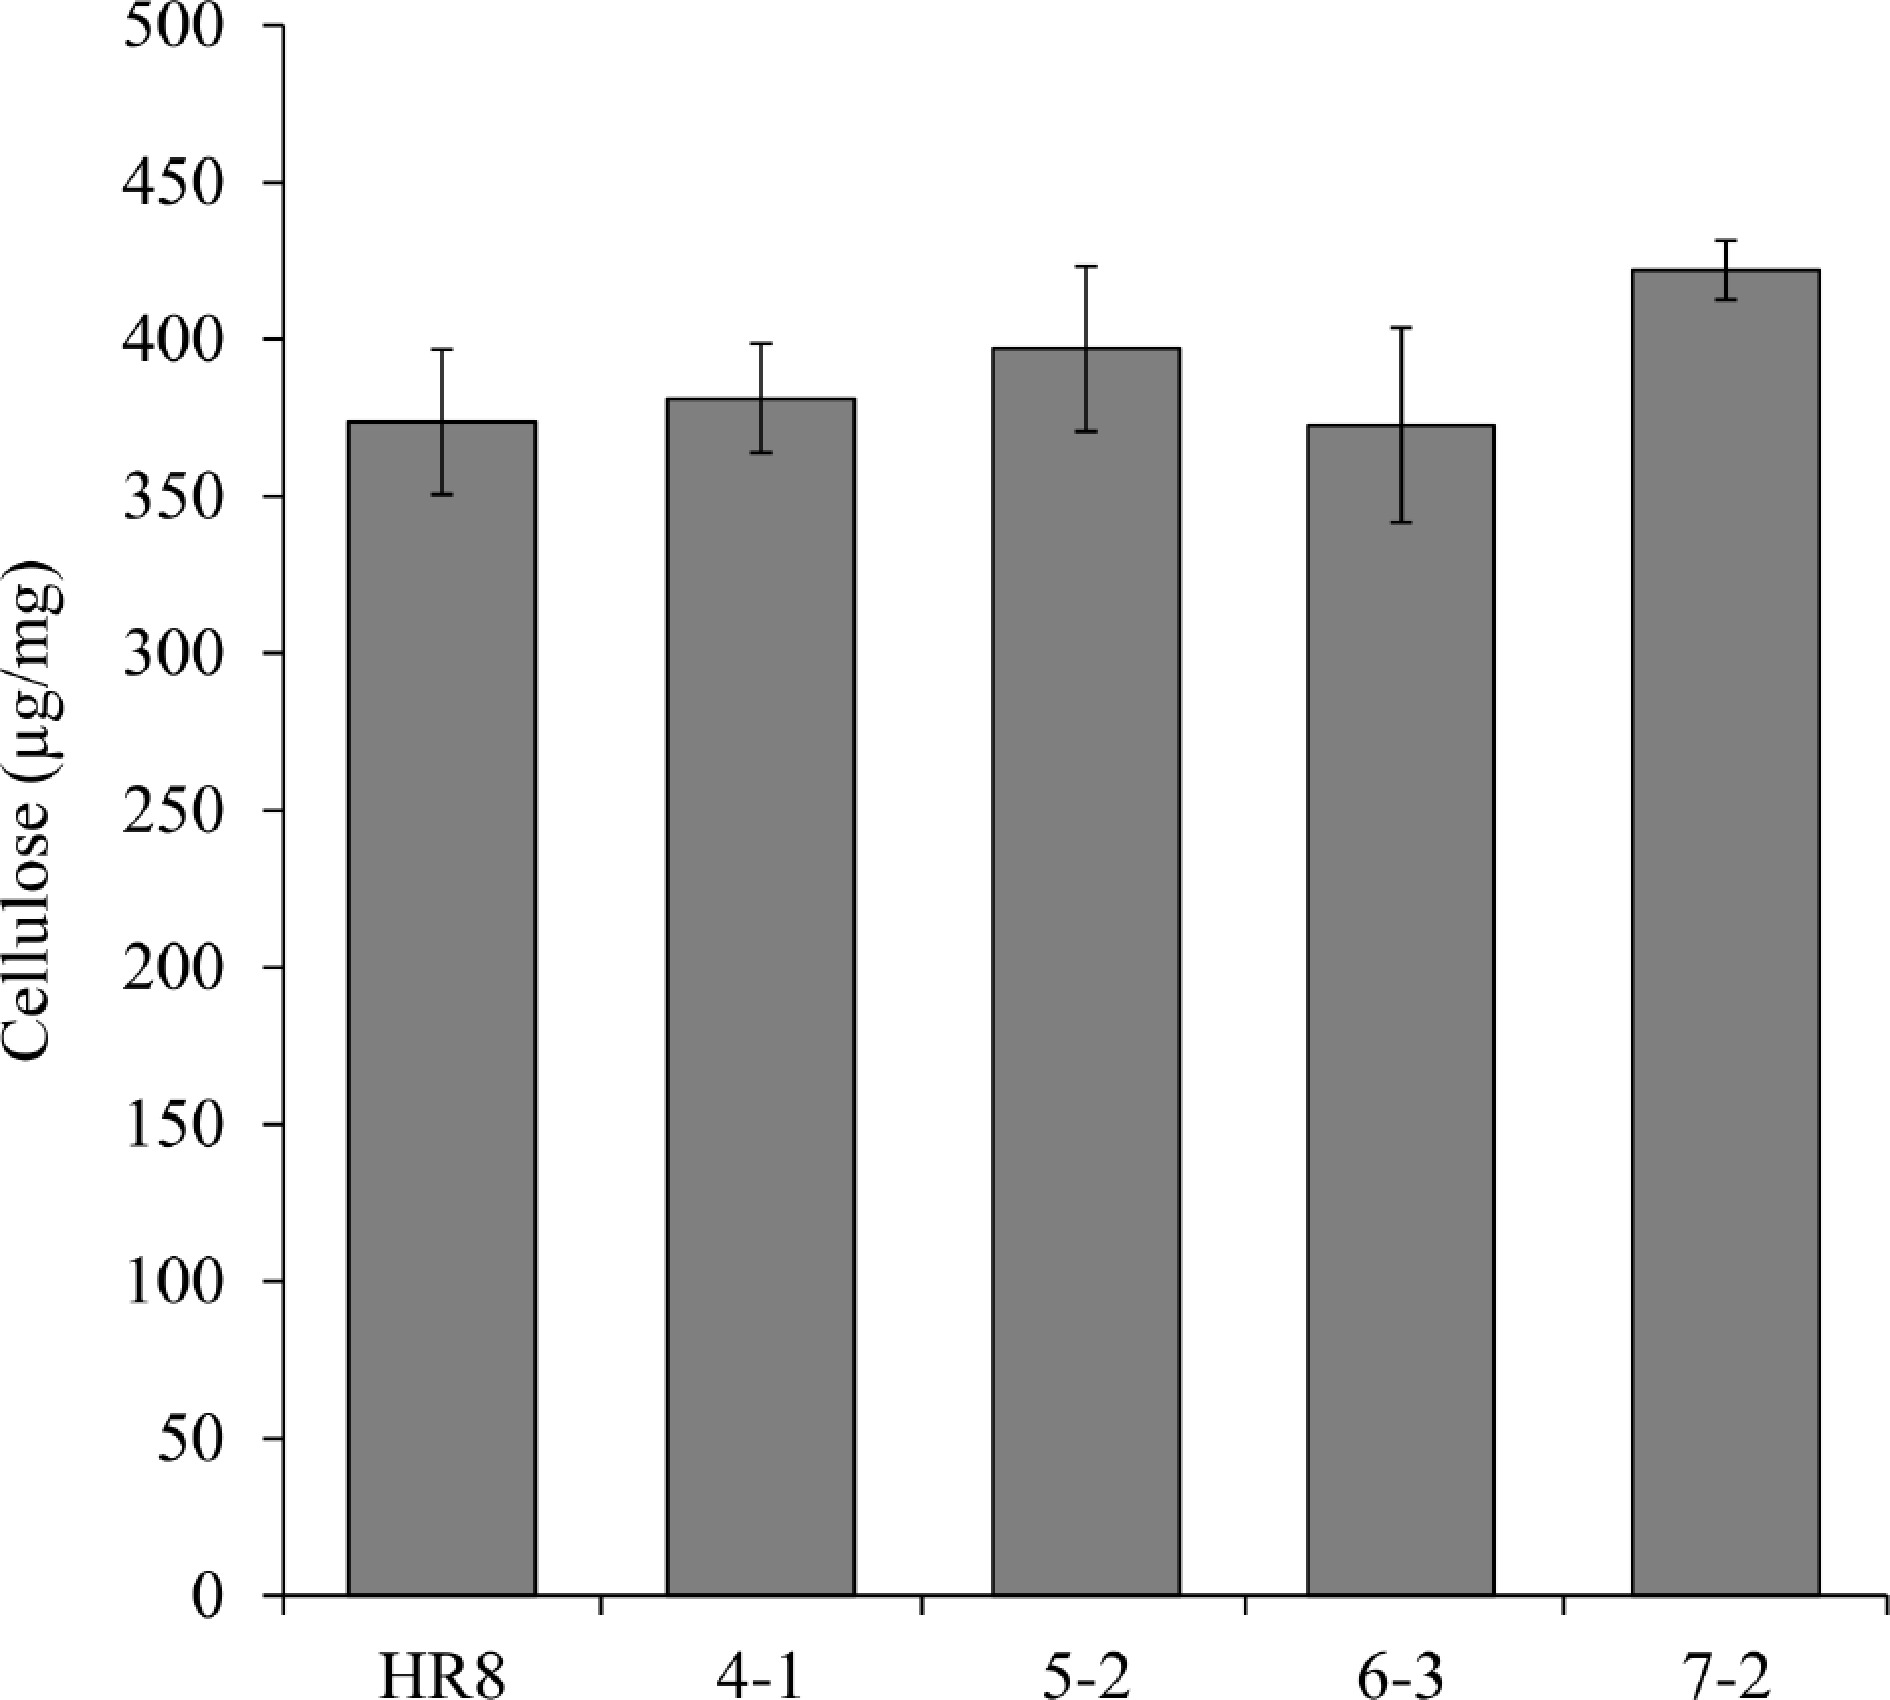
Figure 5.
Measurement of cellulose content between AtSHN3-overexpressing transgenic switchgrass and HR8 wild-type. The cellulose content of the transgenic plants was not statistically different from the wild-type (p < 0.01). N = 3, the error bars are standard deviation.
-
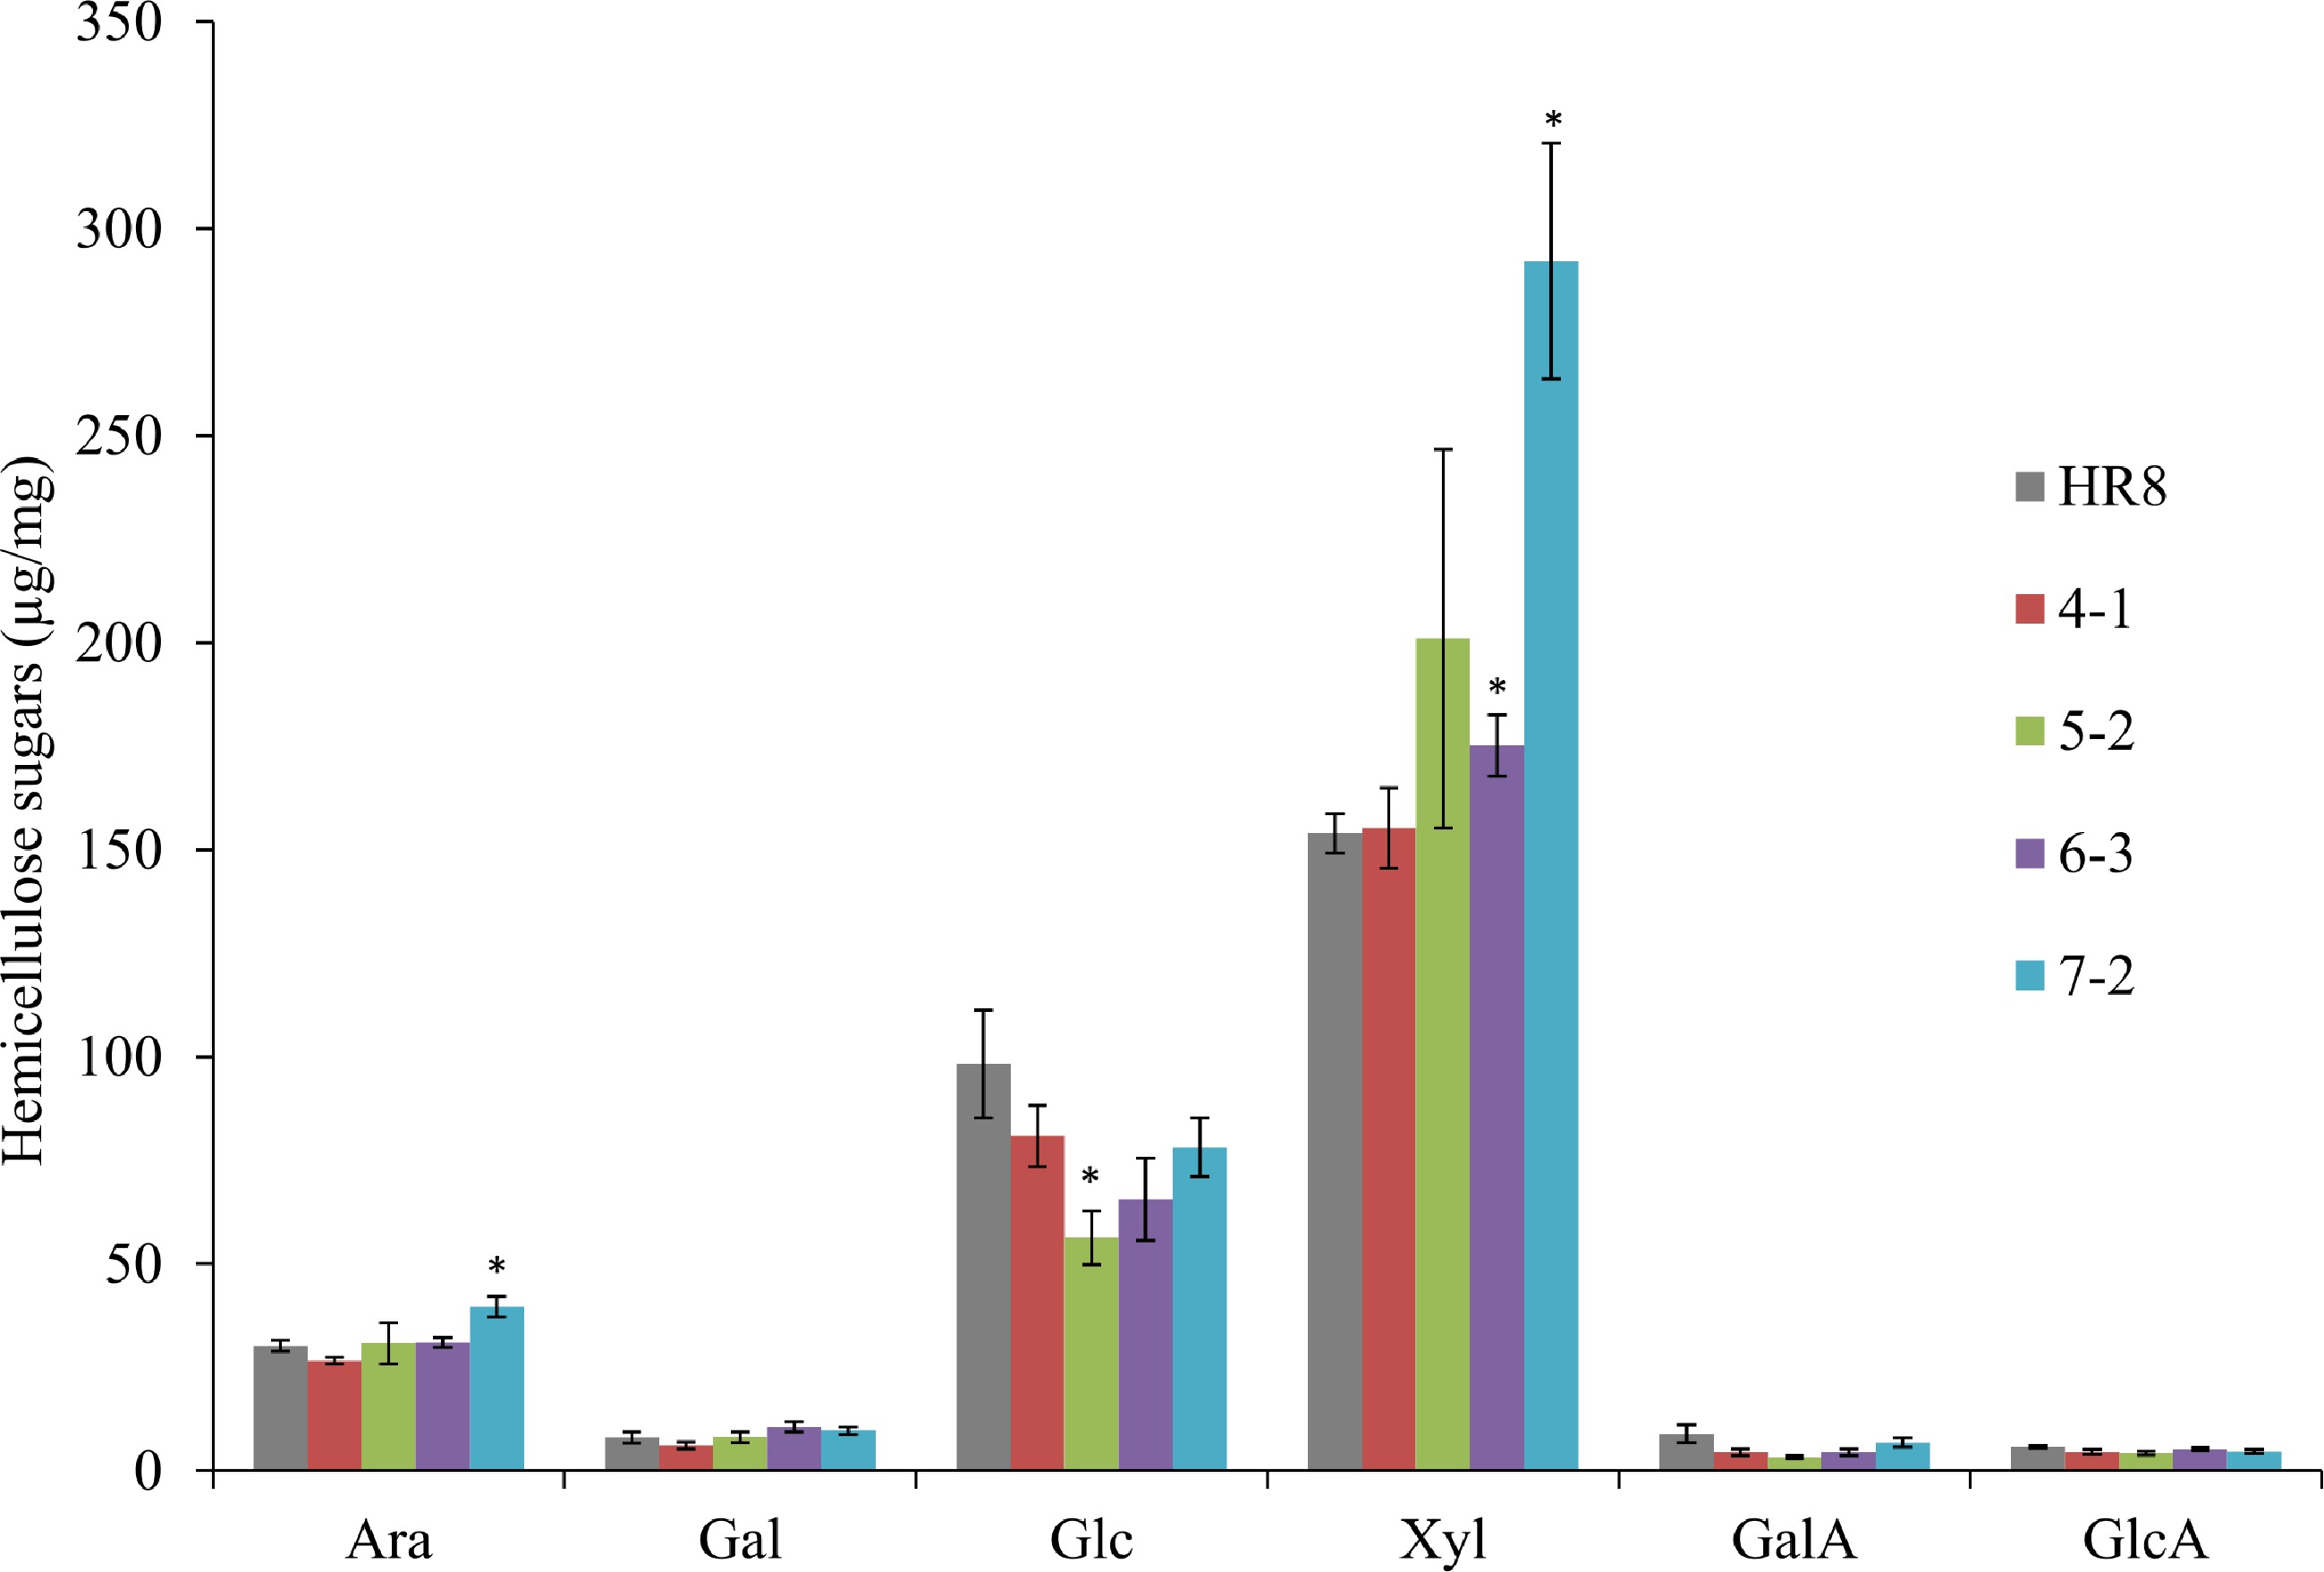
Figure 6.
Matrix polysaccharide sugars in AtSHN3-overexpressing transgenic switchgrass and HR8 wild-type. SHN7-2 transgenic plants were found to have 31% more arabinose and 90% more xylose than HR8 control plants (p < 0.01). SHN5-2 transgenic plants were found to have 43% less glucose than the wild-type HR8 plants (p < 0.01). N = 3, the error bars are standard deviations. The asterisks are the indicators of significant differences between wild-type and transgenics. Arabinose (Ara), Galactose (Gal), Glucose (Glc), Xylose (Xyl), Galacturonic acid (GalA) and Glucuronic acid (GlcA).
-
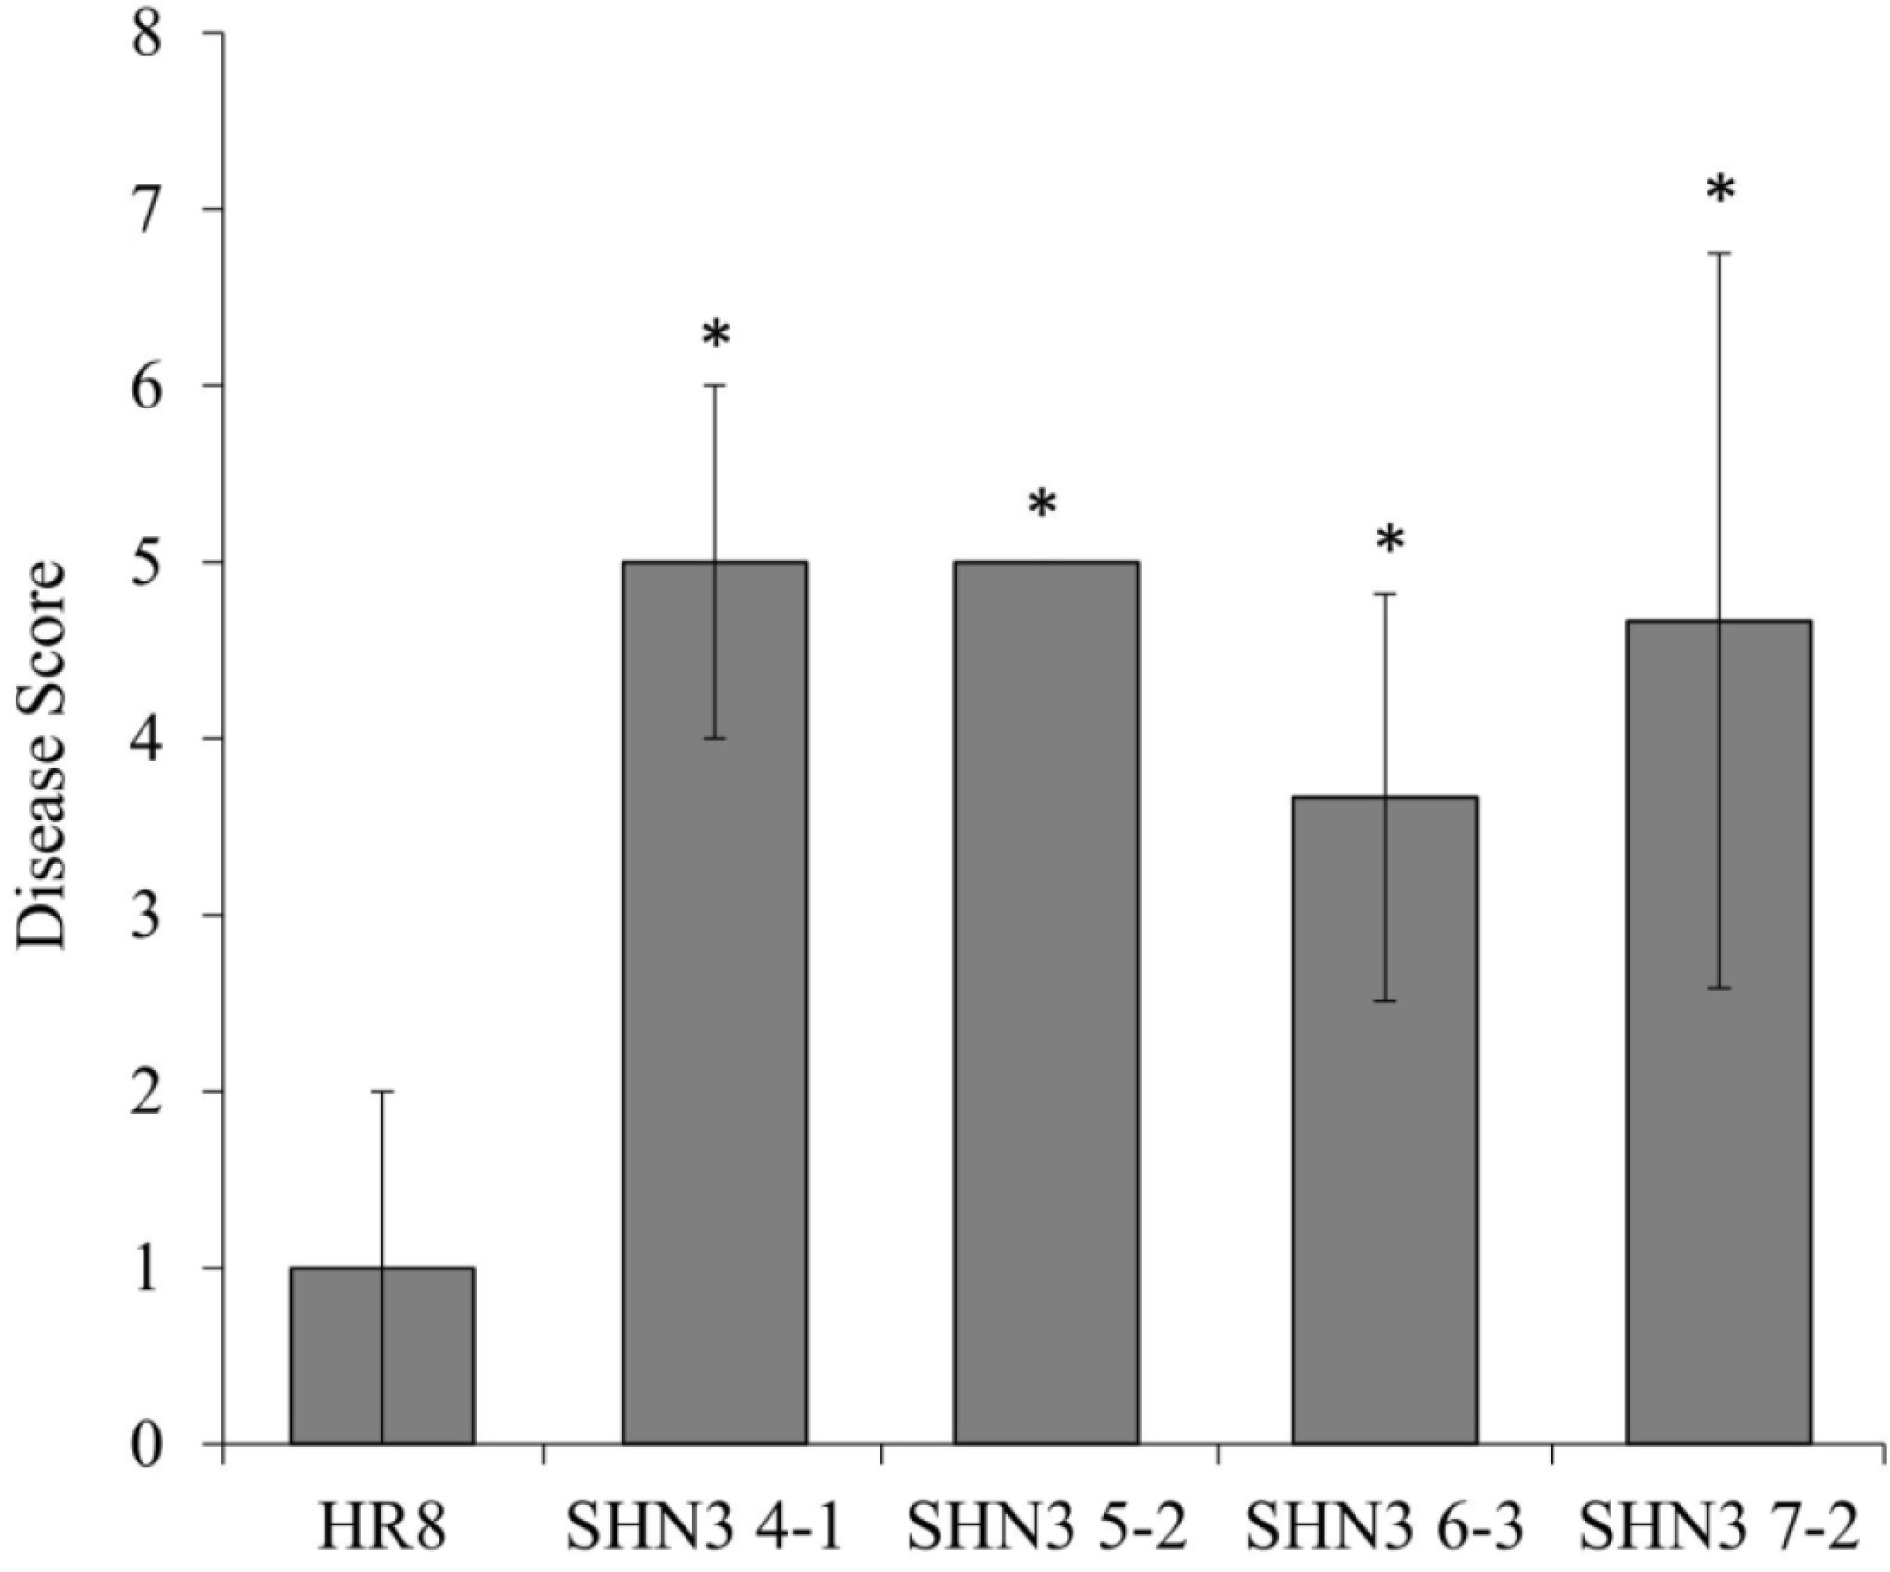
Figure 7.
Switchgrass rust disease assays of AtSHN3-overexpressing transgenic switchgrass plants and wild-type control. * Indicates lines significantly different from the wild-type at p < 0.01. N = 3, the error bars are standard deviations.
-
T0 plants Tiller number Tiller height (cm) Flag leaf length (cm) Flag leaf width (mm) Stem width (mm) Biomass (kg)* HR8 12 126.04 33.3 9.33 4.09 0.096 SHN4-1 10.5 85.25** 25.27 7.23** 3.29 0.069 SHN5-2 6.8 126.50 32.17 10.13 4.35 0.087 SHN6-3 9.2 104.59 23.47 8.01 3.93 0.066 SHN7-2 10.6 75.46** 24.77 7.99 3.58 0.073 * = biomass of plant fresh weight; ** = statistically different at p < 0.01. Table 1.
Comparison of agronomic trait measurements for AtSHN3-overexpressing transgenic switchgrass and HR8 control plants. Trait means were not statistically significantly different unless stated, i.e., p > 0.01.
-
Switchgrass line % Acid soluble lignin % Acid insoluble lignin % Total lignin HR8 15.5 ± 1.1 2.2 ± 0.2 17.7 ± 1.0 SHN4-1 13.1 ± 0.0 2.1 ± 0.2 15.2 ± 0.4 SHN5-2 15.8 ± 1.1 2.5 ± 0.1 18.3 ± 1.1 SHN6-3 15.1 ± 0.3 2.1 ± 0.4 17.2 ± 0.7 SHN7-2 14.2 ± 0.7 2.1 ± 0.2 16.4 ± 0.9 Table 2.
Acid-soluble lignin and acid-insoluble lignin measurement for the AtSHN3-overexpressing transgenic plants and the wild-type control. N = 3, error represents standard deviation.
-
Storage modulus G’ (Pa) HR8 SHN4-1 SHN5-2 SHN6-3 SHN7-2 Strain 2.1E8 2.2E8 2.2E8 1.5E8 1.8E8 Standard deviation 1.8E7 1.1E8 2.9E7 1.5E7 2.6E7 p-value 0.06 0.89 0.85 0.34 Table 3.
Average storage modulus derived from stress sweeps at 25ºC for AtSHN3-overexpressing transgenic plants and HR8 wild-type control. The number of repetitions for this experiment is n = 2 for all biological samples.
-
Measurement HR8 SHN4-1 SHN5-2 SHN6-3 SHN7-2 Initial linear strength (Pa) 2.0E6 1.7E6 1.3E6 1.7E6 1.6E6 Standard deviation 9.3E5 3.1E5 5.6E5 7.7E5 3.9E5 p-value 0.53 0.24 0.65 0.47 Shear stress at breaking
point (Pa)1.9E7 1.6E7 1.7E7 1.4E7 1.8E7 Standard deviation 5.7E6 2.5E6 3.5E6 4.3E6 8.1E5 p-value 0.39 0.57 0.27 0.61 Table 4.
Initial linear strength measurement and shear stress at breaking point for the AtSHN3-overexpressing transgenic lines and the HR8 control. The number of repetitions used for this analysis was n = 5.
Figures
(7)
Tables
(4)