-
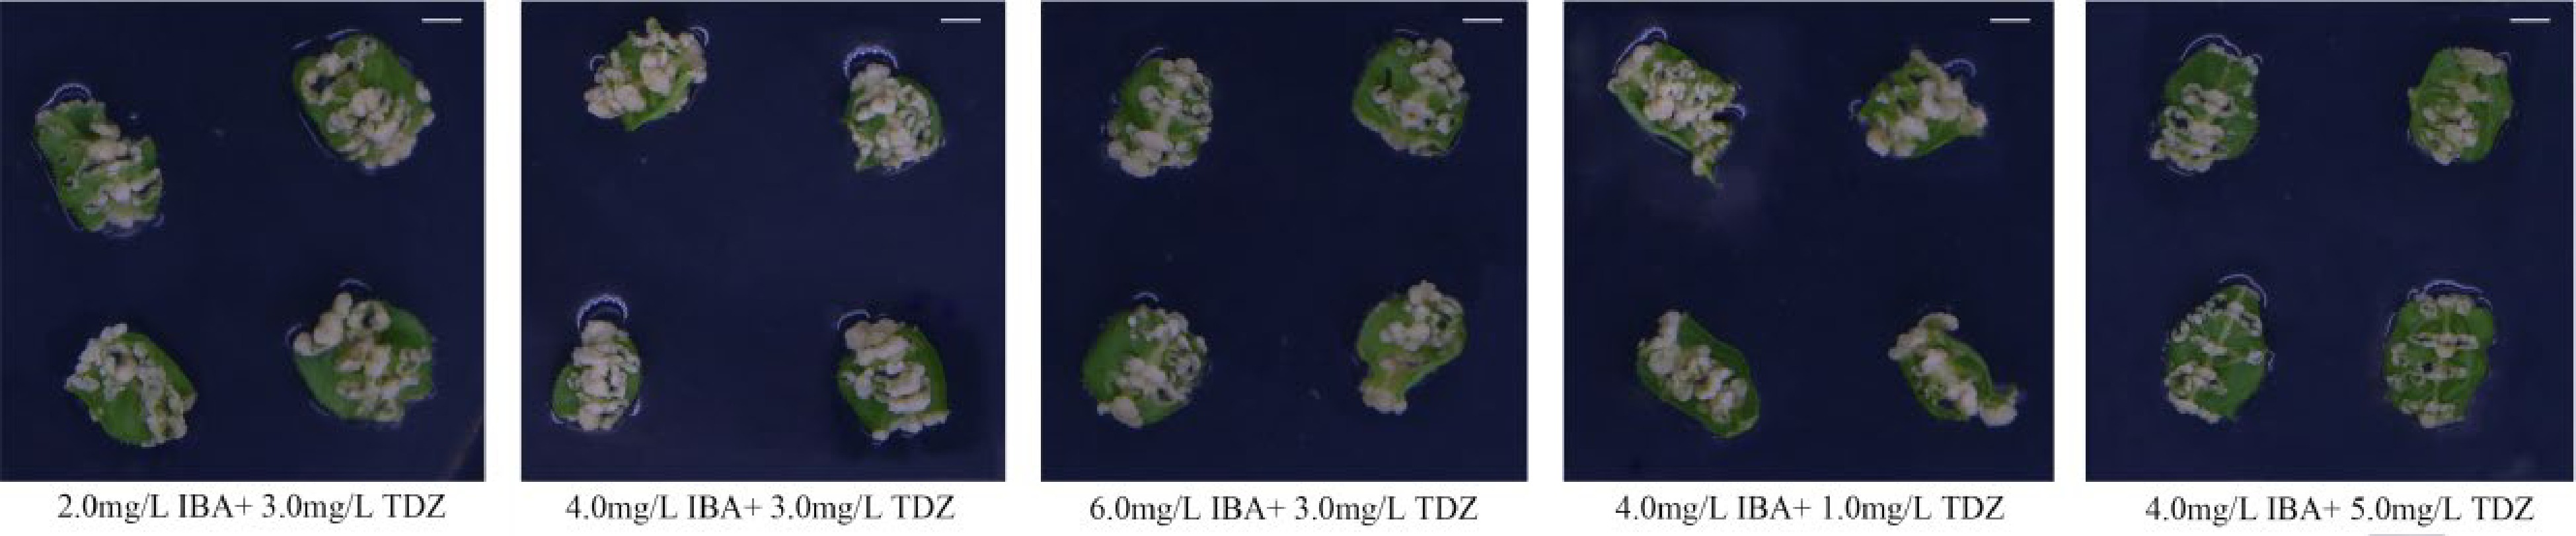
Figure 1.
Comparison of pear callus induced by different TDZ and IBA concentrations. Scale bars = 0.5 cm.
-

Figure 2.
Expression analysis of methylation related genes in pear callus induced by different TDZ and IBA concentrations.
-

Figure 3.
Analysis of expression of auxin and cytokinin-related genes in pear callus induced by different TDZ and IBA concentrations.
-
PGR Combination No. of total
explantsNo. of
callusInduction
rate (%)2.0 mg·L−1 IBA 3.0 mg·L−1 TDZ 50 13 24.00 ± 3.06b 50 14 50 9 4.0 mg·L−1 IBA 50 26 54.00 ± 2.00a 50 26 50 29 6.0 mg·L−1 IBA 50 10 11.33 ± 4.67cd 50 5 50 2 1.0 mg·L−1 TDZ 4.0 mg·L−1 IBA 50 7 14.67 ± 2.91c 50 5 50 10 3.0 mg·L−1 TDZ 50 26 54.00 ± 2.00a 50 26 50 29 5.0 mg·L−1 TDZ 50 2 4.67 ± 1.76d 50 4 50 1 Samples were collected 2 weeks after induction in the dark. Only callus with sizes greater than or equal to 2 mm × 2 mm × 2 mm were counted. All analysis were repeated three times and the mean ± S.E. was calculated. Callus induction rate = number of callus in existence/total number of explants × 100%. Columns with different letters are significantly difference at P < 0.05 by Duncan’s multiple range test. Table 1.
Effects of TDZ and IBA on the differentiation of pear leaf explants.
-
Plant growth regulator TDZ 3.0 mg·L−1 IBA 4.0 mg·L−1 IBA (mg·L−1) TDZ (mg·L−1) MSAP band type 2.0 4.0 6.0 1.0 3.0 5.0 I 396 407 416 379 407 389 II 53 37 31 48 37 49 III 63 72 64 72 72 53 IV 53 49 49 66 49 74 Total amplified bands 512 516 516 499 516 491 Total methylated bands 169 158 144 186 158 176 Methylated ratio (%) 29.91 27.96 26.37 32.92 27.96 31.15 Permethylated ratio (%) 20.53 21.42 20.00 24.42 21.42 22.48 Hemi-methylated ratio (%) 9.38 6.55 6.37 8.50 6.55 8.67 Table 2.
Comparison of DNA methylation level in pear callus induced by different TDZ and IBA concentrations.
-
Type IBA (mg·L−1) No.of band Percentage TDZ (mg·L−1) No. of band Percentage 2.0 4.0 6.0 1.0 3.0 5.0 M H M H M H M H M H M H A1 + + + + + + 364 422 (88.66%) + + + + + + 351 418 (89.51%) A2 + − + − + − 45 + − + − + − 47 A3 − + − + − + 13 − + − + − + 20 B1 − − + + + + 6 28 (5.88%) − − + + + + 0 14 (3.00%) B2 − − + − + − 5 − − + − + − 0 B3 − − + − − − 0 − − + − − − 0 B4 − − − + − + 2 − − − + − + 1 B5 + − − + − + 0 + − − + − + 0 B6 − − − + + + 1 − − − + + + 0 B7 − − + − + + 7 − − + − + + 1 B8 + − + + + + 7 + − + + + + 12 C1 − − − − + + 1 8 (1.68%) − − − − + + 2 11 (2.36%) C2 − − − − − + 3 − − − − − + 5 C3 + − + − + + 1 + − + − + + 1 C4 + − + − − + 0 + − + − − + 1 C5 − − − − + − 3 − − − − + − 2 D1 + + + + − + 5 18 (3.78%) + + + + − + 13 24 (5.14%) D2 + + + + − − 1 + + + + − − 1 D3 + + − − − − 7 + + − − − − 1 D4 + − + − − − 3 + − + − − − 7 D5 + − − − − − 1 + − − − − − 2 D6 − + − + − − 1 − + − + − − 0 Total 476 467 Table 3.
MSAP pattern of pear callus induced by different TDZ and IBA concentrations.
Figures
(3)
Tables
(3)