-
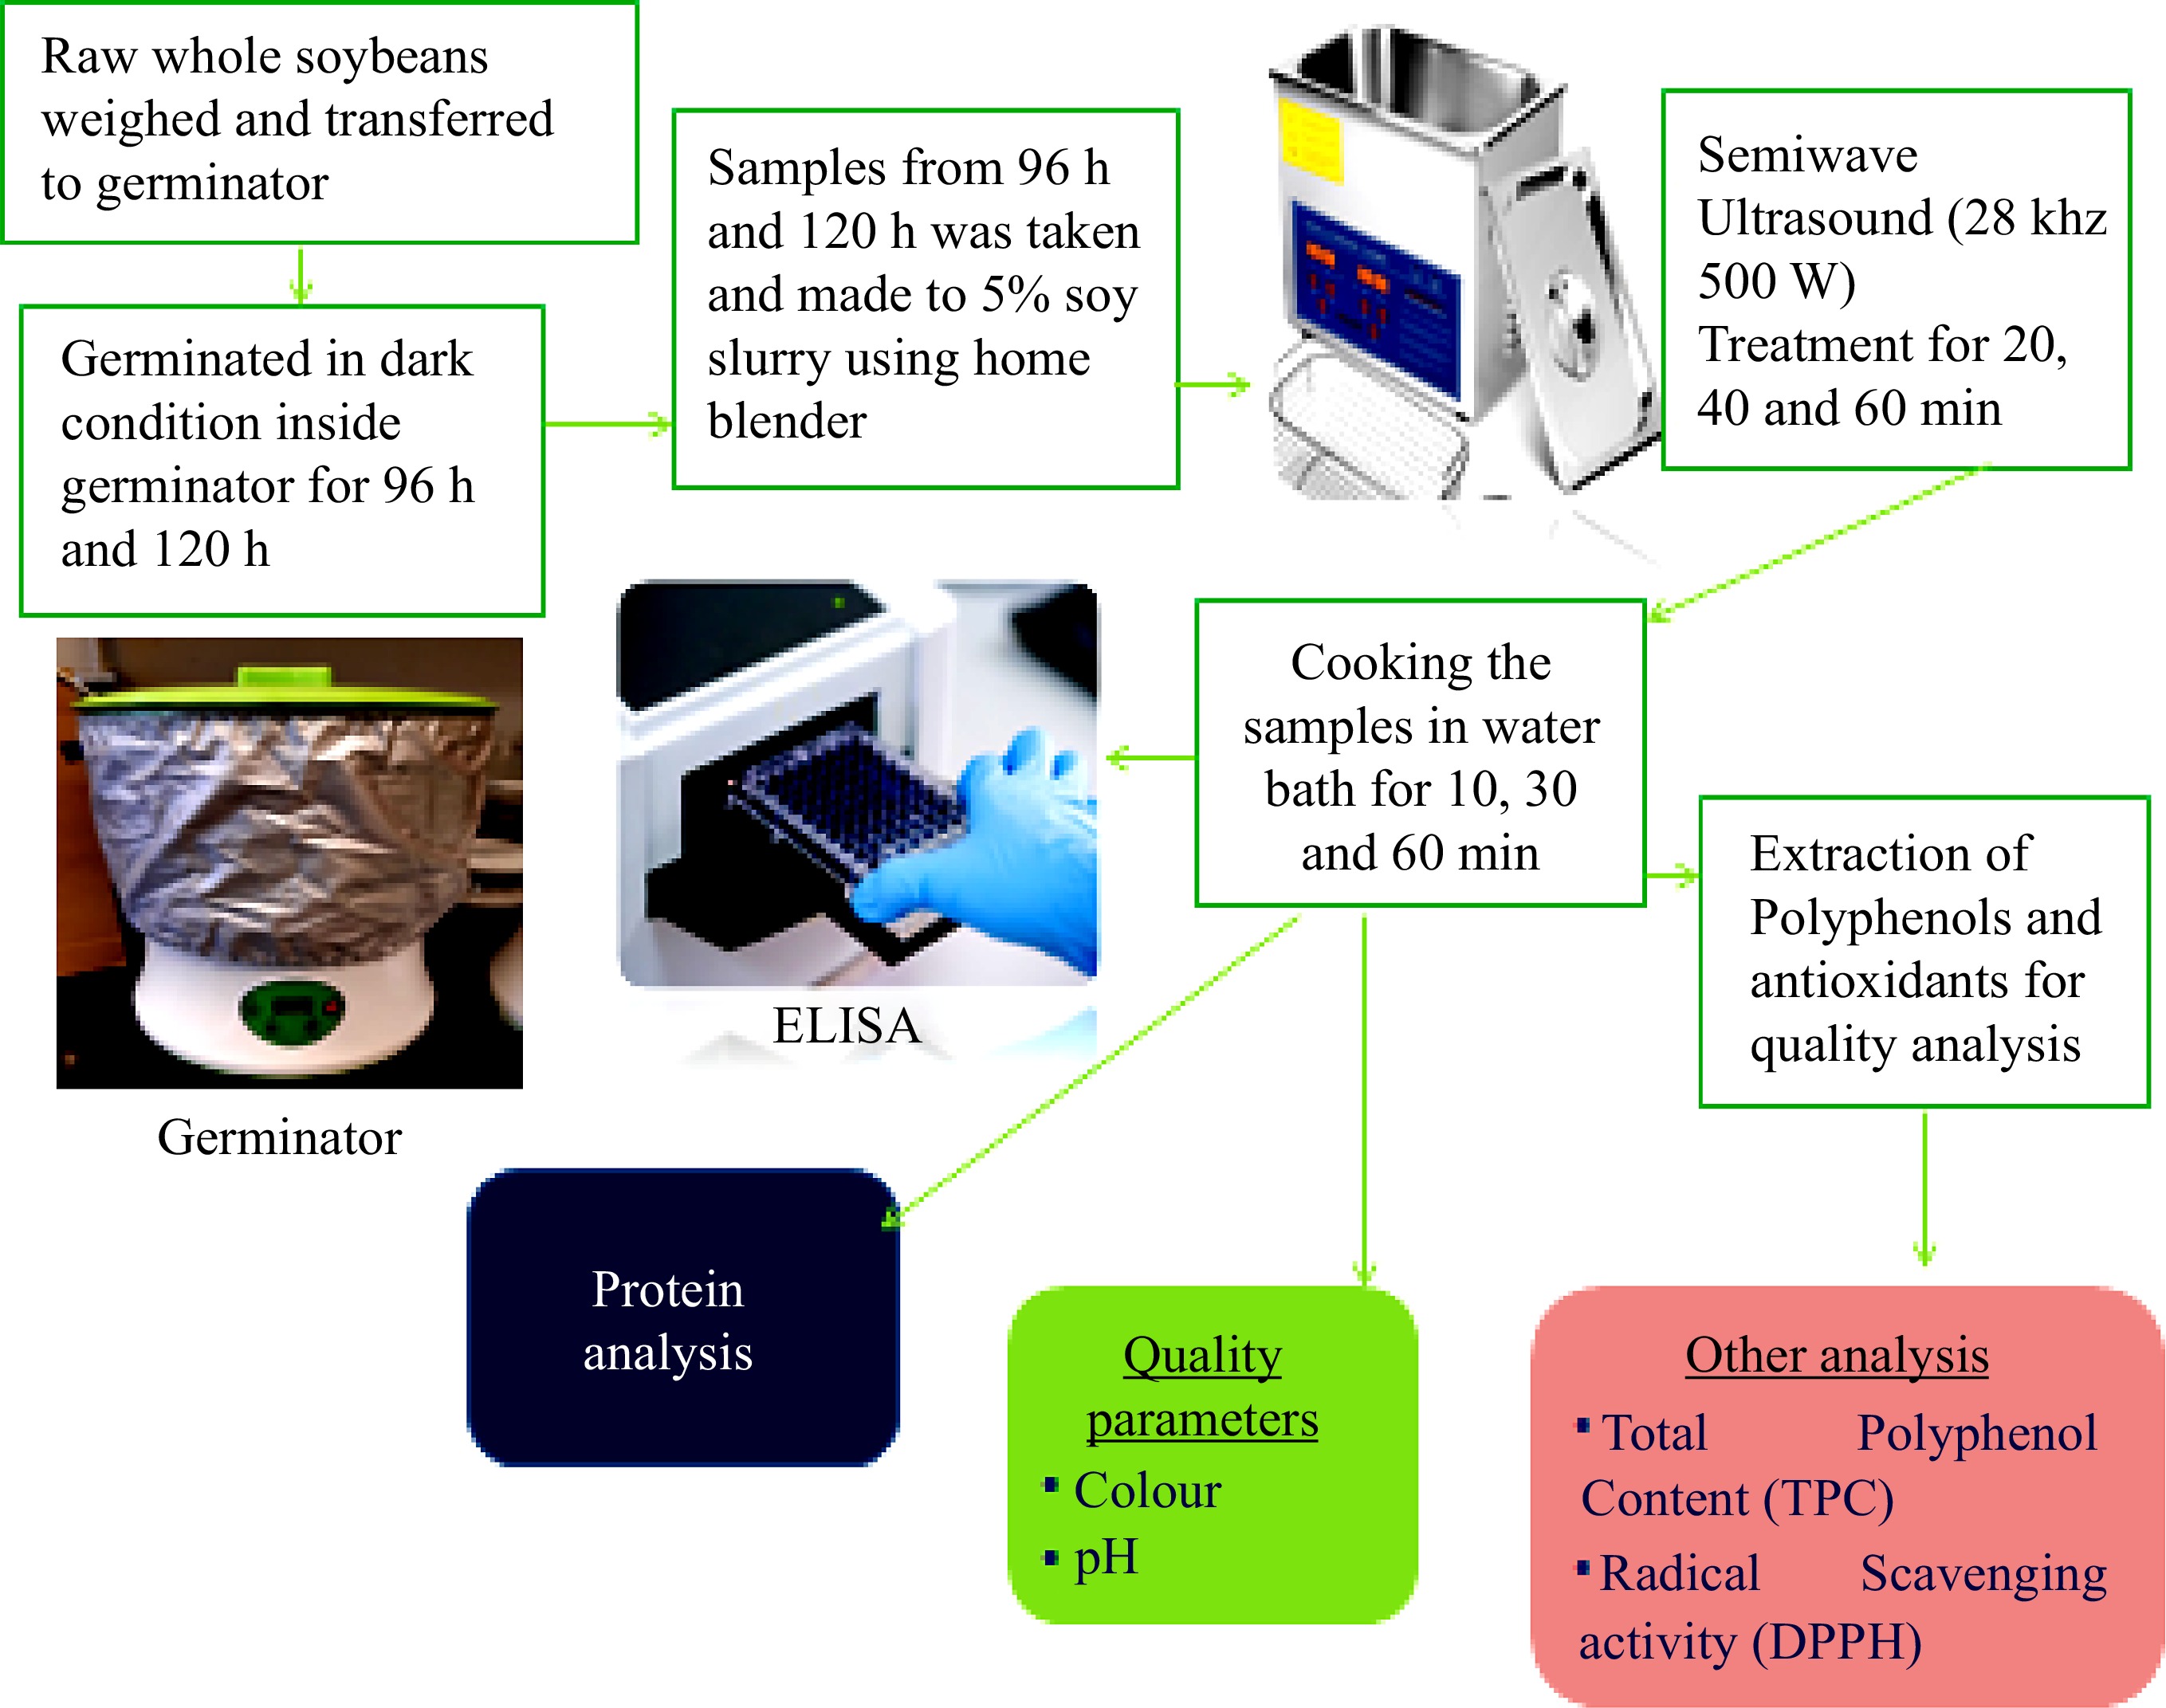
Figure 1.
Flowchart of soy slurry prepared from germinated soybeans.
-
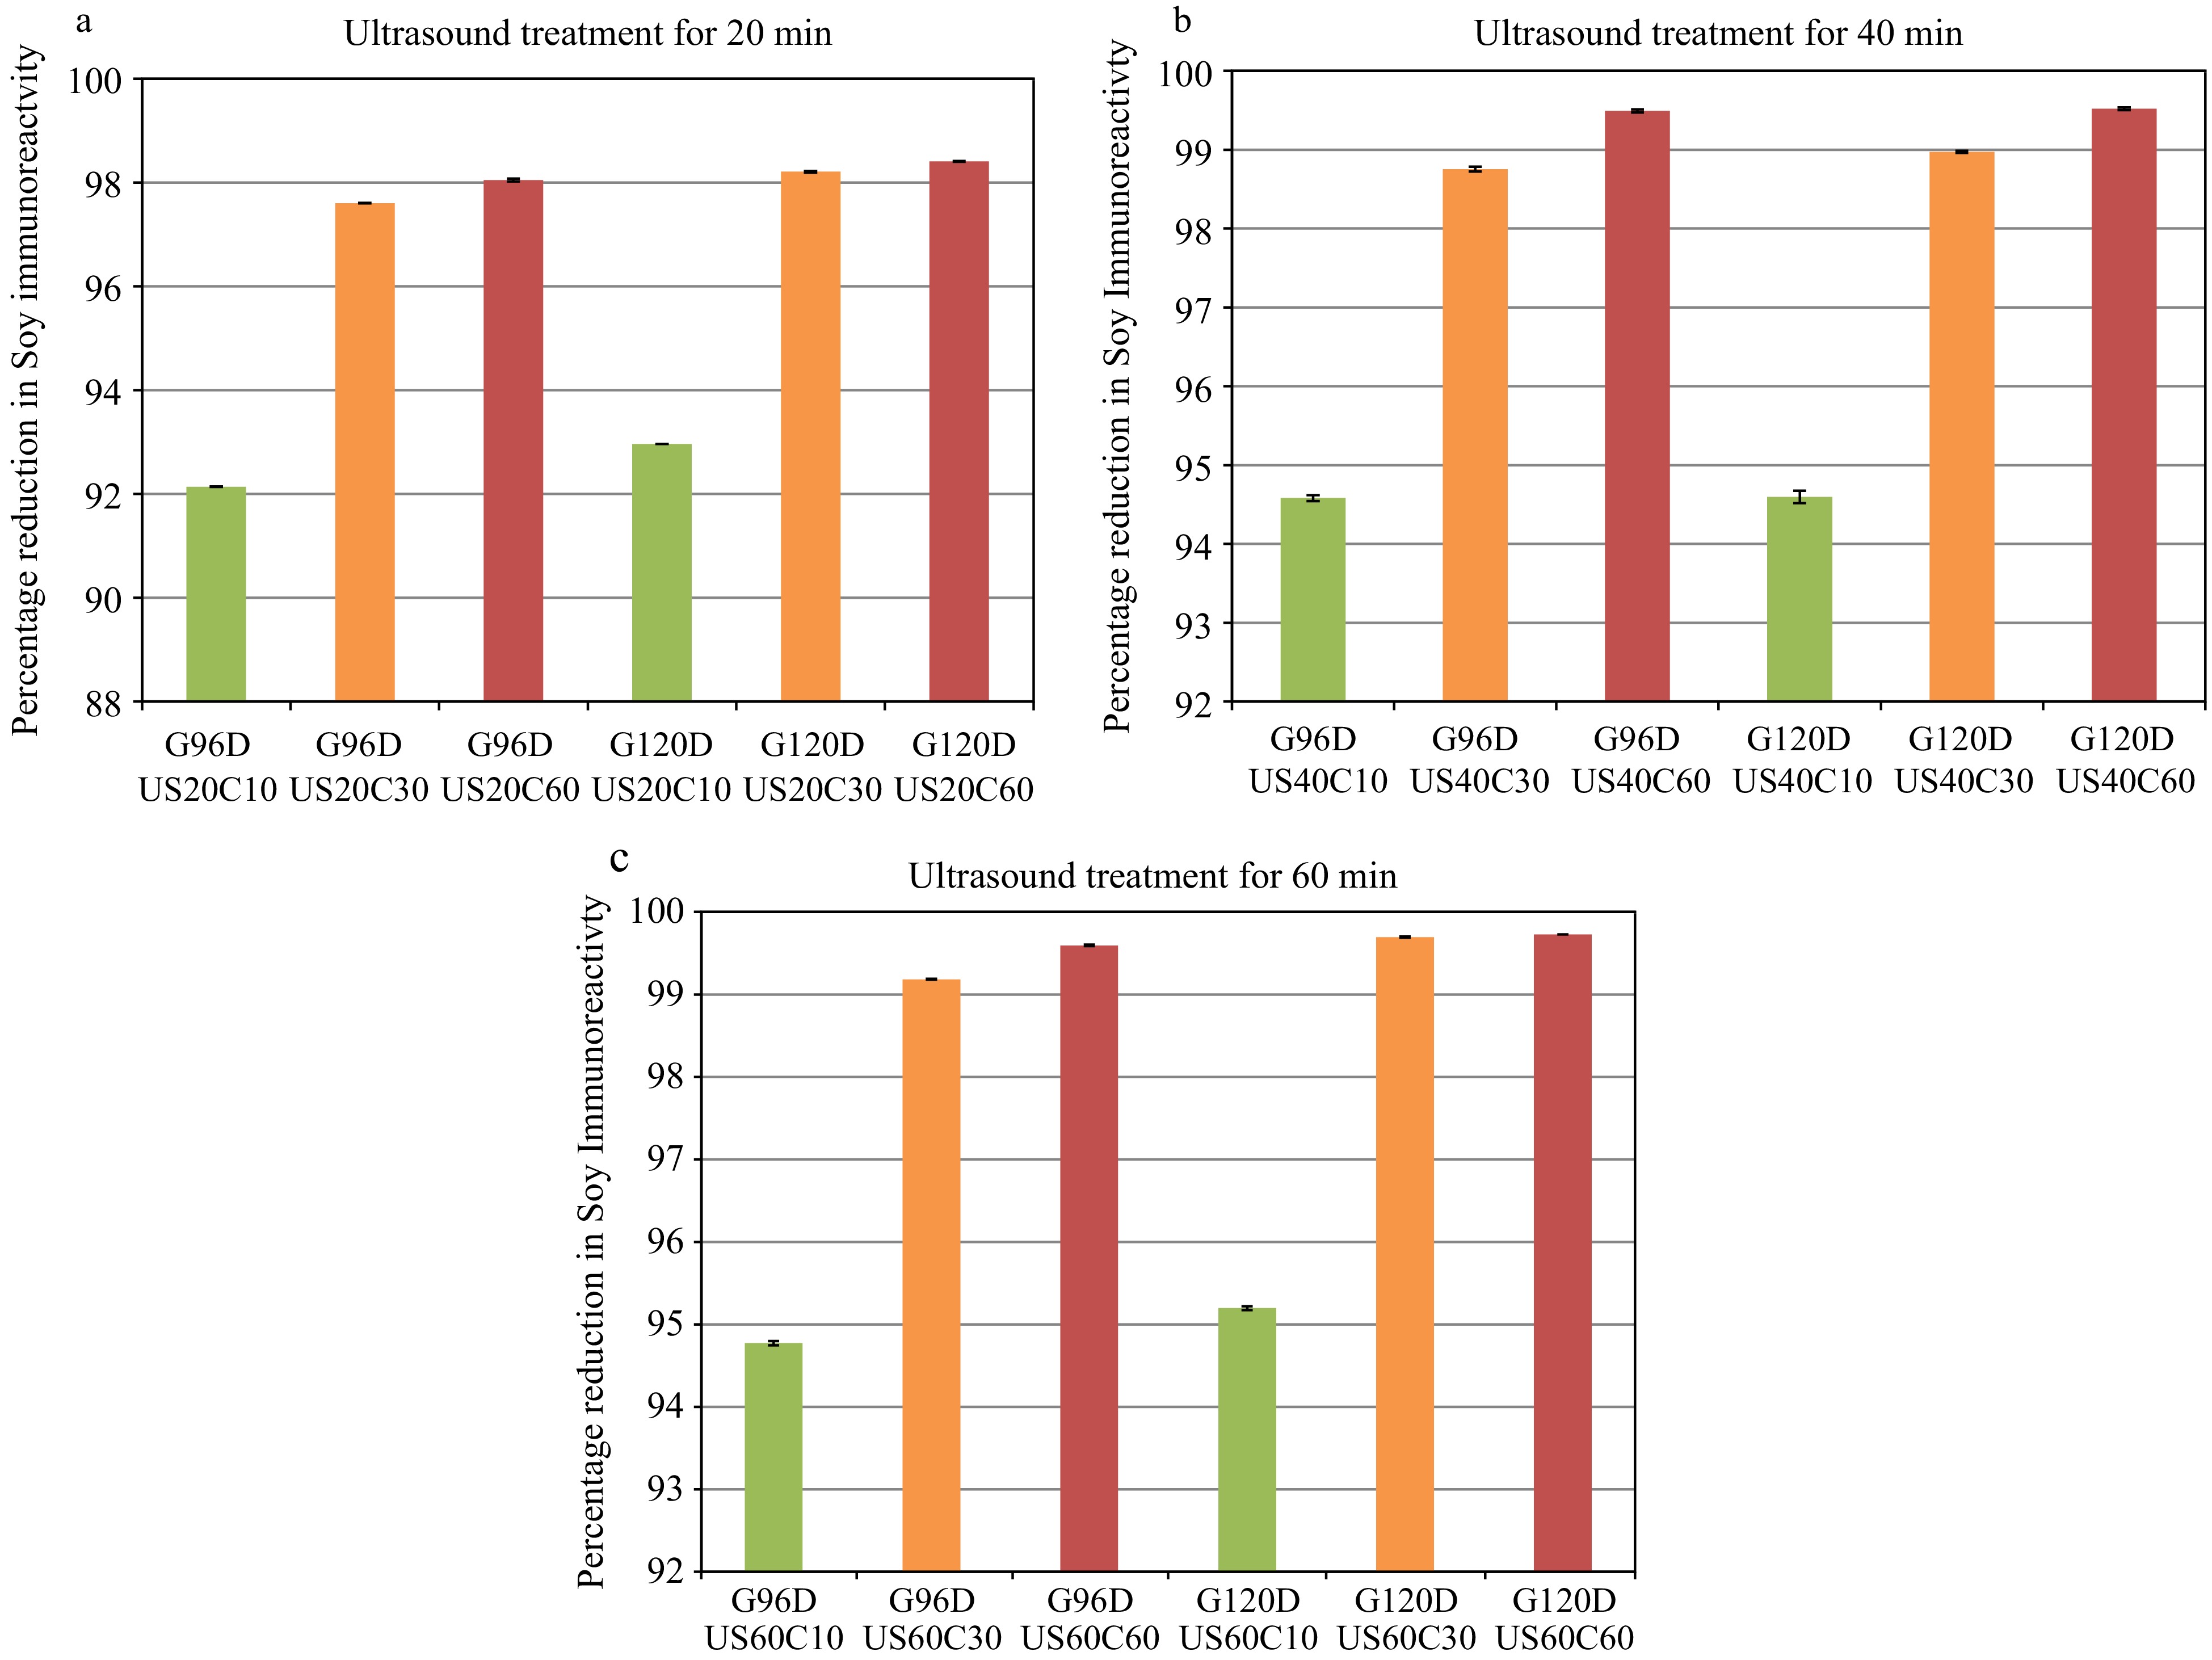
Figure 2.
(a) Percentage reduction in soy IR in samples germinated for 96 or 120 h (G96D, G120D), ultrasound treated for 20 min and cooked for 10, 30 and 60 min (C10, C30 and C60). (b) Percentage reduction in soy IR in samples germinated for 96 or 120 h (G96D, G120D), ultrasound treated for 40 min and cooked for 10, 30 and 60 min (C10, C30 and C60). (c) Percentage reduction in soy IR in samples germinated for 96 or 120 h (G96D, G120D), ultrasound treated for 60 min and cooked for 10, 30 and 60 min (C10, C30 and C60).
-

Figure 3.
(a) FTIR spectrum of unprocessed, germinated for 96 and 120 h (G96D and G120D) and ultrasound treated for 20 min (US20) and cooked for 30 and 60 min (C30, C60). (b) FTIR spectrum of unprocessed, germinated for 96 and 120 h (G96D and G120D) and ultrasound treated for 40 min (US20) and cooked for 30 and 60 min (C30, C60). (c) FTIR spectrum of unprocessed, germinated for 96 and 120 h (G96D and G120D) and ultrasound treated for 60 min (US20) and cooked for 30 and 60 min (C30, C60).
-
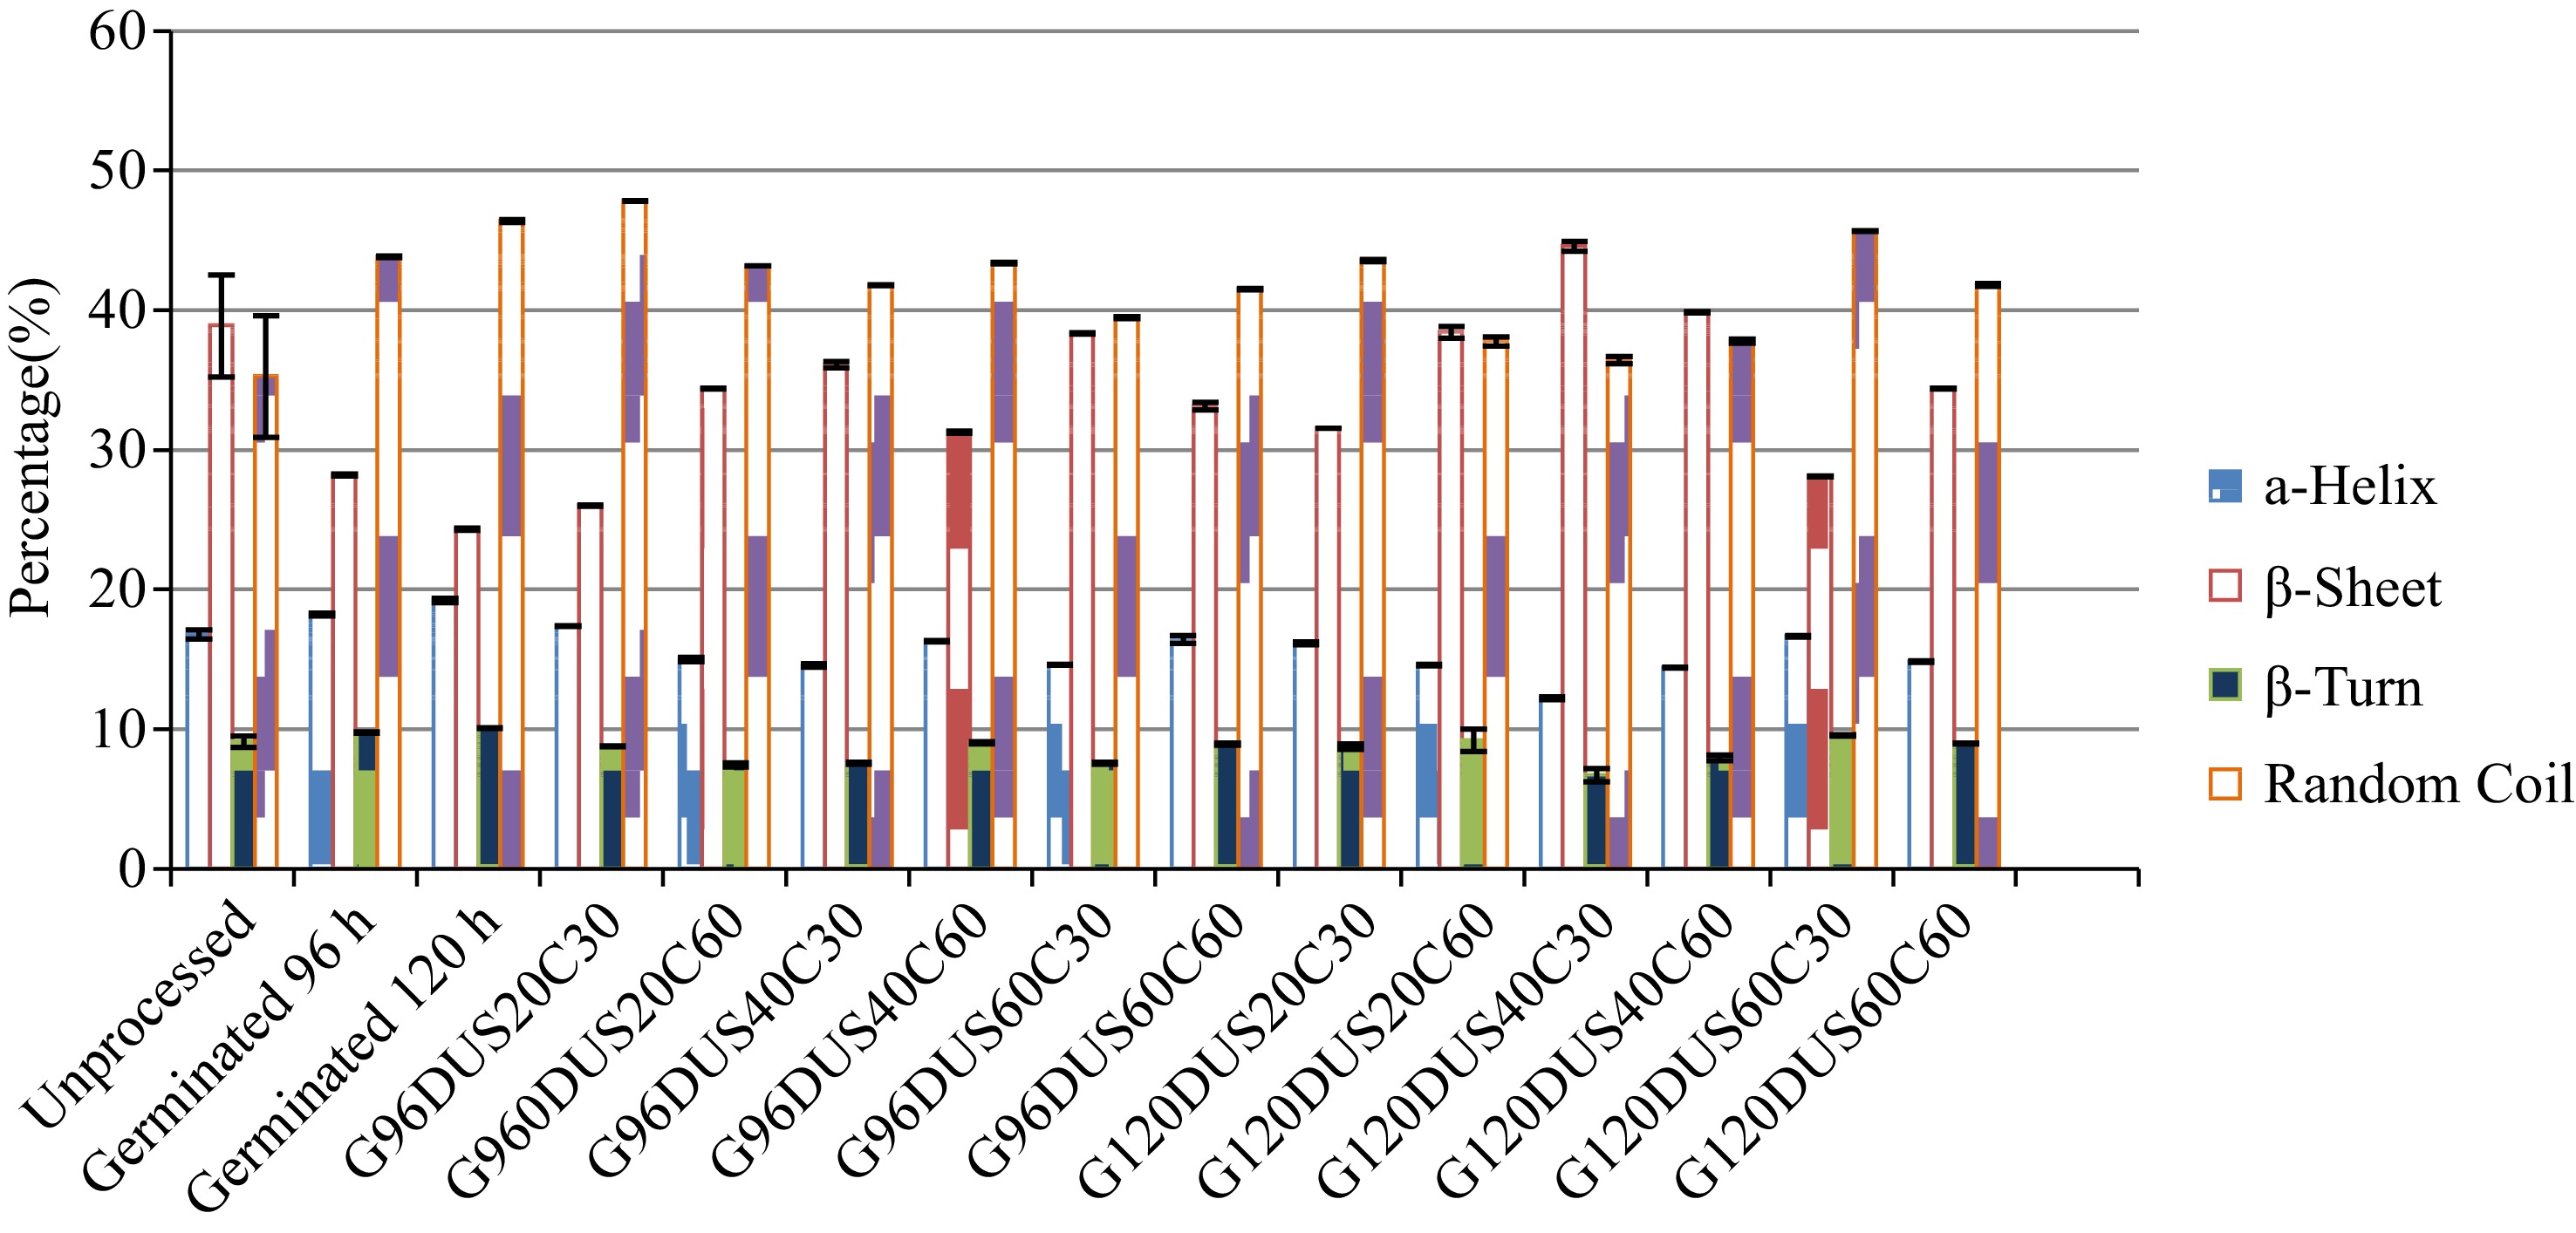
Figure 4.
Percentage of secondary structure of soy slurry samples after different treatments: unprocessed, germinated for 96 and 120 h (G96D and G120D) and ultrasound treated for 20 min (US20), 40 min (US40), 60 min (US60) and cooked for 30 and 60 min (C30, C60).
-
Sample name Germination time in the dark (h) Ultrasound treatment time (min) Cooking time (min) Unprocessed 0 0 0 G96DUS0 96 0 G96DUS20 20 G96DUS40 40 G96DUS60 60 G96DUS20C10 20 10 G96DUS40C10 40 G96DUS60C10 60 G96DUS20C30 20 30 G96DUS40C30 40 G96DUS60C30 60 G96DUS20C60 20 60 G96DUS40C60 40 G96DUS60C60 60 G120DUS0 120 0 0 G120DUS20 20 G120DUS40 40 G120DUS60 60 G120DUS20C10 20 10 G120DUS40C10 40 G120DUS60C10 60 G120DUS20C30 20 30 G120DUS40C30 40 G120DUS60C30 60 G120DUS20C60 20 60 G120DUS40C60 40 G120DUS60C60 60 Sample notation: G(x)DUS(y)C(z); x is the germination duration in h, y is the ultrasound treatment time (min) and z is the cooking time (min). Table 1.
Treatment conditions of soy slurry samples.
-
Sample name Soy allergen immunoreactivity (mg/L) Percentage reduction in soy allergen immunoreactivity (%) Unprocessed 377.35 ± 2a G96DUS0 302.3 ± 0.57b[0.10] 19.9 ± 0.3b[0.10] G120DUS0 303.4 ± 9.26b[0.09] 19.6 ± 1.99b[0.09] G96DUS20 264.71 ± 4.96A[0.15] 29.9 ± 0.91A[0.15] G96DUS40 250.57 ± 0.76CD[0.18] 33.6 ± 0.58CD[0.18] G96DUS60 189.6 ± 4.22E[0.30] 49.8 ± 1.41E[0.30] G120DUS20 289.84 ± 0.23BC[0.11] 23.2 ± 0.5BC[0.11] G120DUS40 248.3 ± 9.97CD[0.18] 34.2 ± 2.26CD[0.18] G120DUS60 192.3 ± 9.57E[0.29] 49.1 ± 2.24E[0.29] Values are presented as mean ± SD (n = 3). Values with different superscripts are significantly different (p < 0.05). Lowercase letters represent immunoreactivity and percentage reduction in immunoreactivity for germination. Uppercase letters represent combinations of germination and ultrasound treatment. The values given in [ ] are the log reduction in immunoreactivity of samples. Sample notation: G(x)DUS(y)C(z); x is the germination duration in h, y is the ultrasound treatment time (min) and z is the cooking time (min). Table 2.
Immunoreactivity of soy slurry samples with germination and ultrasound treatment.
-
Sample
nameCooking
time (min)Soy immunoreactivity
(mg/L)Logarithmic cycle reduction in soy
immunoreactivity
Log(10)Unprocessed 0 377.35 ± 2.16a G96DUS20C10 10 29.67 ± 0.15b 1.10 G96DUS40C10 20.46 ± 0.03de 1.27 G96DUS60C10 19.74 ± 0.02e 1.28 G96DUS20C30 30 9.05 ± 0.06f 1.62 G96DUS40C30 4.71 ± 0.08l 1.90 G96DUS60C30 3.08 ± 0.01m 2.09 G96DUS20C60 60 7.37 ± 0.07ij 1.71 G96DUS40C60 1.92 ± 0.08n 2.29 G96DUS60C60 1.53 ± 0.02n 2.39 G120DUS20C10 10 26.56 ± 0.15c 1.15 G120DUS40C10 20.4 ± 0.18de 1.27 G120DUS60C10 18.14 ± 0.01e 1.32 G120DUS20C30 30 6.77 ± 0.03k 1.75 G120DUS40C30 3.88 ± 0.03m 1.99 G120DUS60C30 1.15 ± 0.02op 2.52 G120DUS20C60 60 6.02 ± 0.01k 1.80 G120DUS40C60 1.81 ± 0.06n 2.32 G120DUS60C60 1.03 ± 0.01op 2.57 Values are presented as means ± SD (n = 3). Values with different superxscripts are significantly different (p < 0.05). Log reduction: Log (unprocessed – processed). Sample notation: G(x)DUS(y)C(z); x is the germination duration in h, y is the ultrasound treatment time (min) and z is the cooking time (min). Table 3.
Immunoreactivity of soy slurry samples with a combination of germination ultrasound treatment and cooking.
-
Sample Germination time (h) Ultrasound treatment Cooking time at 100 °C
(min)TPC
(mg of GAE/g)DPPH radical
scavenging activity (%)Unprocessed 0 0 0 2.53 ± 0.03a 20.9 ± 0.03a Germinated 96 h 96 0 0 12.5 ± 0.3b 54.4 ± 0.14b Germinated 120 h 120 0 0 12.7 ± 0.11b 55.2 ± 0.07bc G96D US20 96 20 0 14.3 ± 0.07ab 57.2 ± 0.05d G96D US40 40 0 14.4 ± 0.06ab 59.8 ± 0.05e G96D US60 60 0 14.5 ± 0.03ab 60.8 ± 0.04f G96D US20C10 20 10 9.3 ± 0.07cd 45.8 ± 0.06h G96D US40C10 40 10 9.2 ± 0.27cd 43.3 ± 0.78i G96D US60C10 60 10 9.9 ± 0.02e 43.1 ± 0.04i G96D US20C30 20 30 7.6 ± 0.02 48.9 ± 0.15j G96D US40C30 40 30 7.5 ± 0.04gh 43.9 ± 0.01i G96D US60C30 60 30 7.3 ± 0.03gh 33.1 ± 0.07k G96D US20C60 20 60 7.3 ± 0.17gh 36.6 ± 0.04kl G96D US40C60 40 60 7.2 ± 0.04gh 36.4 ± 0.06kl G96D US60C60 60 60 7.6 ± 0.44gh 33.4 ± 0.01k G120D US20 120 20 0 14.6 ± 0.11ab 56.4 ± 0.01bc G120D US40 40 0 14.6 ± 0.22ab 59.4 ± 0.03e G120D US60 60 0 14.7 ± 0.64ab 66.6 ± 0.15g G120D US20C10 20 10 10.6 ± 0.24ef 37.4 ± 0.05ij G120D US40C10 40 10 9.2 ± 0.06cd 33.3 ± 0.03k G120D US60C10 60 10 9.1 ± 0.01cd 26.7 ± 0.01m G120D US20C30 20 30 8.8 ± 0.09g 34.5 ± 0.01klm G120D US40C30 40 30 8.5 ± 0.02g 28.2 ± 0.04n G120D US60C30 60 30 7.5 ± 0.16gh 26.4 ± 0.07m G120DUS20C60 20 60 8.5 ± 0.06g 29.1 ± 0.04no G120D US40C60 40 60 7.3 ± 0.05gh 26.2 ± 0.01m G120D US60C60 60 60 6.2 ± 0.03h 24.7 ± 0.01op Values are presented as means ± SD (n = 3). Values with different superscripts are significantly different (p < 0.05).
Sample notation: G(x)DUS(y)C(z); x is the germination duration in h, y is the ultrasound treatment time (min), and z is the cooking time (min).Table 4.
Total phenolic and DPPH inhibition values of soy slurry samples.
Figures
(4)
Tables
(4)