-

Figure 1.
Diagram showing how rice tissue culture is used together with Agrobacterium-mediated transformation.
-

Figure 2.
Grain shapes of rice cultivars used in this study. Scale bar = 0.5 cm.
-
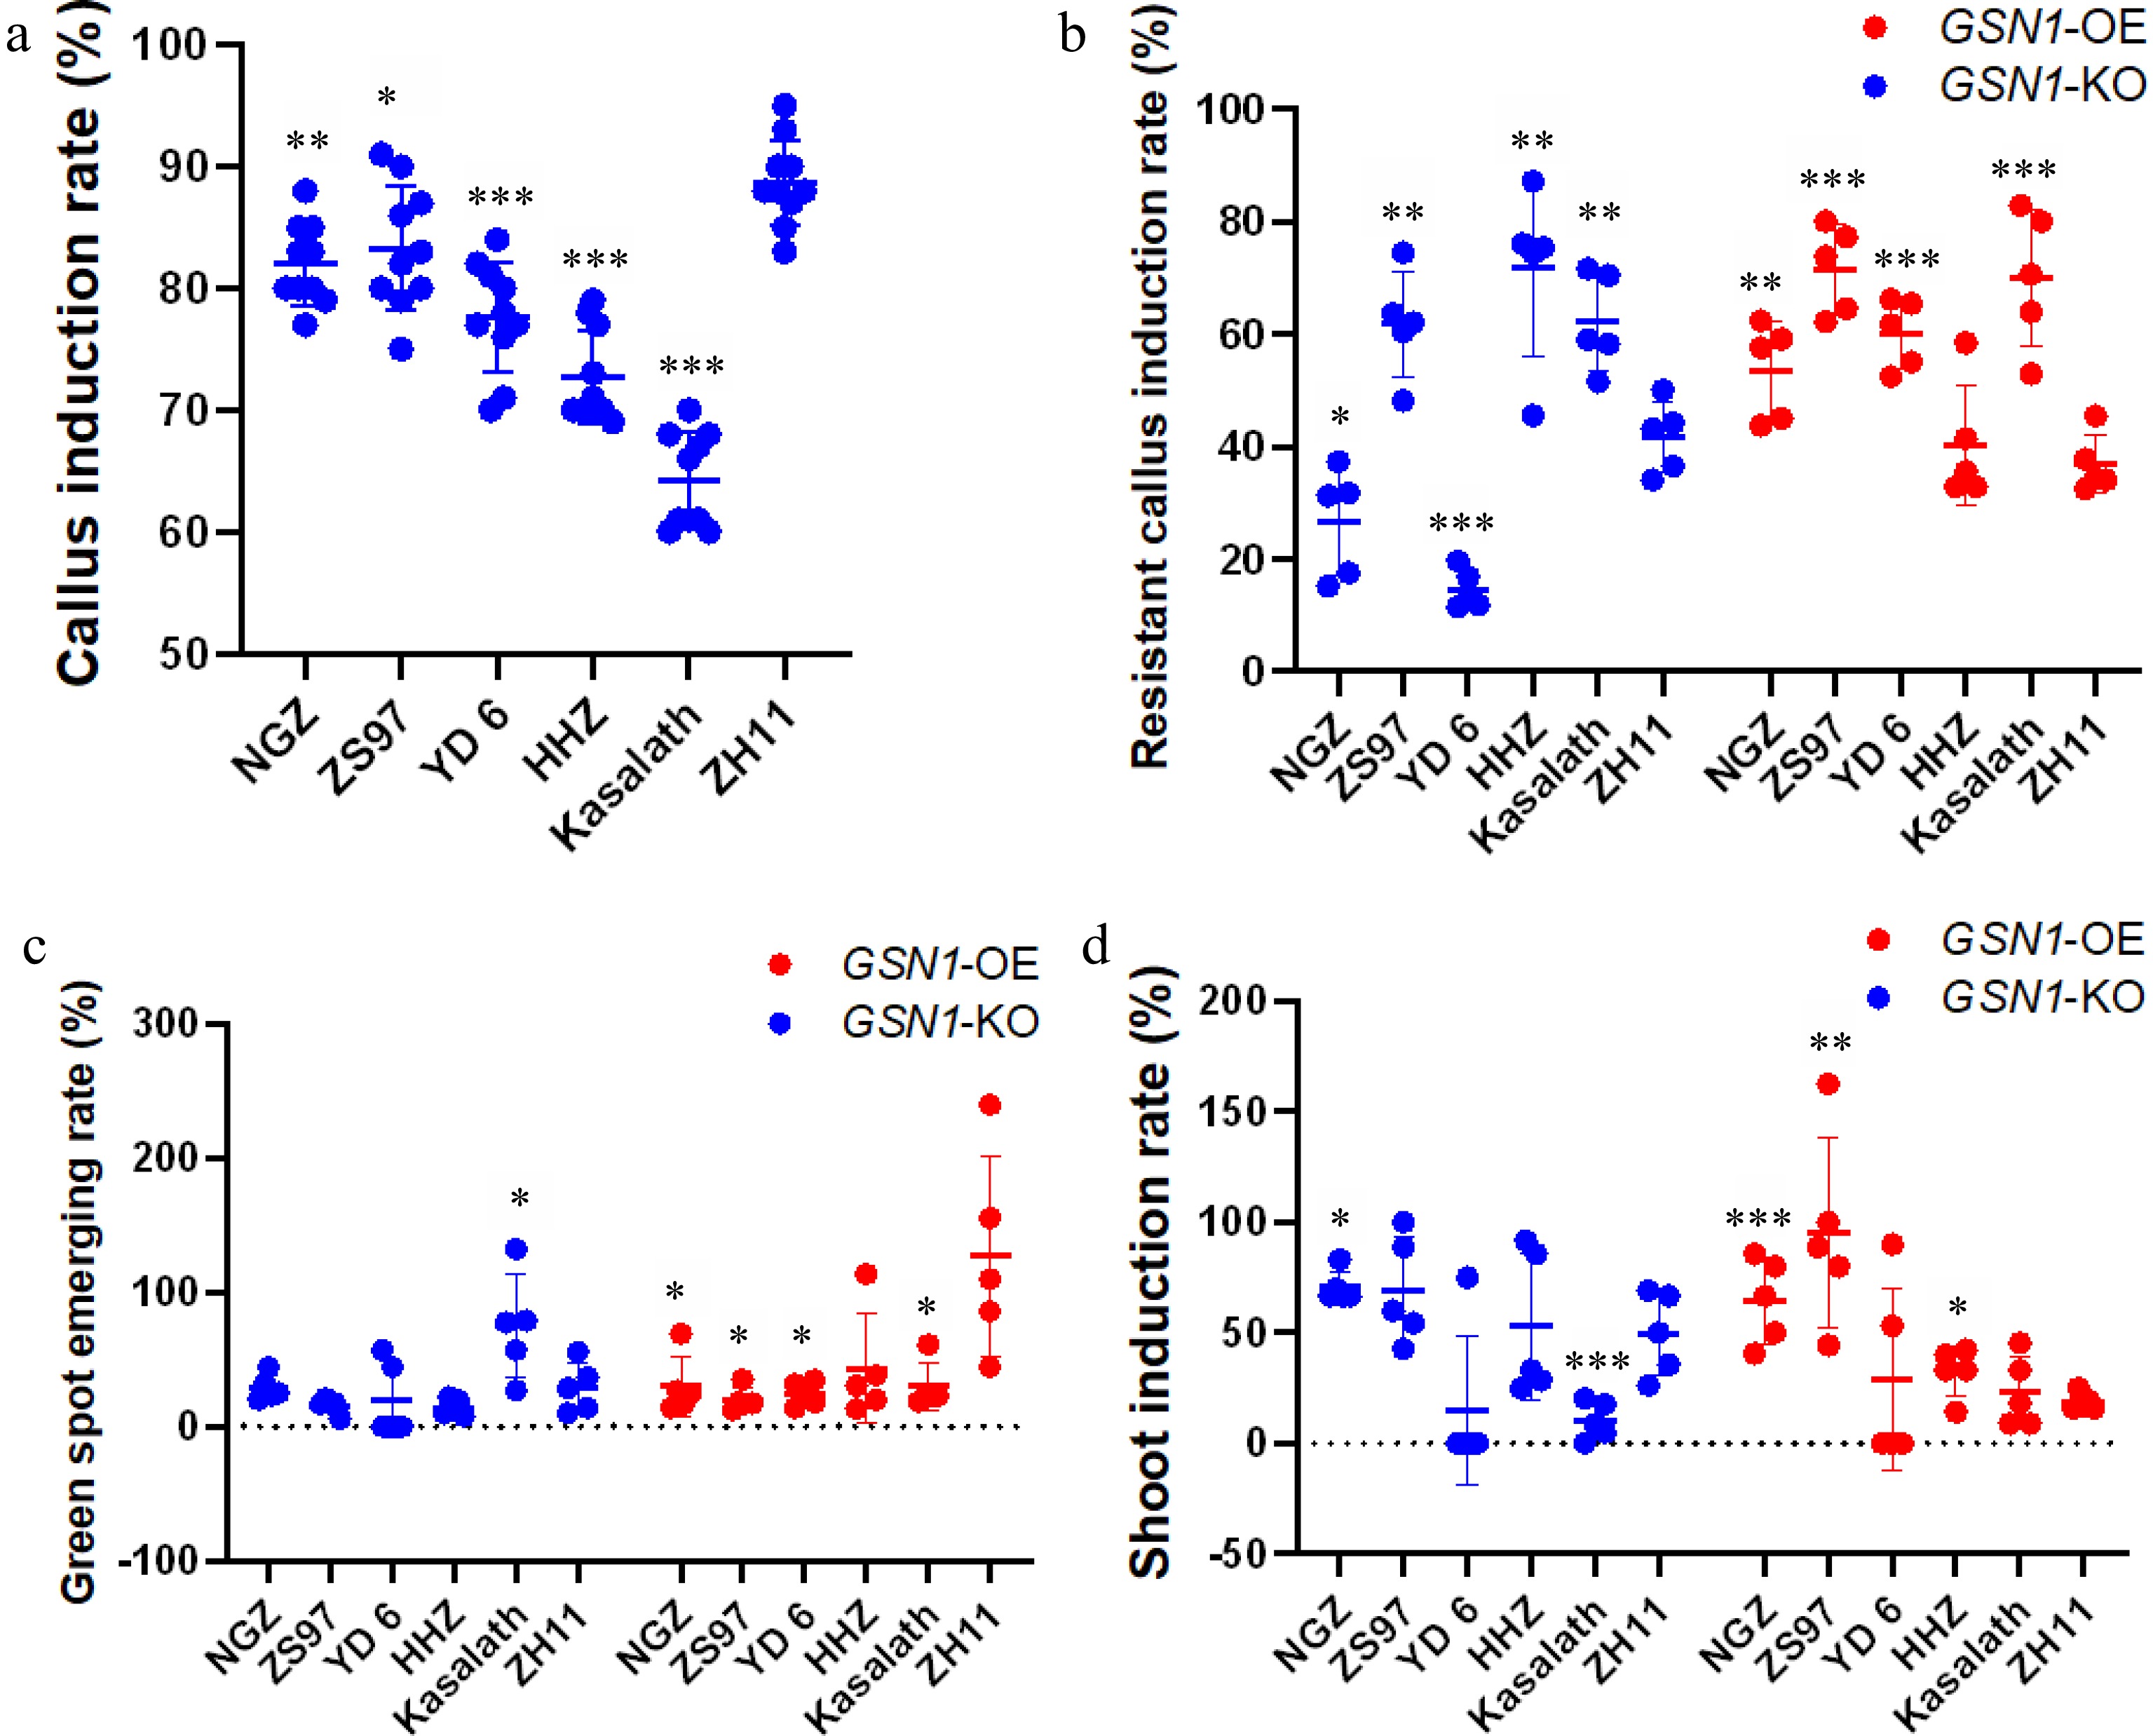
Figure 3.
Statistical analysis of plant tissue culture among six cultivars for the pYLCRISPR/Cas9Pubi-GSN1-H (GSN1-KO) plasmid and the pCAMBIA1300-GSN1-FLAG (GSN1-OX) plasmid. (a) The callus induction rate of six rice cultivars; (b) The resistant callus induction rate of six cultivars; (c) The green spot emerging rate of six cultivars; (d) The shoot induction rate of six cultivars. For callus induction process, ten independent biological repeats were performed (n = 10). For specific plasmid transformation process, five independent biological repeats were carried (n = 5), each performance utilized 100 healthy intact seeds from every cultivar for plant tissue culture process. Data are presented as the mean ± standard deviation. * < 0.05, ** < 0.01, *** < 0.001 (Student's t-test).
-

Figure 4.
Phenotypes of T2 seeds of the six cultivars used in this study. For each cultivar, the average grain length (at left in pink, a1−f1), grain width (at middle left in blue, a2−f2), and grain thickness (at middle right in green, a3−f3) is shown for the wild-type, two GSN1-overexpression lines (OX-1 and OX-2), and two GSN1-knockout lines (KO-1 and KO-2). On the right (a4−f4) are grain phenotypes in the wild-type and mutant lines for each cultivar. Scale bar = 1 cm, n = 10.
-

Figure 5.
Quantitative reverse transcription PCR (qRT-PCR) analysis of the callus related genes. Samples are harvested from calli after 7 d in CIM. The Actin gene was used as internal control to normalize gene expression data. Values are given as the mean ± SD. * P < 0.05; ** P < 0.01 and *** P < 0.001 compared with the ZH11 control using Student’s t-test. Standard deviations were calculated from three biological replicates.
-

Figure 6.
Single nucleotide polymorphisms (SNPs) and insertion/deletion mutations (InDels) in four genes related to plant tissue culture in seven cultivars. The key and main SNPs and InDels are shown in the promoter regions, untranslated regions (UTRs), coding regions, and introns. Genes were analyzed for the six cultivars included in the experimental section of this study using Nipponbare as the reference genome. Results are shown for (a) OsCRL, (b) OsBOC1, (c) OsBBM3, and (d) OsSET1. Bases shown in red in (a) and (b) indicate potential functional SNPs that may contribute to callus induction and browning.
-
Sample name Sample quantity Mature seeds Callus induction Resistant callus Green spot Shoot induction Transformation NGZ 1000 (100%) 820 (82%)** 111 (26.7%)** 34 (30.6%)n.s 24 (70.5%)n.s 24 (4.8%)n.s ZS97 1000 (100%) 833 (83.3%)* 271 (62.0%)* 41 (15.1%)n.s 26 (63.4%)n.s 26 (5.2%)n.s YD 6 1000 (100%) 776 (77.6%)*** 54 (14.5%)*** 12 (22.2%)* 6 (50%)* 6 (1.2%)* HHZ 1000 (100%) 727 (72.7%)*** 261 (71.1%)* 36 (13.7%)n.s 22 (61.1%)n.s 22 (4.4%)n.s Kasalath 1000 (100%) 642 (64.2%)*** 196 (62.2%)n.s 140 (71.4%)* 17 (12.1%)n.s 17 (3.4%)n.s ZH11 1000 (100%) 887 (88.7%) 189 (41.6%) 55 (29.1%) 24 (43.6%) 24 (4.8%) Data are given as the mean. n.s, no significance, * P < 0.05; ** P < 0.01; *** P < 0.001 compared with the corresponding ZH11 using Student’s t-test. The callus induction rate was caculated from the overall induced callus which was used for the whole studies. Table 1.
Number of samples and survival rate percentage at each transformation step with the pYLCRISPR/Cas9Pubi-GSN1-H (GSN1-KO) plasmid in six rice cultivars.
-
Sample name Sample quantity Mature seeds Callus induction Resistant callus Green spot Shoot induction Transformation NGZ 1000 (100%) 820 (82%)** 217 (53.5%)* 69 (31.8%)* 39 (56.5%)n.s 39 (7.8%)n.s ZS97 1000 (100%) 833 (83.3%)* 283 (71.5%)*** 56 (19.8%)* 52 (92.9%)n.s 52 (10.4%)n.s YD 6 1000 (100%) 776 (77.6%)*** 243 (60.14%)*** 60 (24.7%)* 17 (28.3%)n.s 17 (3.4%)n.s HHZ 1000 (100%) 727 (72.7%)*** 146 (40.6%)n.s 62 (42.5%)* 23 (37.1%)n.s 23 (4.6%)n.s Kasalath 1000 (100%) 642 (64.2%)*** 229 (45.8%)* 64 (27.9%)* 13 (20.3%)* 13 (2.6%)* ZH11 1000 (100%) 887 (88.7%) 160 (36.9%) 206 (161.5%) 37 (17.9%) 37 (7.4%) Data are given as the mean. n.s, no significance, * P < 0.05; ** P < 0.01; *** P < 0.001 compared with the corresponding ZH11 using Student’s t-test. The callus induction rate was caculated from the overall induced callus which was used for the whole studies. Table 2.
Number of samples and survival rate percentage at each transformation step with the pCAMBIA1300-GSN1-FLAG (GSN1-OX) plasmid in six rice cultivars.
Figures
(6)
Tables
(2)