-
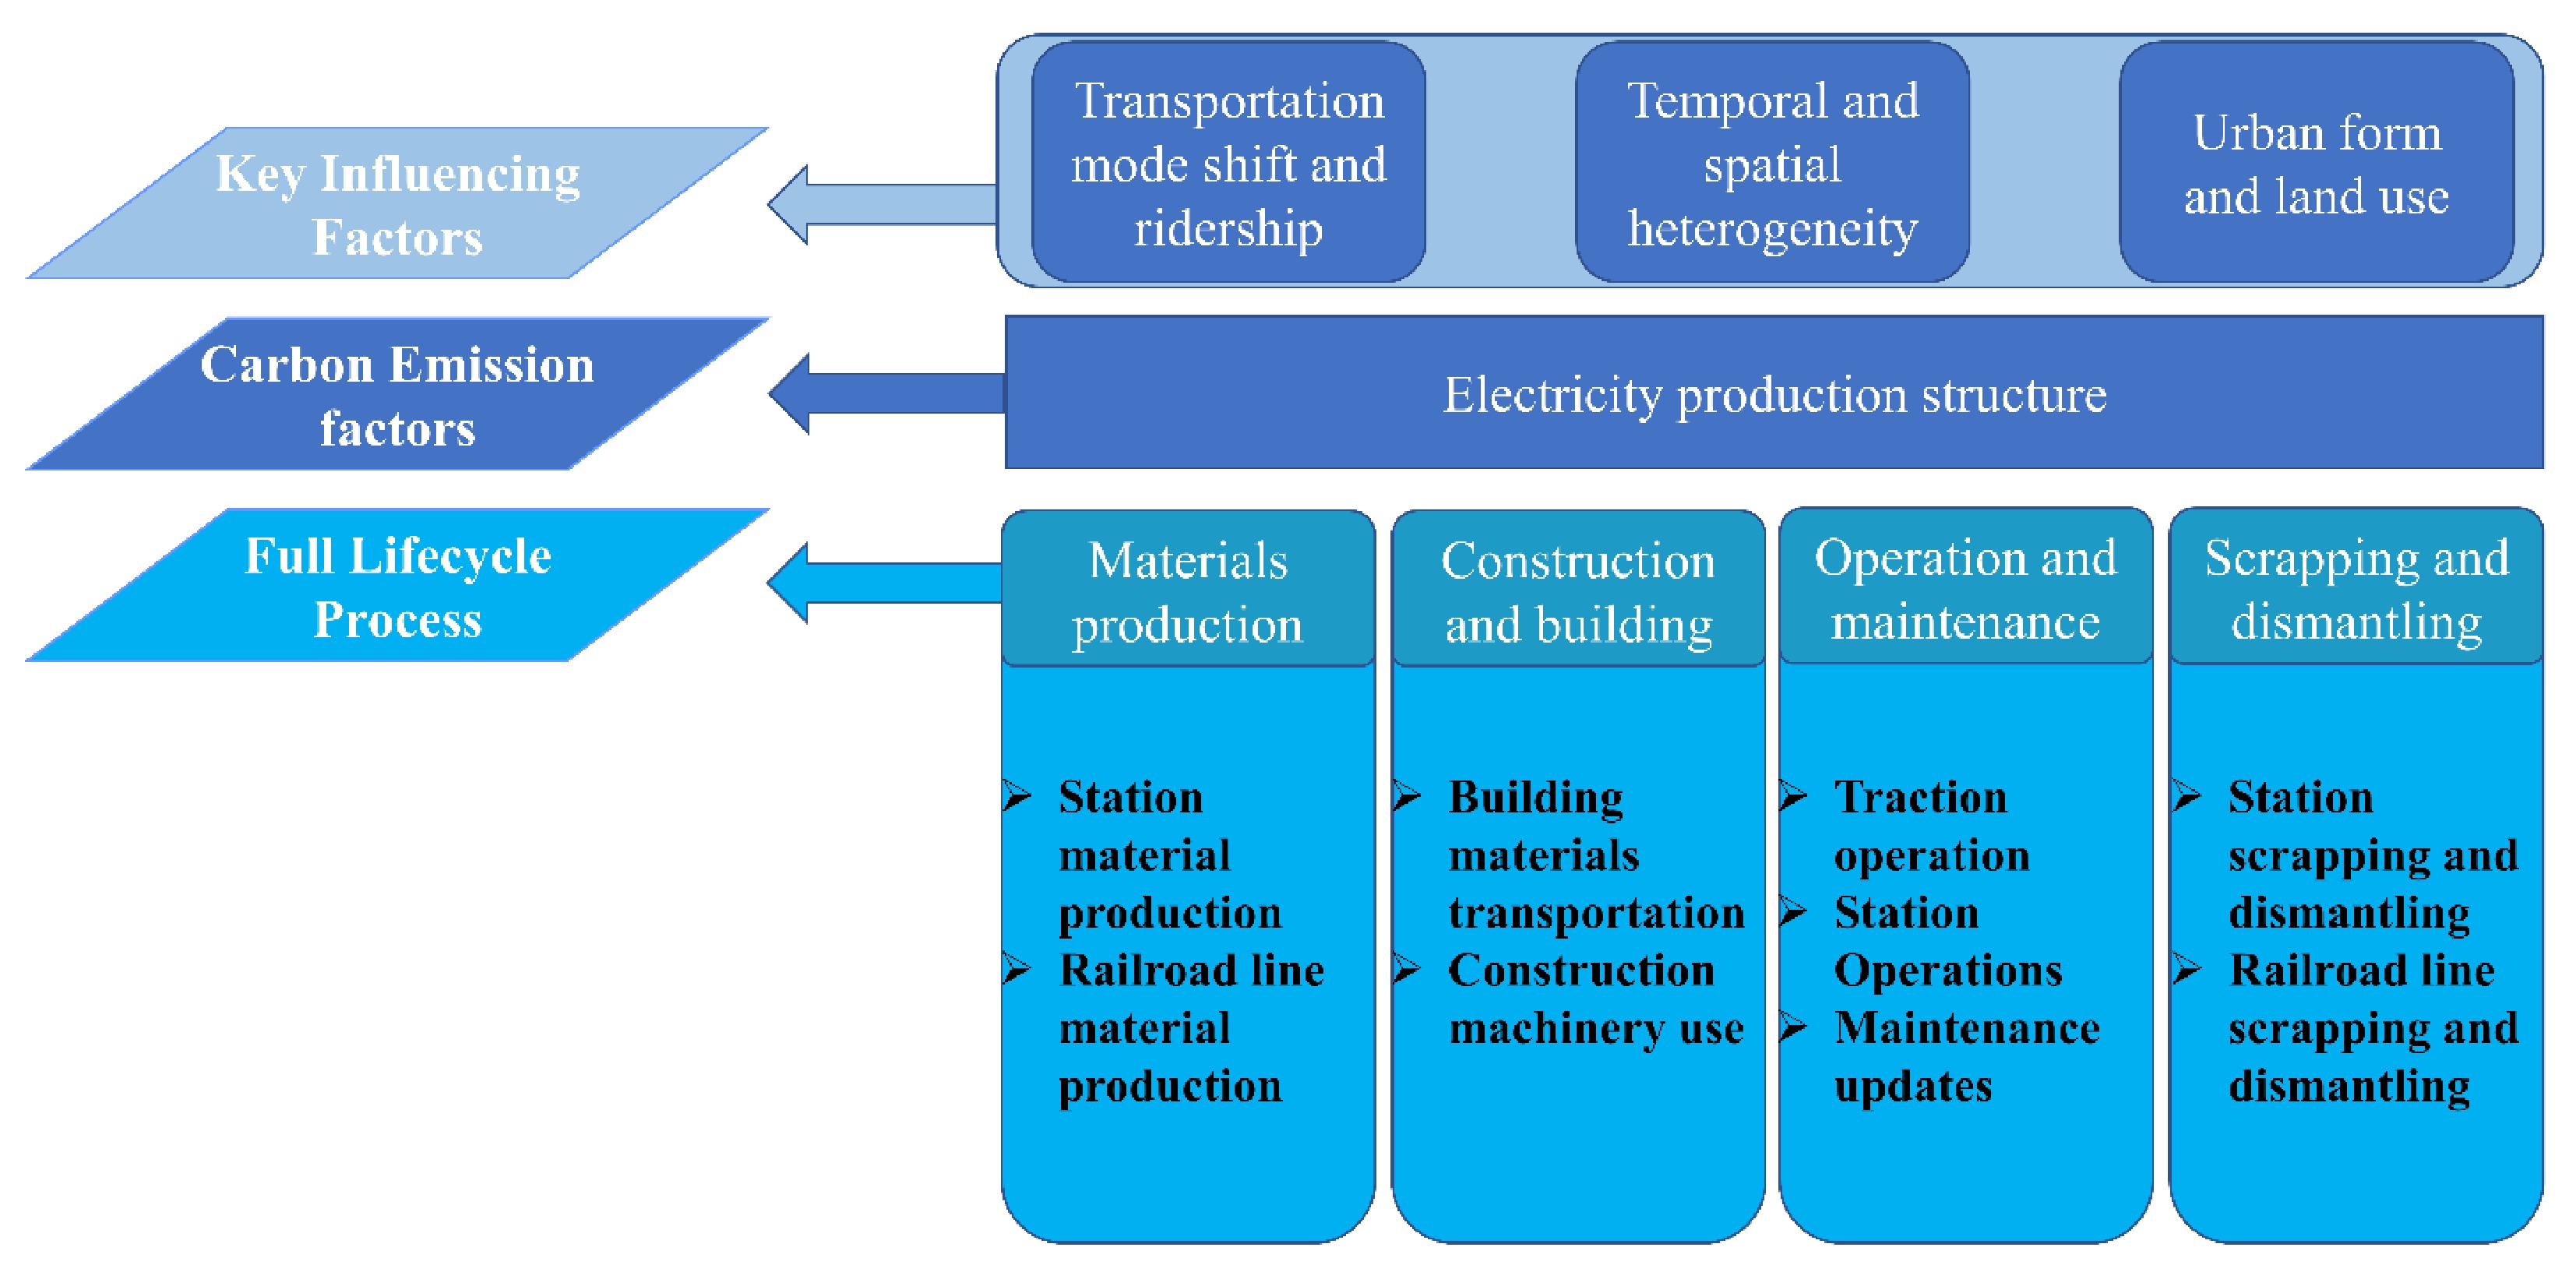
Figure 1.
Key elements of the net GHG impact of urban rail transit systems.
-
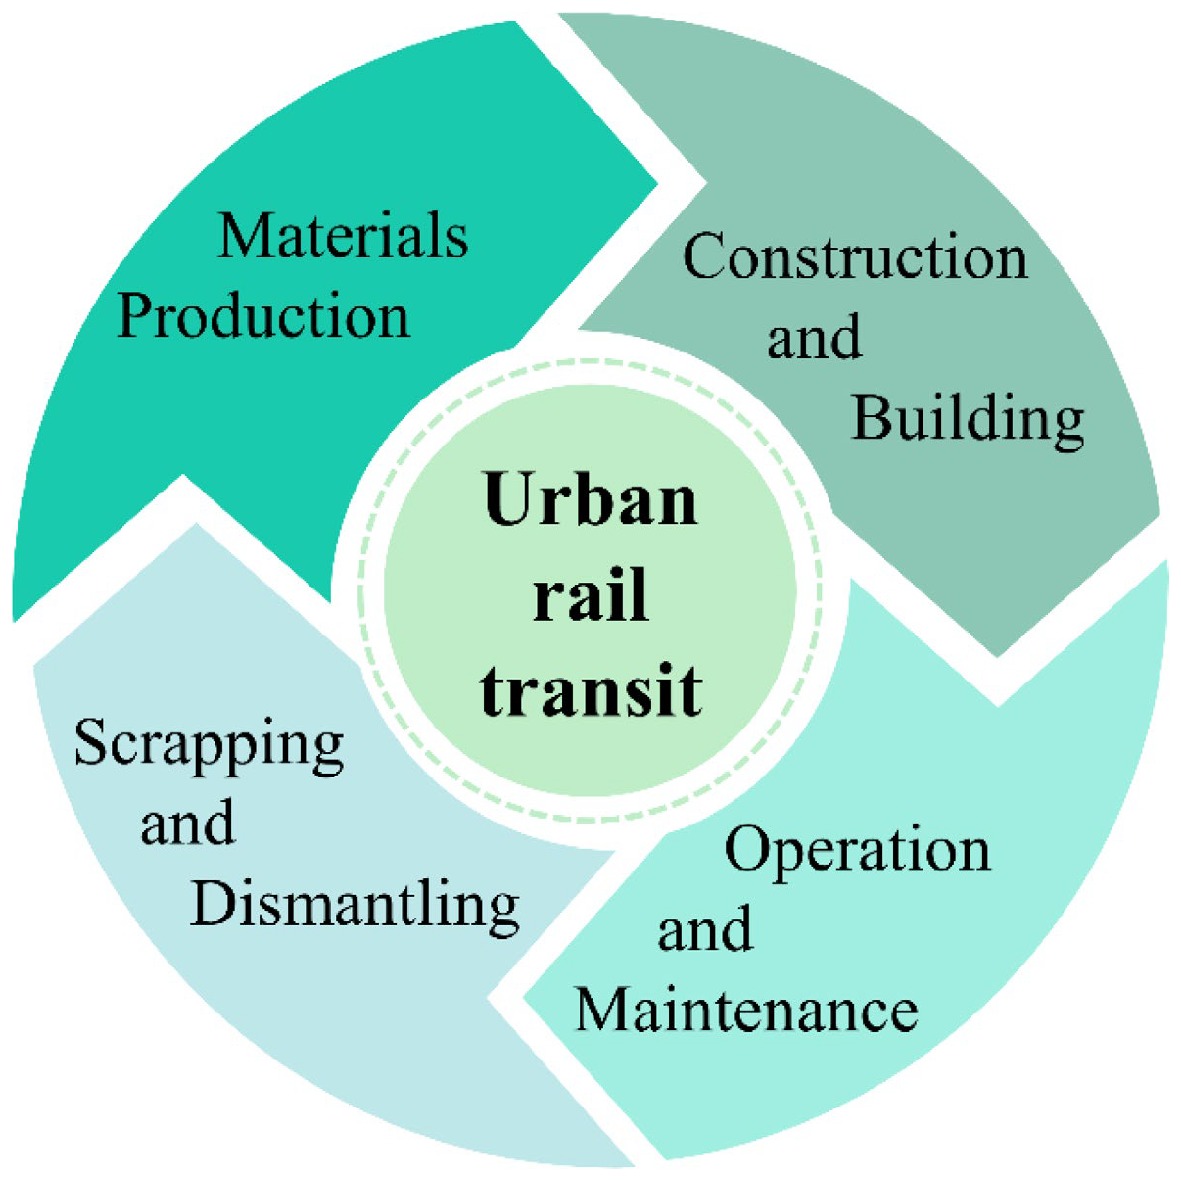
Figure 2.
Urban rail transit life cycle process.
-
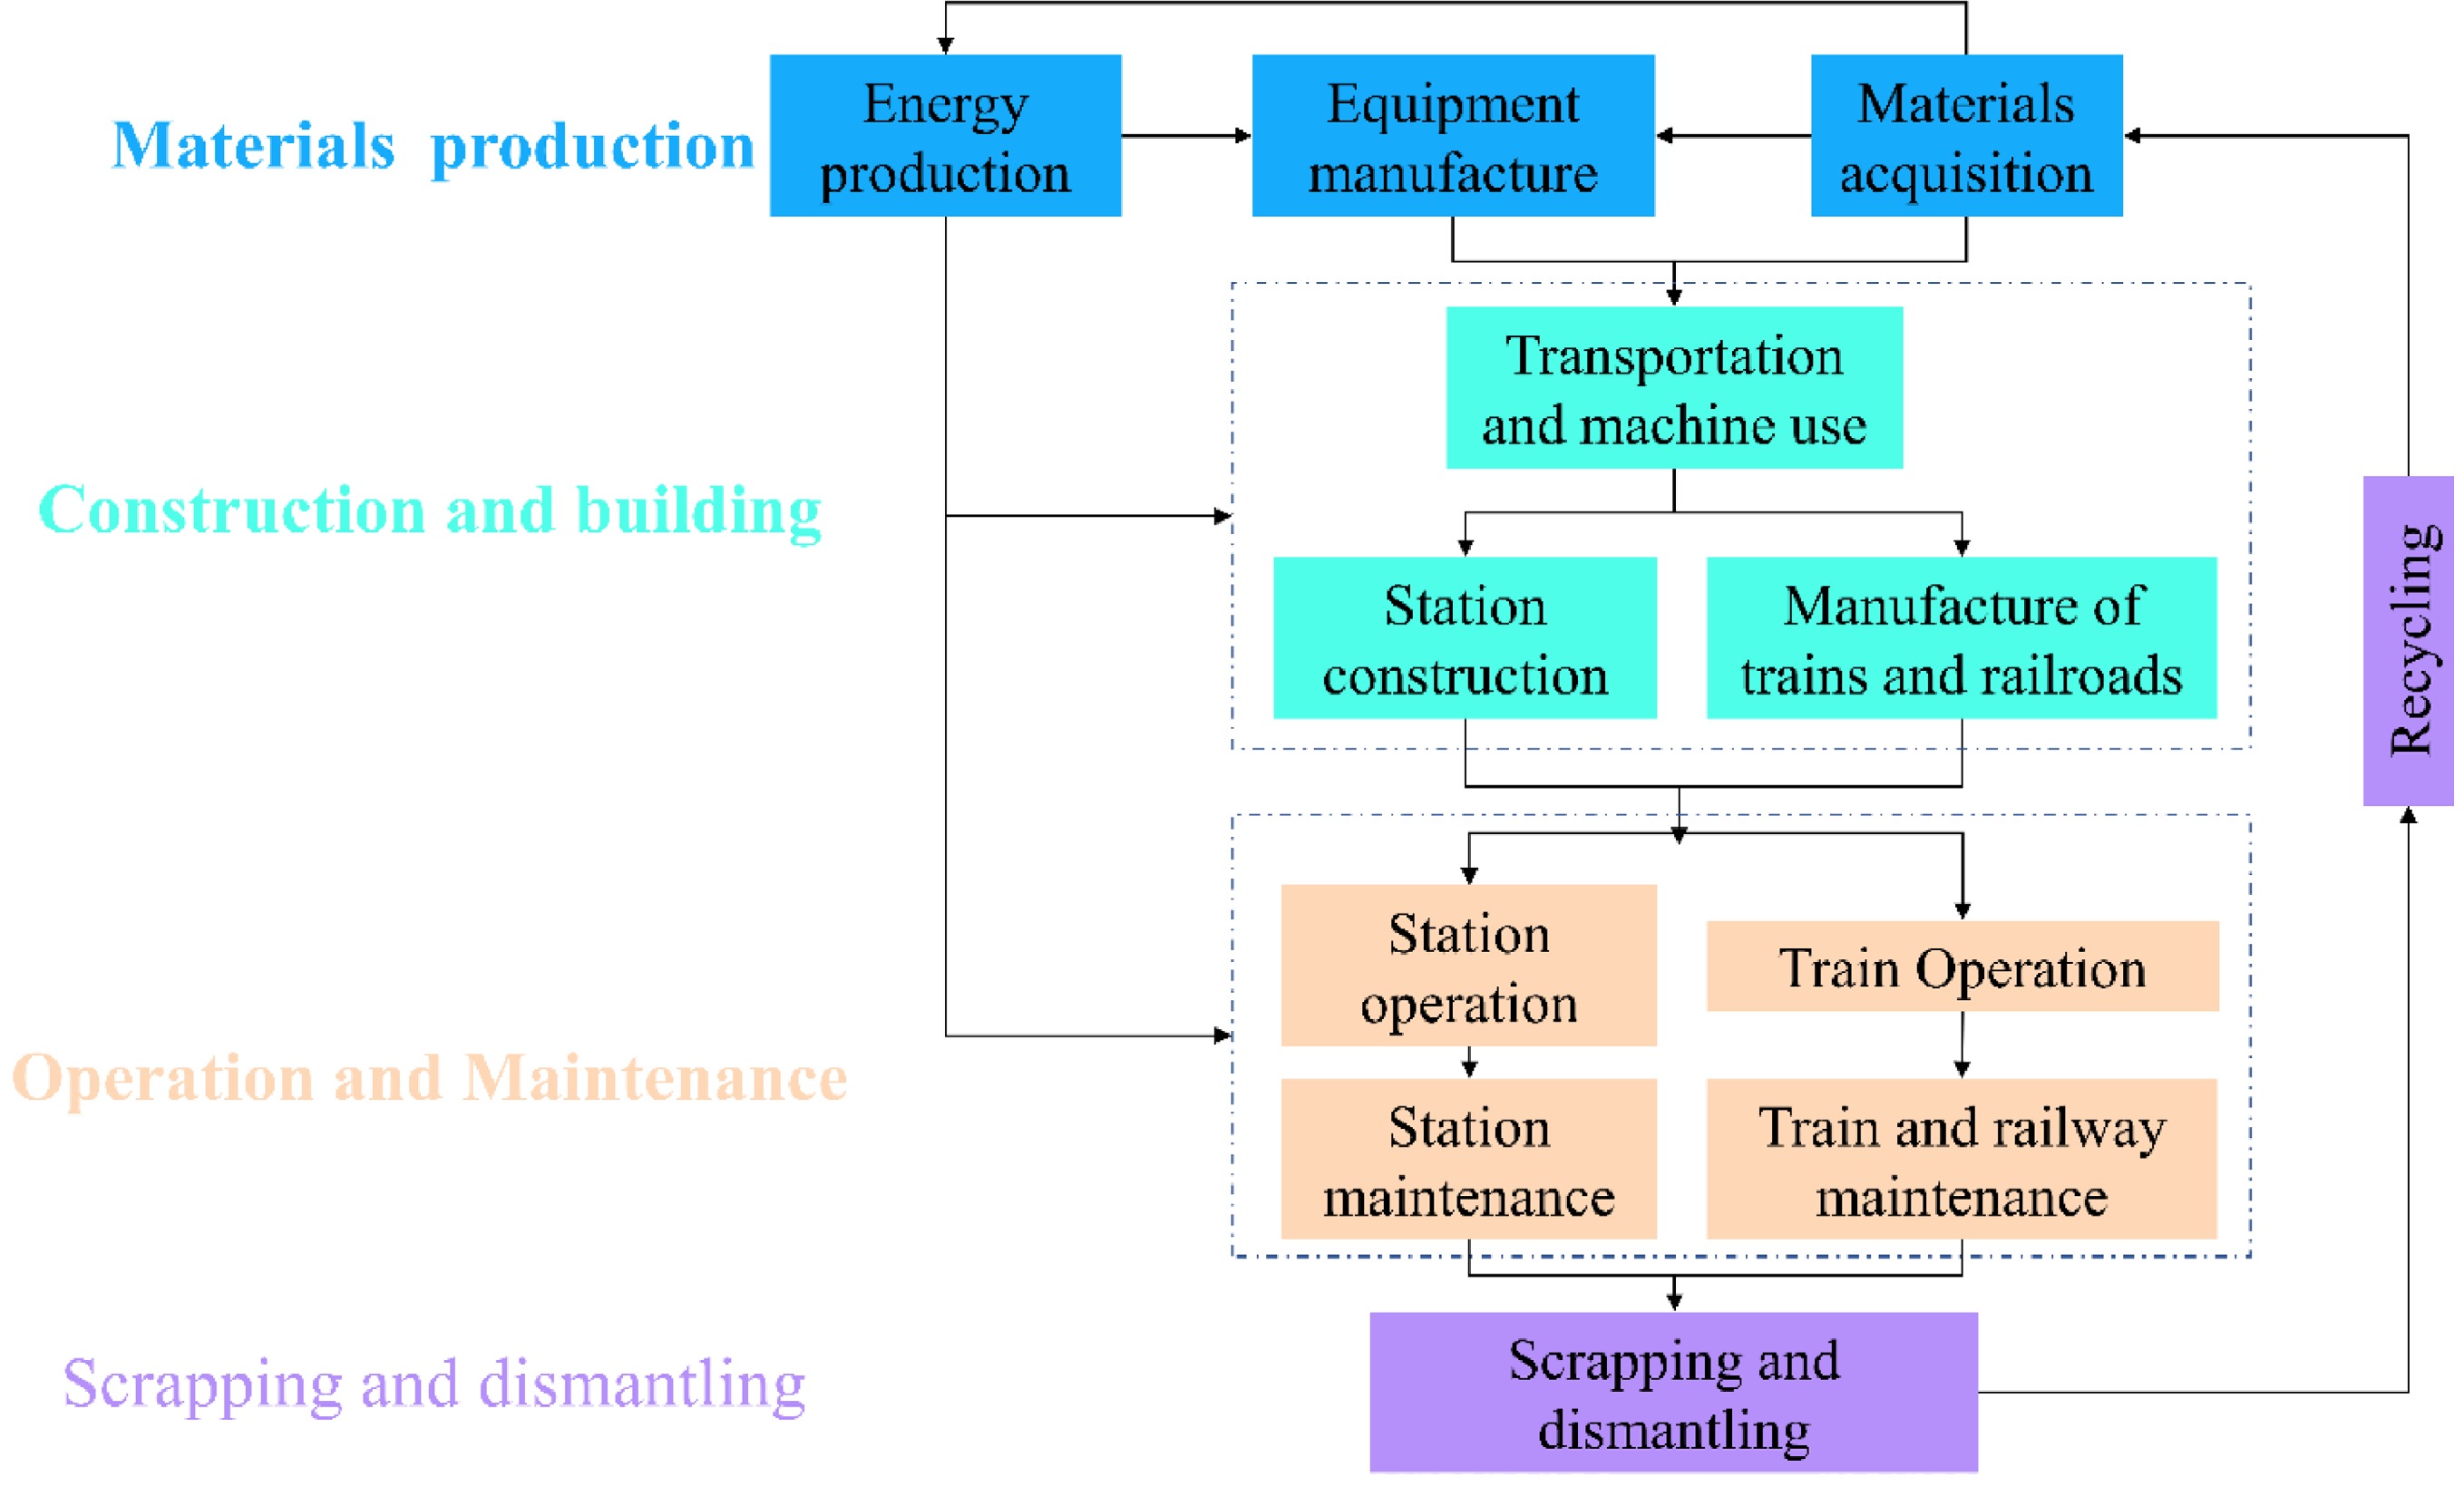
Figure 3.
Research boundary of life cycle carbon emission measurement for urban rail transit.
-
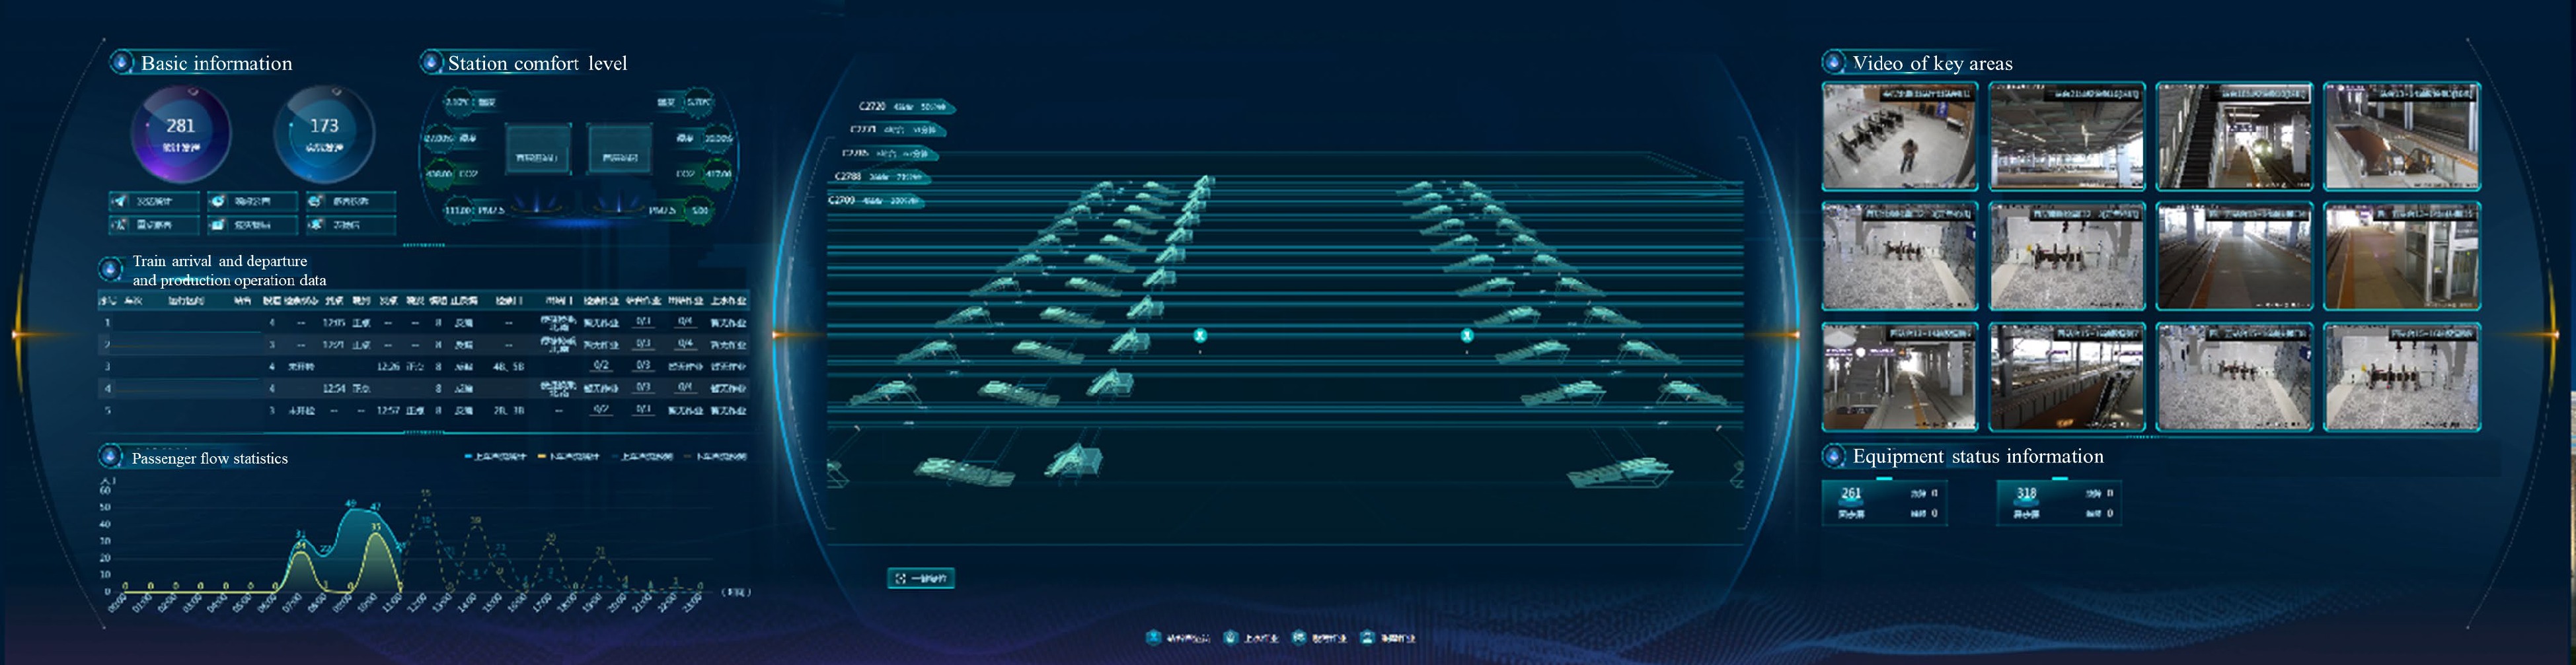
Figure 4.
Case station intelligent control platform display interface.
-
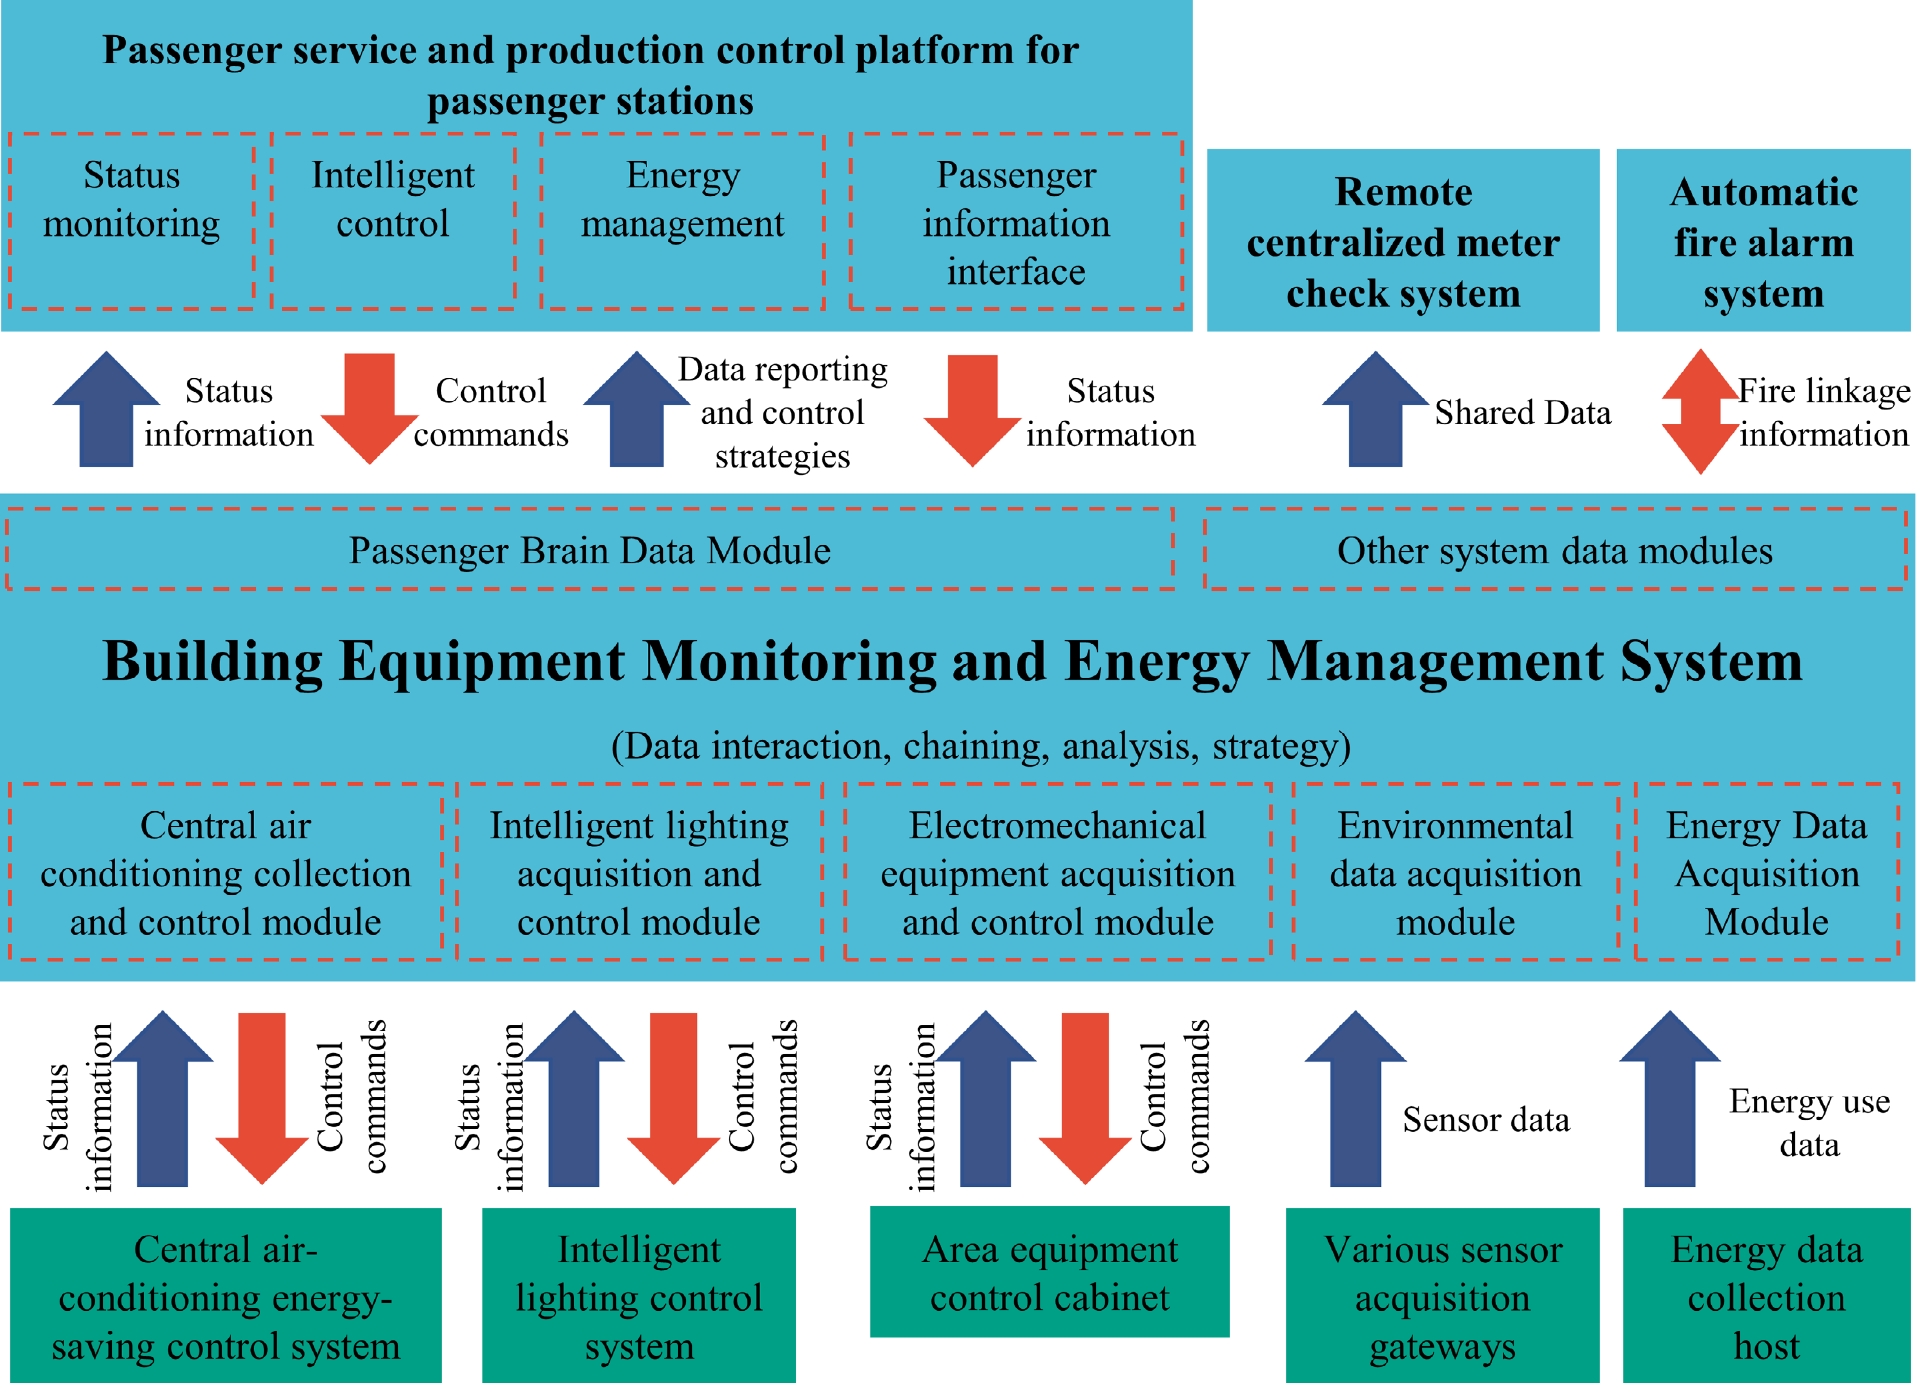
Figure 5.
Architecture of building equipment monitoring and energy management system of the case station.
-
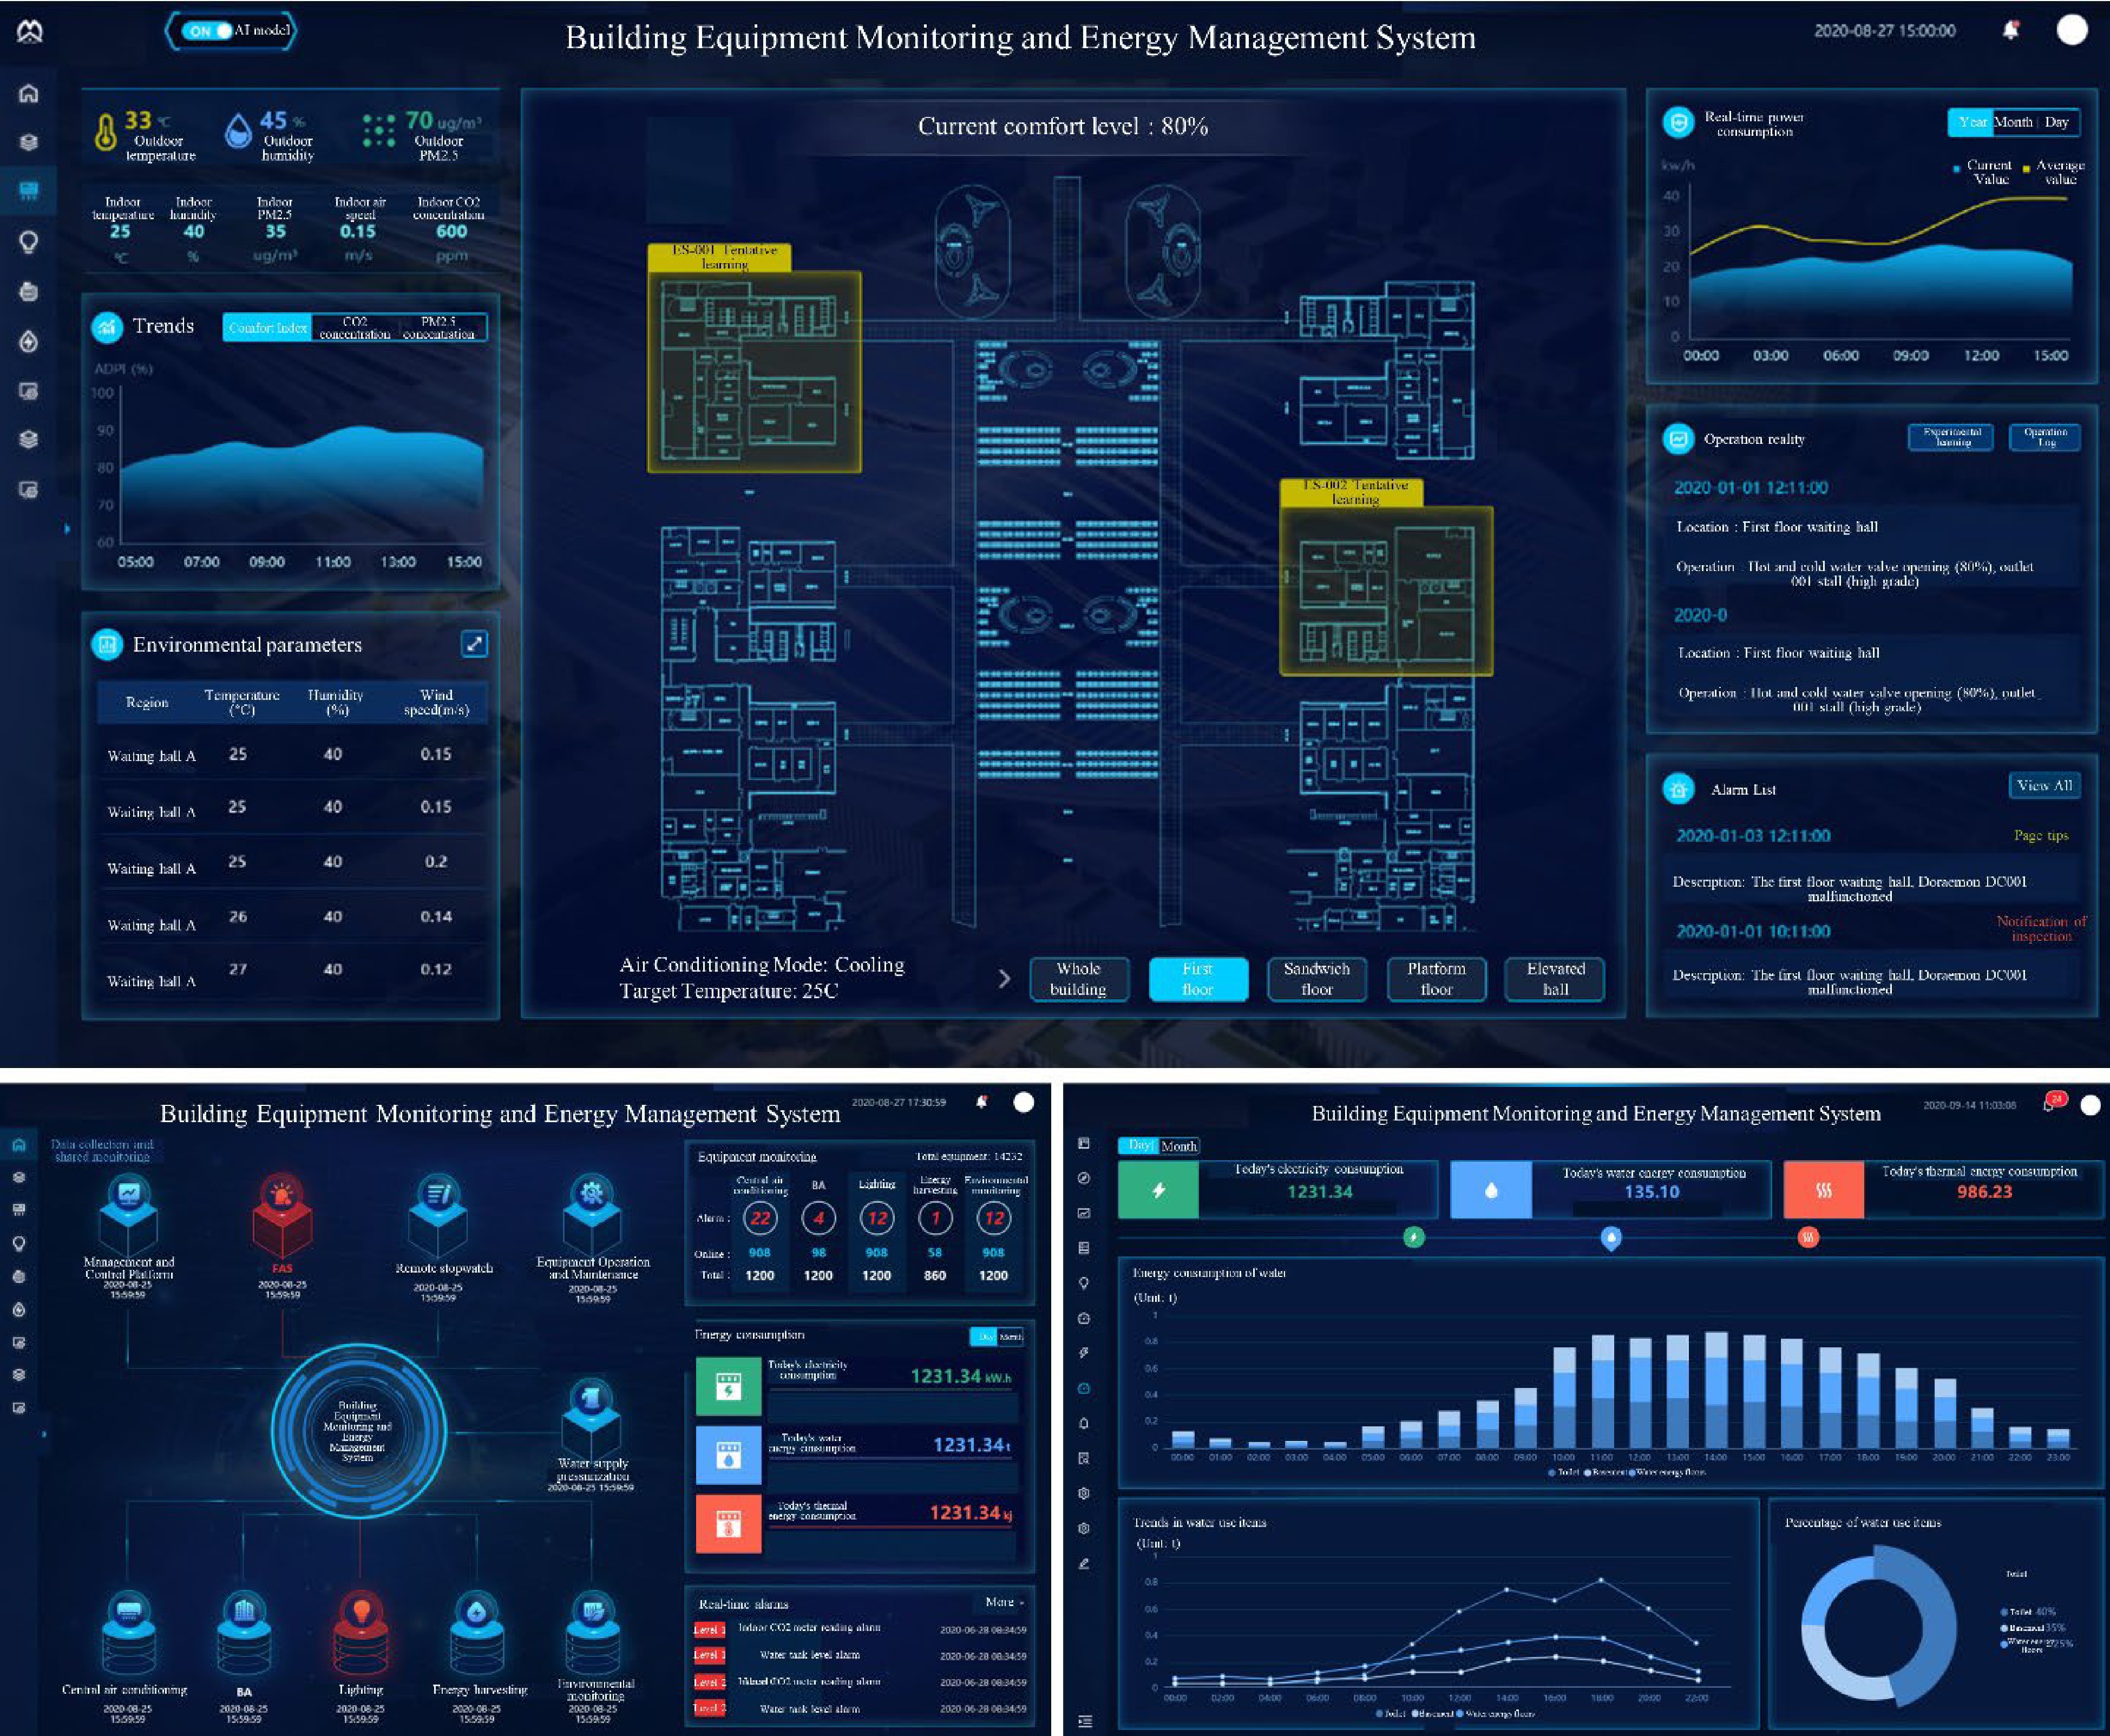
Figure 6.
Interface of building equipment monitoring and energy management system of the case station.
-
Continent Country/region Metro mileage (km) Light rail mileage (km) Tram (km) Total (km) Asia China 8206.48 422.51 563.63 9192.62 Europe Germany 403.10 − 3537.49 3940.59 North America The United States 1384.10 1316.01 353.32 3053.43 Europe Russia 640.20 58.70 1369.20 2068.10 Europe Ukraine 114.06 21.00 1209.60 1344.66 Europe France 362.30 18.40 861.10 1241.80 Asia Japan 791.20 108.80 220.45 1120.45 Europe Poland 35.50 20.10 970.00 1025.60 Europe Spain 510.00 146.12 340.79 996.91 Asia Korea 837.44 88.31 − 925.75 Europe The United Kingdom 450.50 99.50 229.60 779.60 Asia India 709.49 − 28.00 737.49 Europe Italy 221.70 27.70 361.30 610.70 Table 1.
Total length of urban rail transit operation lines around the world in 2021.
-
Country/
regionCity Type of urban
rail transitResearch
boundarySummary Reference China Beijing Comprehensive Operation and maintenance No carbon emission by default for power generation methods other than thermal power [88] China Hefei Metro LCA The digital twin system was introduced to assist in LCA; there are limitations in data interoperability between different models of the system [97] India Delhi Metro Operation and maintenance The impact of transport mode shift due to the introduction of the metro on carbon emission is considered [95] China Baoji Comprehensive Operation and maintenance Developed a passenger demand-based carbon emission model [100] Austria Vienna Metro LCA Ignoring carbon emission from maintenance, dismantling, and recycling phases [32] Brazil Rio de Janeiro Metro LCA The GHG emissions compensation period of the urban rail transit system was analyzed [78] United States Los Angeles Light Rail LCA Two different LCA frameworks are used [60] United States Phoenix Light Rail LCA Developed an integrated transportation and land use LCA framework [79] China Beijing Metro Construction and building A quota-based GHG emissions quantification model for metro station construction is proposed [62] Canada Toronto Streetcar Operation and maintenance Study of GHG emissions from the construction and reconstruction of the Spadina streetcar route [68] United Kingdom London Metro Operation and maintenance Analyzed the impact of changes in passenger travel behavior on GHG emissions from metro [70] United States New Jersey Commuter rail Construction and building Different material inputs were evaluated during the construction of the railroad project [75] Italy Rome Metro LCA The use of data sourced from metro operators reduces the uncertainty of the results [80] Turkey Kayseri Light Rail LCA Integrating environmental, economic, and social factors with the LCA approach [83] Table 2.
GHG emissions measurement model of urban rail transit in literature.
Figures
(6)
Tables
(2)