-

Figure 1.
Representative resources of four tea populations.
-
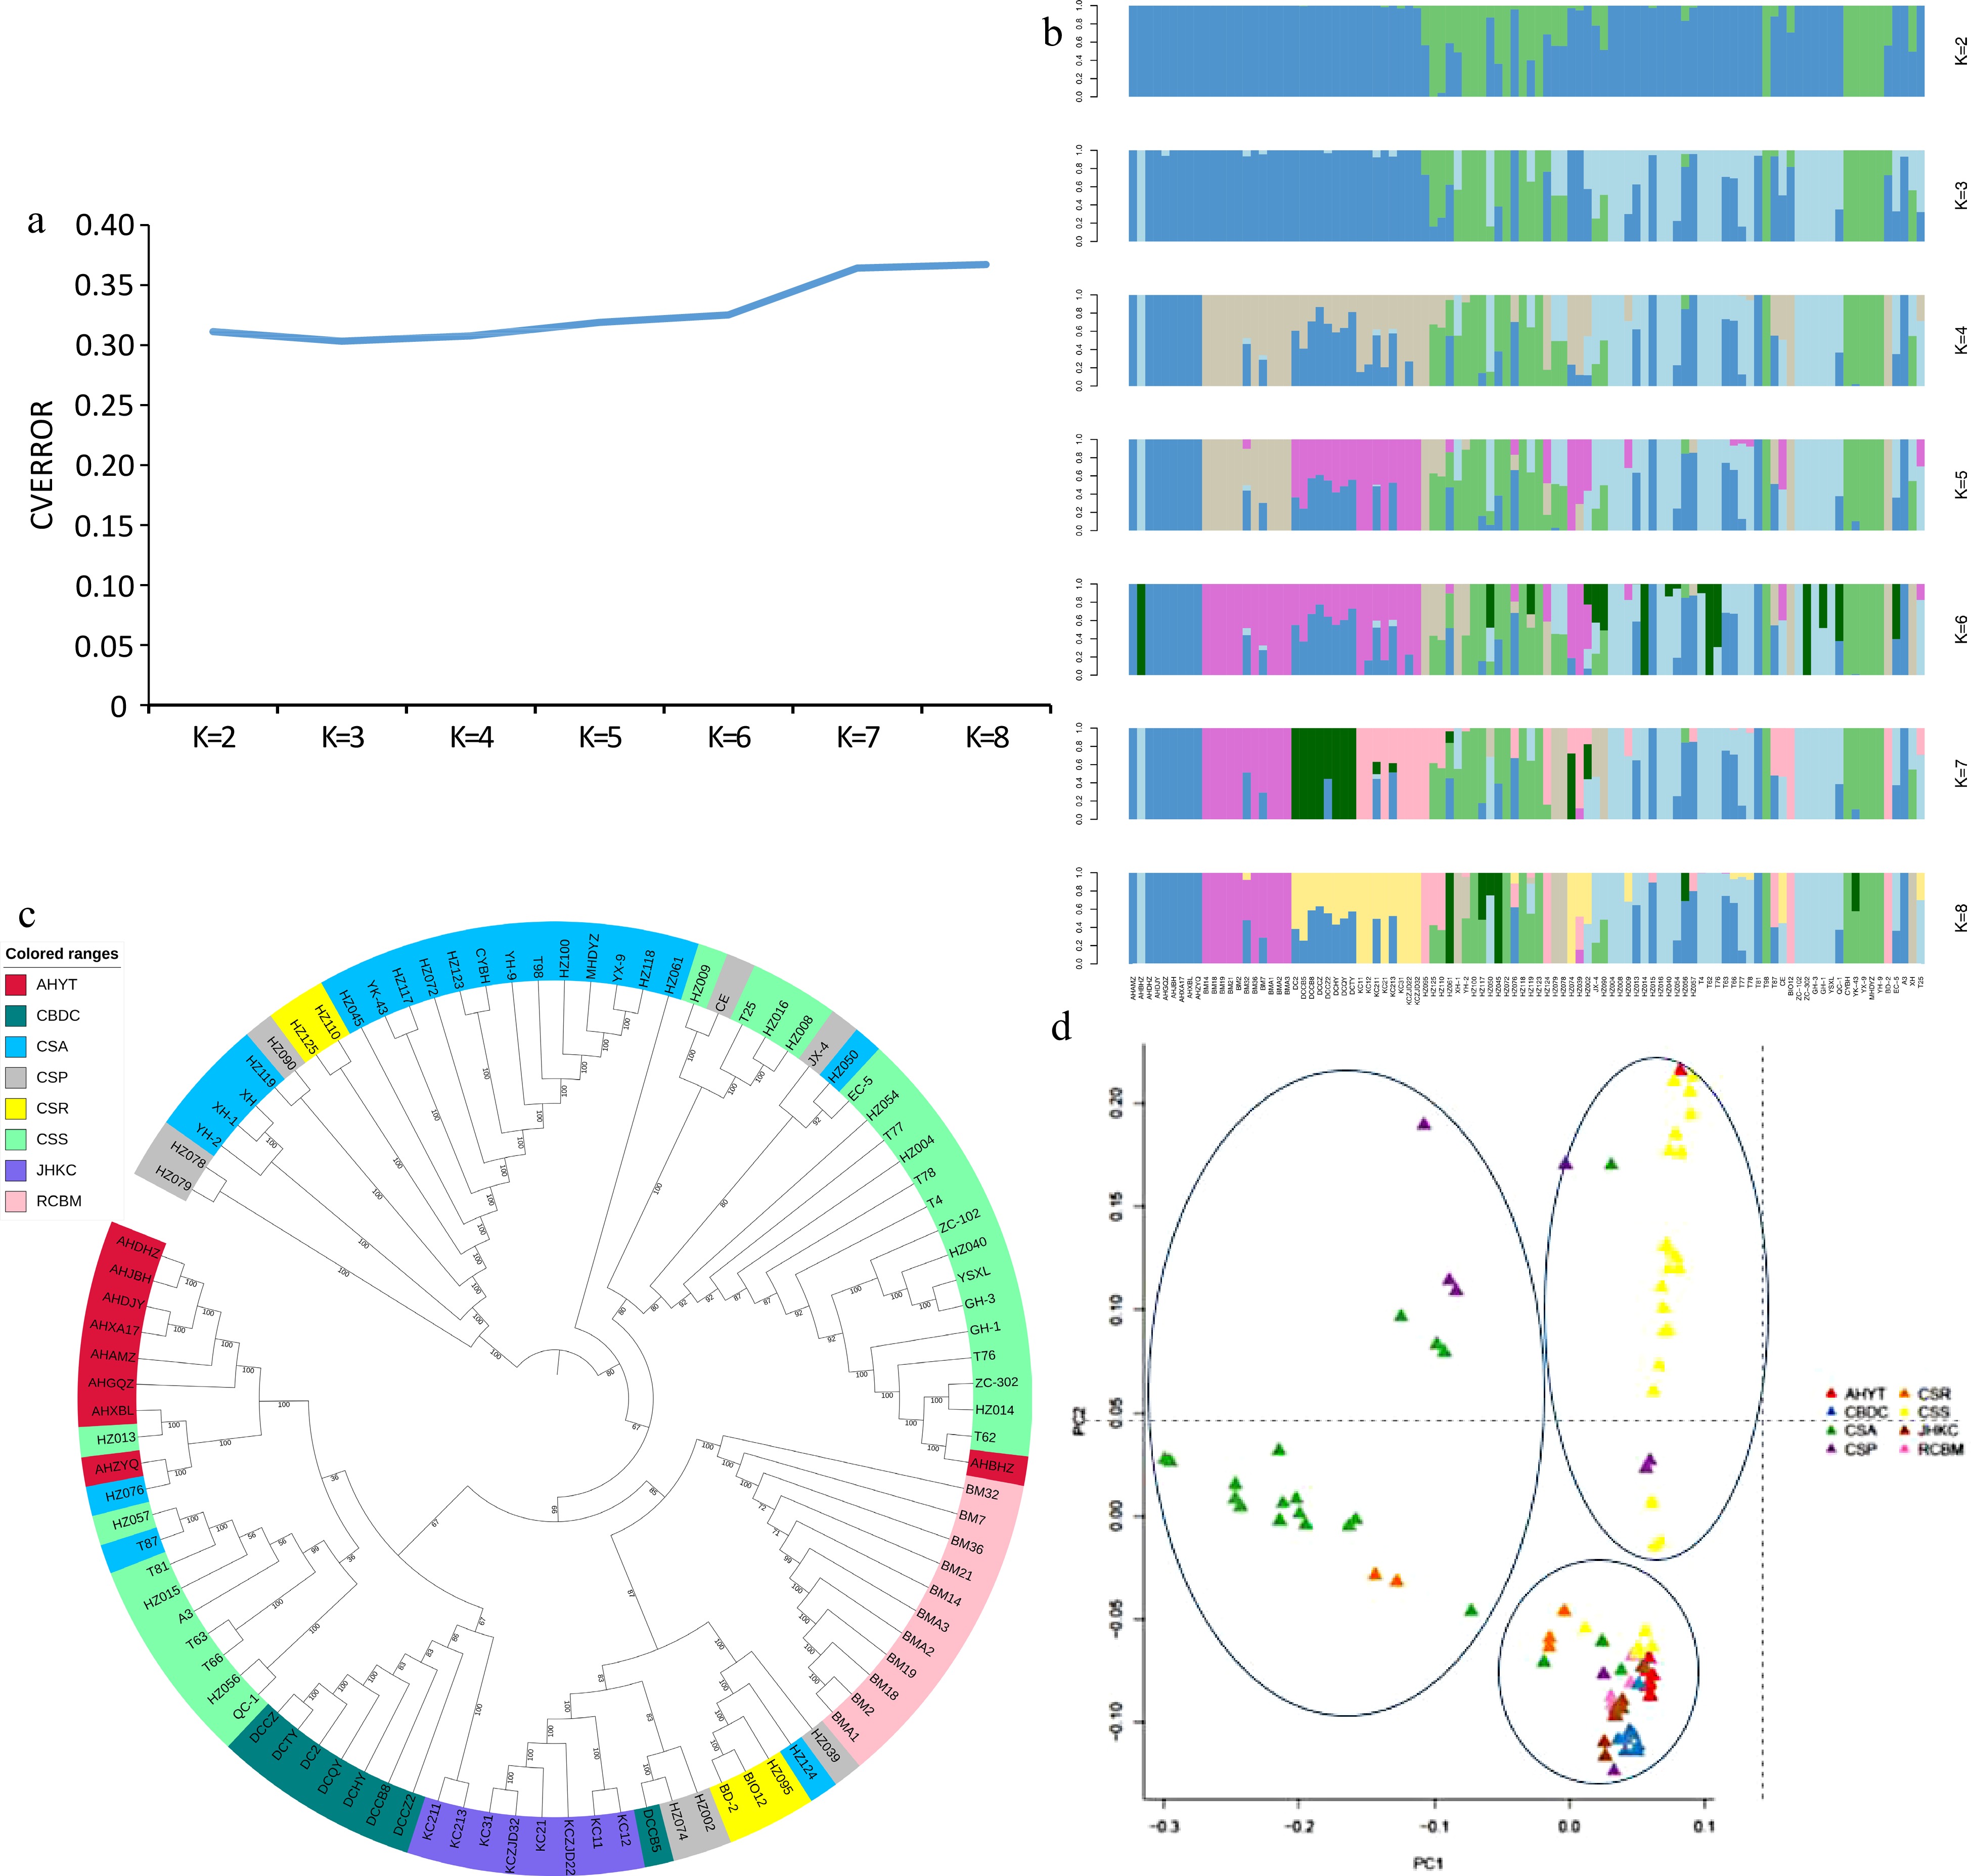
Figure 2.
(a) Cross-validation error results of different K values. (b) Population genetic structure of 98 accessions. The length of each colored segment represents the proportion of the individual genome inferred from ancestral populations (K = 2−8). (c) NJ tree of the 98 tea accessions. (d) PCA plot of the 98 tea accessions.
-

Figure 3.
Genetic diversity and divergence of four tea populations. (a) θπ and FST among four tea populations. (b) LD decay of four tea populations.
-
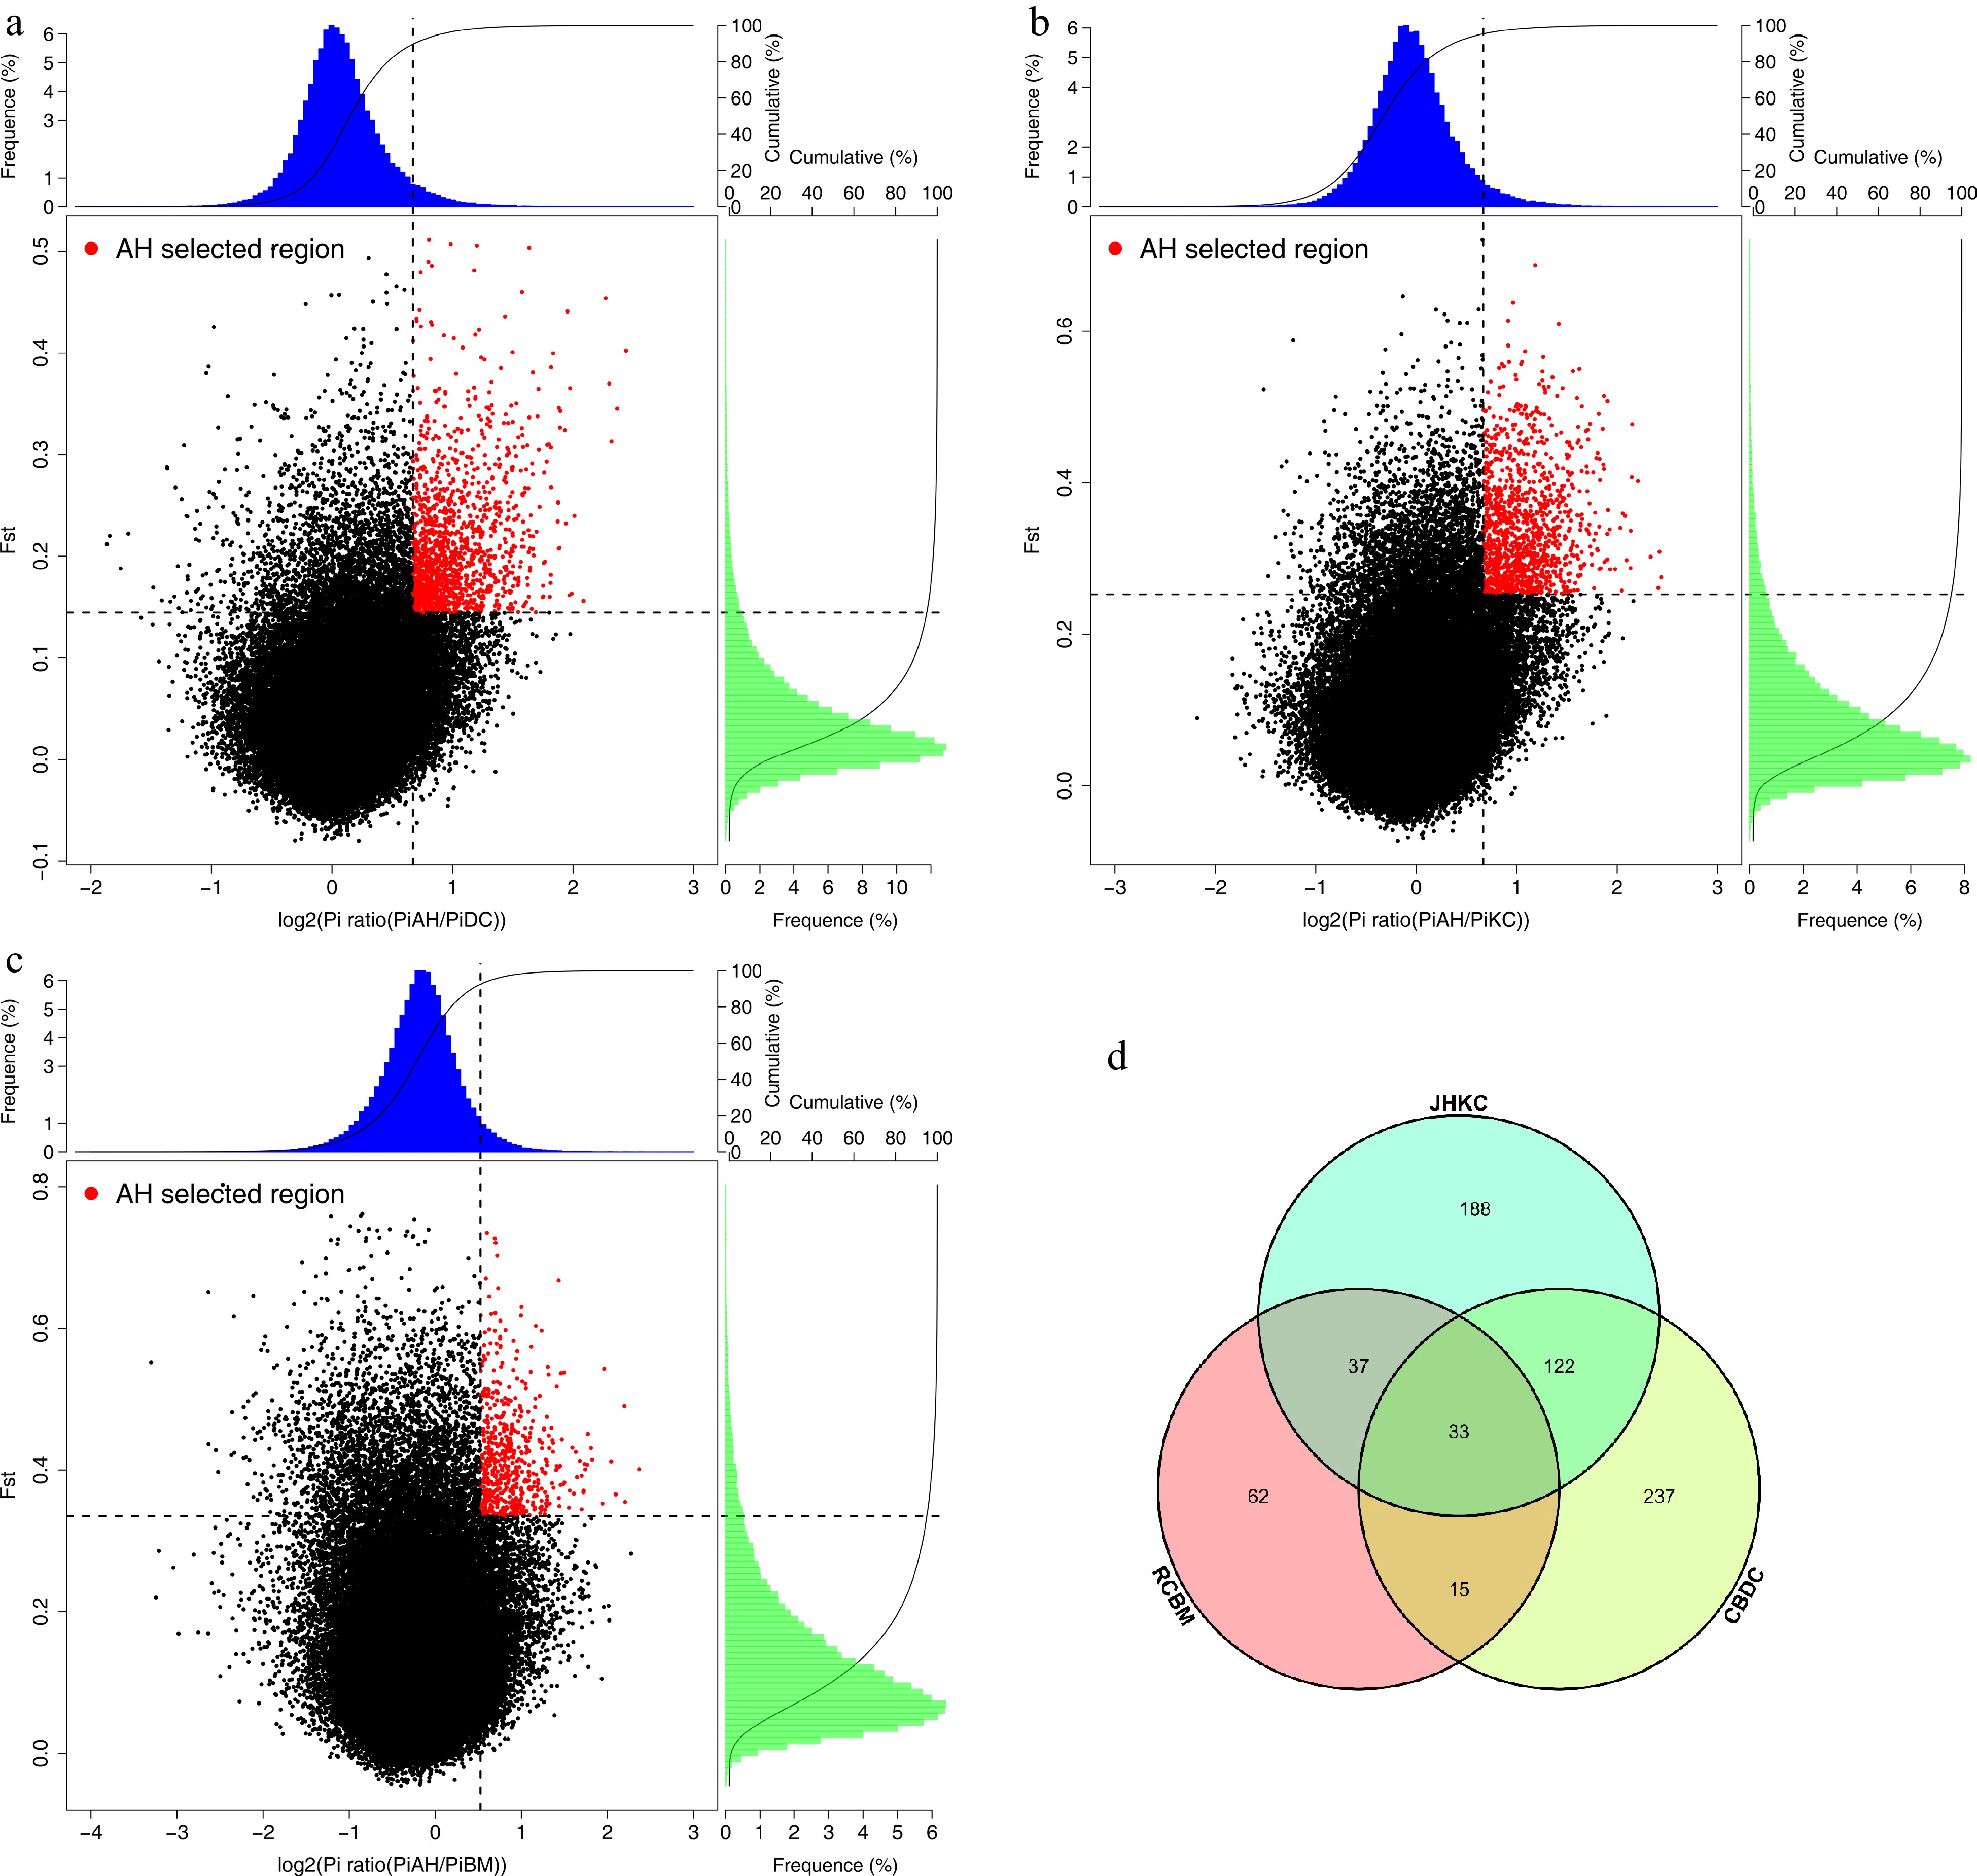
Figure 4.
Selected genes were identified in AHYT. (a) Distribution of Log2(θπ AHYT/θπ CBDC) and Z(FST) calculated values. (b) Distribution of Log2(θπ AHYT/θπ JHKC) and Z(FST) calculated values. (c) Distribution of Log2(θπ AHYT/θπ RCBM) and Z(FST) calculated values. The red points are selected genomic regions under 5% value of Z(FST) and Log2(θπ AHYT/θπ control populations). (d) Venn diagram of selected gene numbers.
-
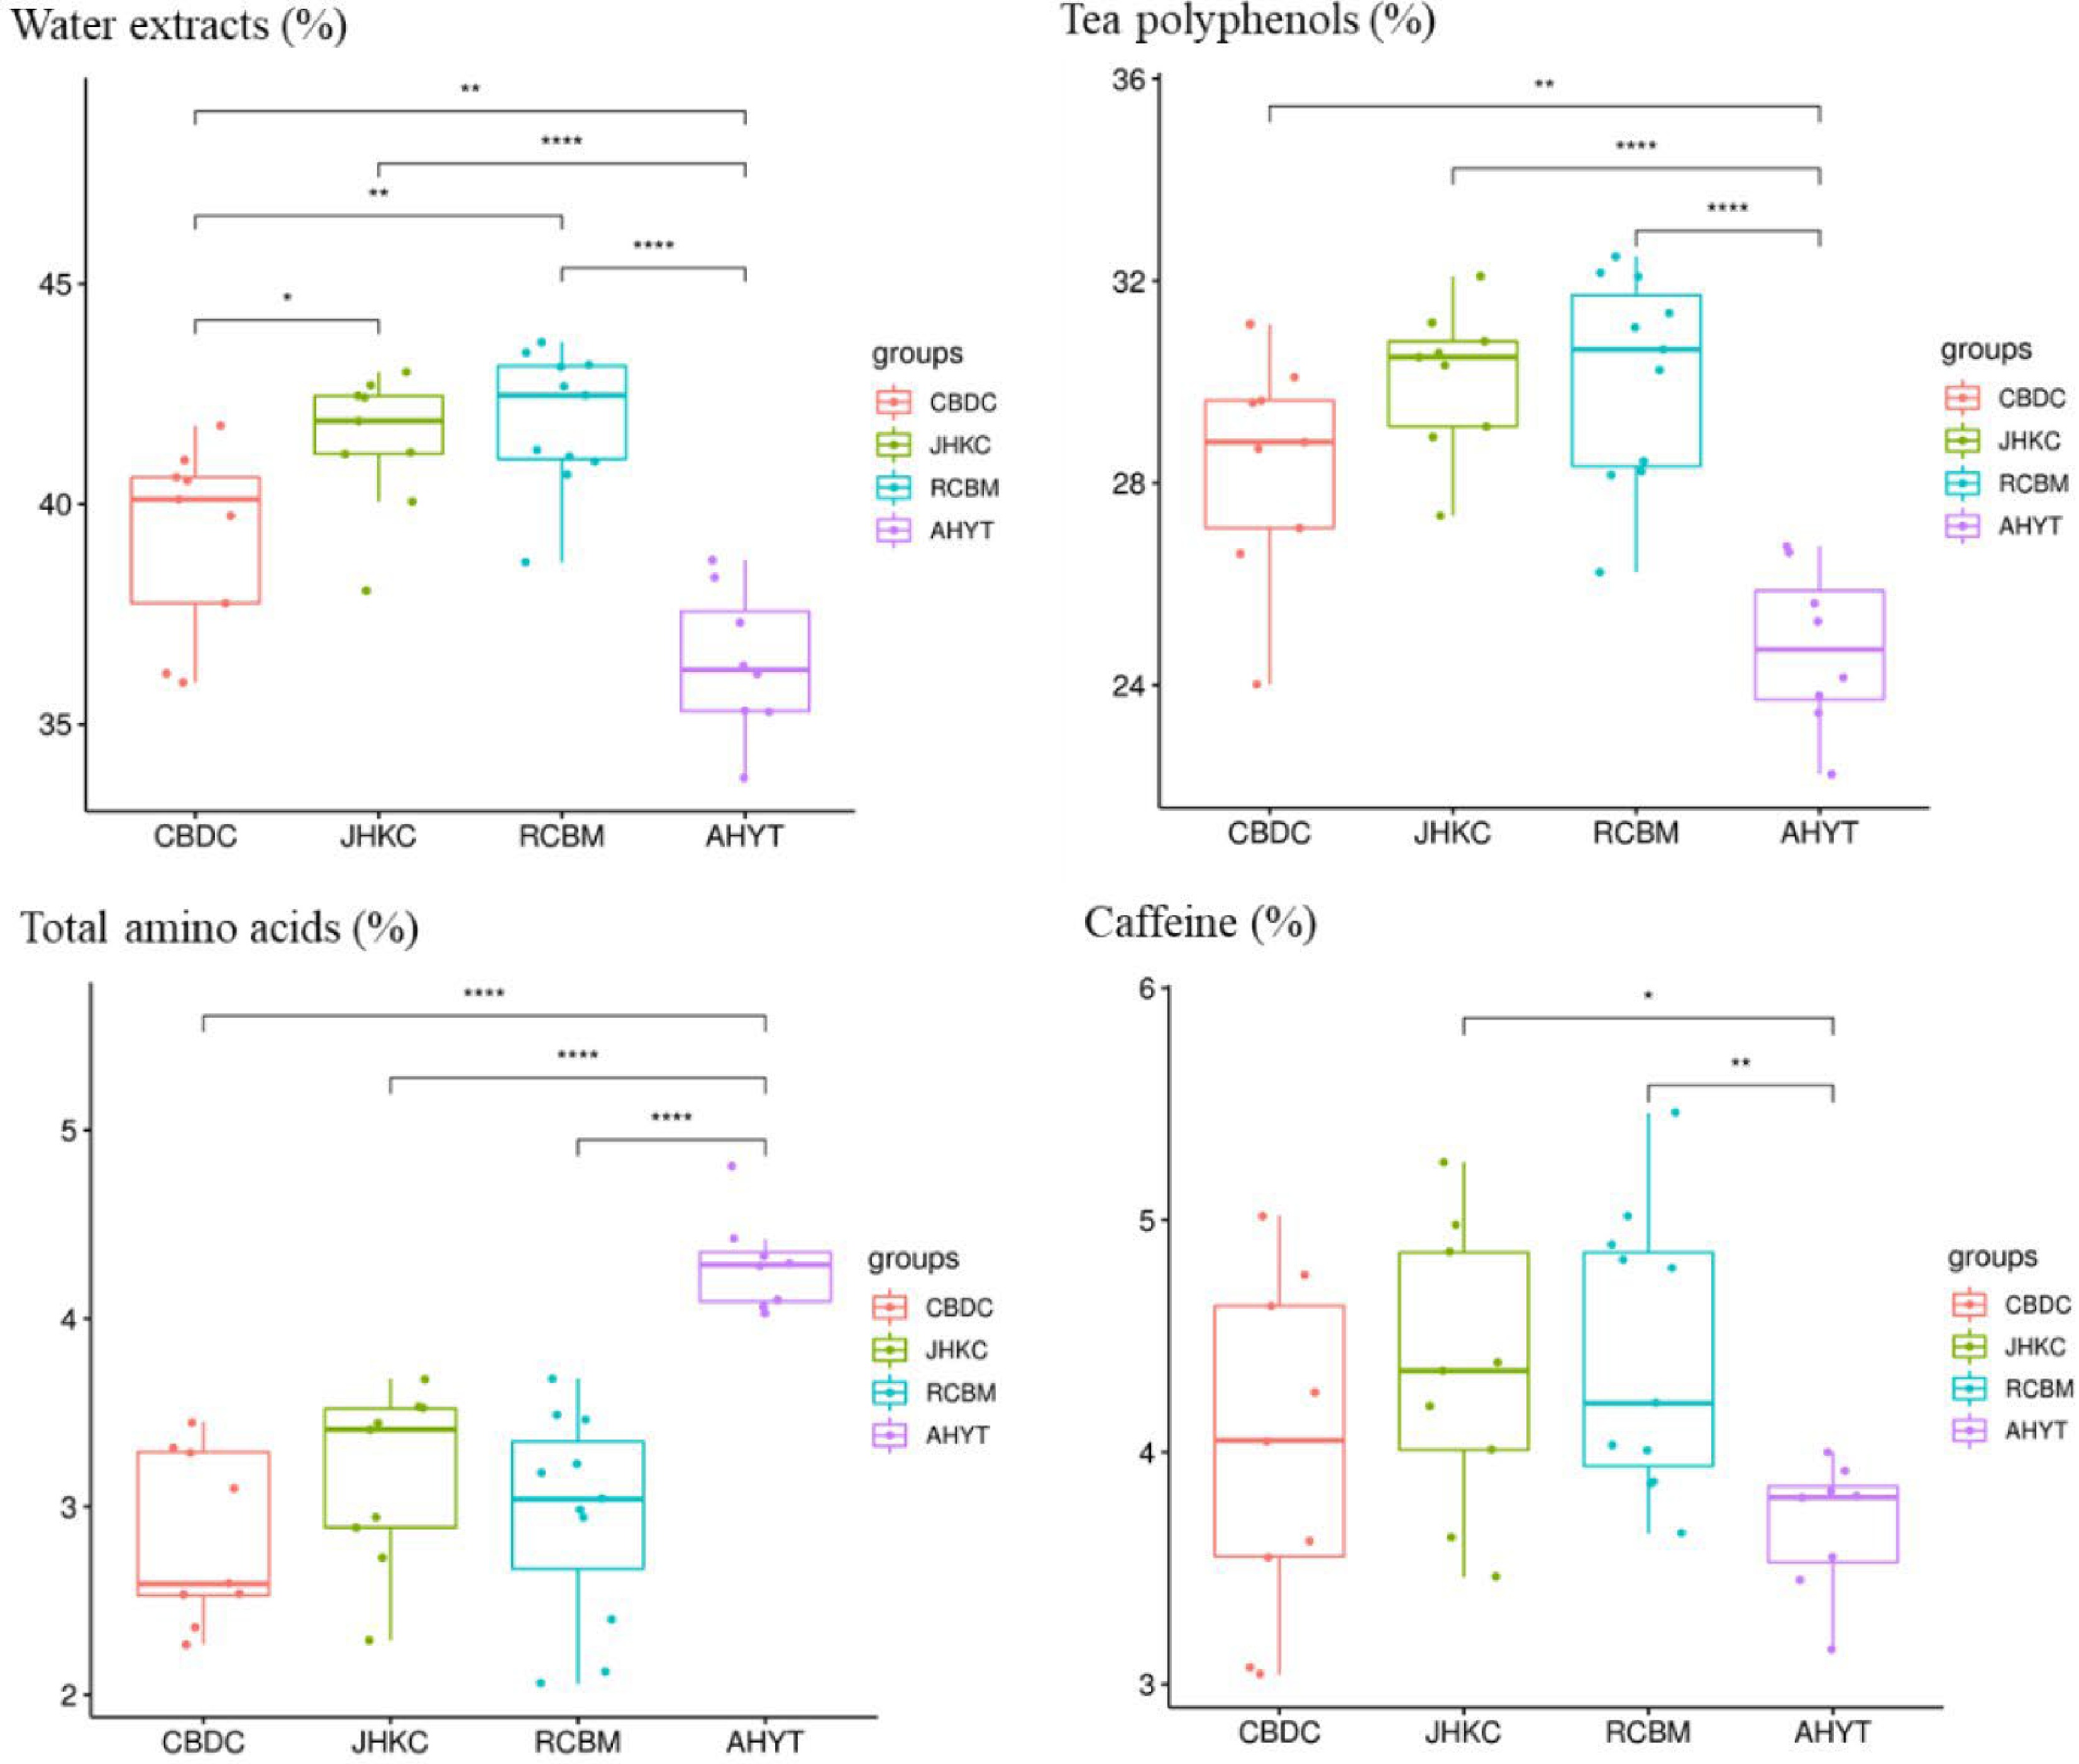
Figure 5.
Biochemical composition of four tea landraces. *, p < 0.05; **, p < 0.01; ***, p < 0.001.
-
Populations Abbreviation Sample
sizeOrigin Plant type Processing
suitabilityPlanting region Chengbu Dongcha CBDC 9 Chengbu County Arbor and semi-arbor Black tea, Green tea Hunan and Guangxi Provinces Jianghua Kucha JHKC 8 Jianghua County Arbor and semi-arbor Black tea Southern Hunan Rucheng Baimaocha RCBM 11 Rucheng County Shrub and semi-arbor Black tea, White tea Guangdong and Hunan Provinces Anhua Yuntai AHYT 8 Anhua County Shrub Black tea, Green tea Throughout China Table 1.
Sampling information of four Hunan tea landrace populations.
-
Sample AHYT RCBM CBDC JHKC Raw bases (bp) 46408354867 41563182791 47080373438 43453617038 Clean bases (bp) 46253486600 41447606318 46953944550 43328803425 Effective rate (%) 99.66 99.72 99.73 99.71 Q20 (%) 96.96 97.16 97.07 96.70 GC content (%) 39.63 40.55 39.48 39.48 Clean_reads 308356577 276317375.5 313026297 291543979.2 Mapped_reads 302704469 265177407 306306291 283301609 Mapping_rate (%) 98.13 96.03 97.83 97.22 Average_depth 14.33 12.56 14.36 13.64 Coverage_4X 76.14% 68.31% 74.33% 72.96% Average SNP(bp) 1327773 1378576 1436020 1403998 Average INDEL(bp) 6561 6777 7212 6766 Table 2.
Summary statistics for whole-genome resequencing.
Figures
(5)
Tables
(2)