-
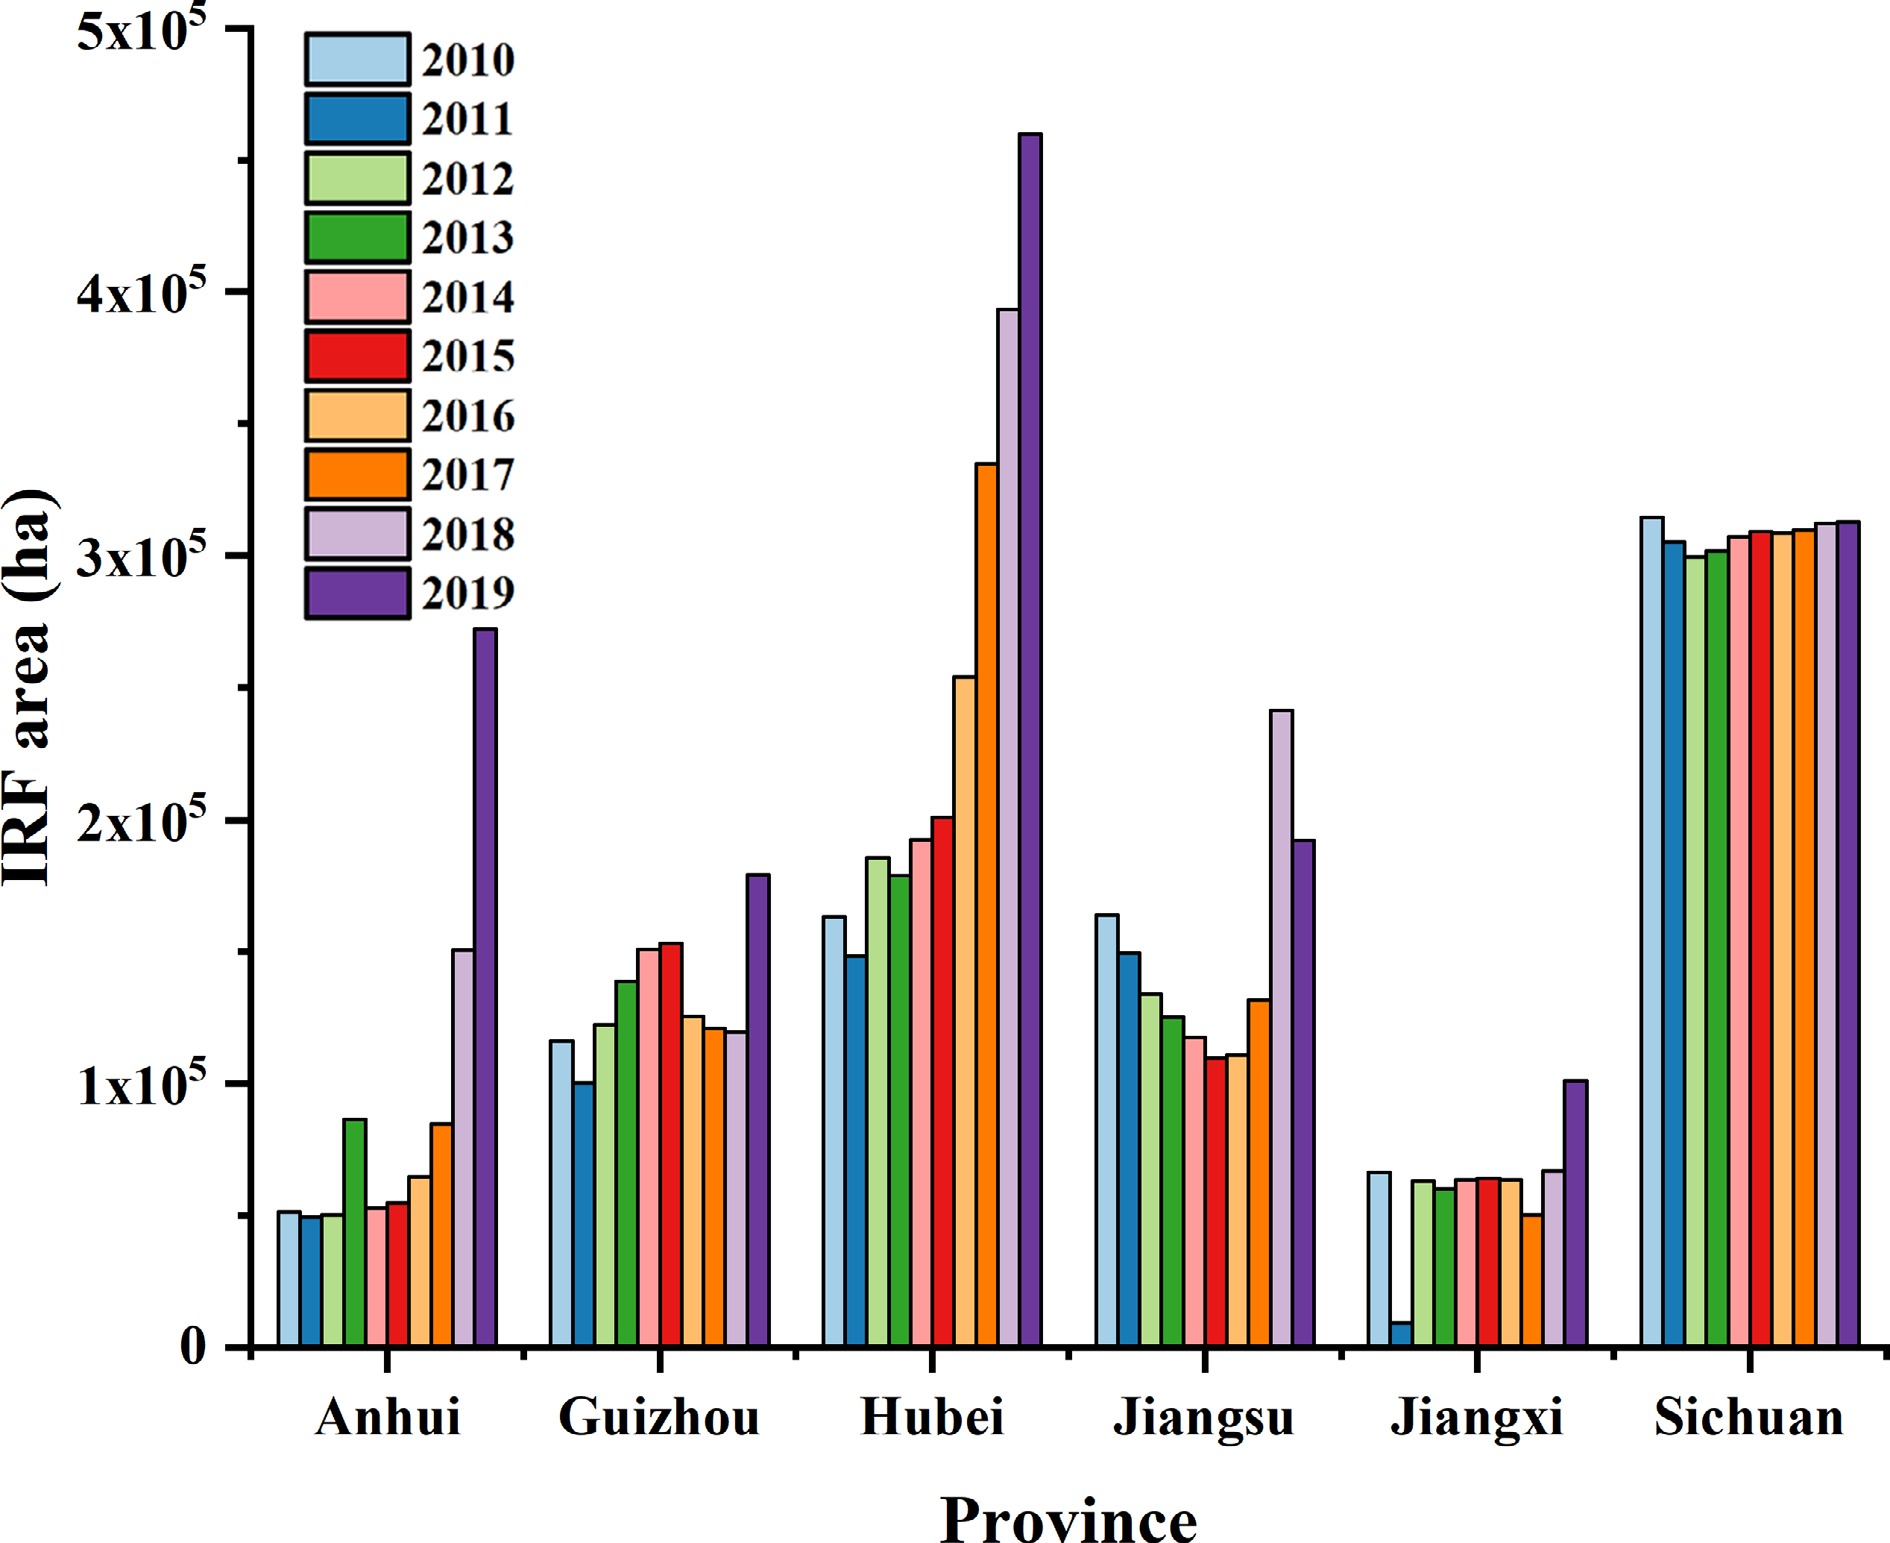
Figure 1.
Development tendency of IRF in eight provinces over the past 10 years (data from the China Fishery Statistical Yearbook (2011−2020)).
-
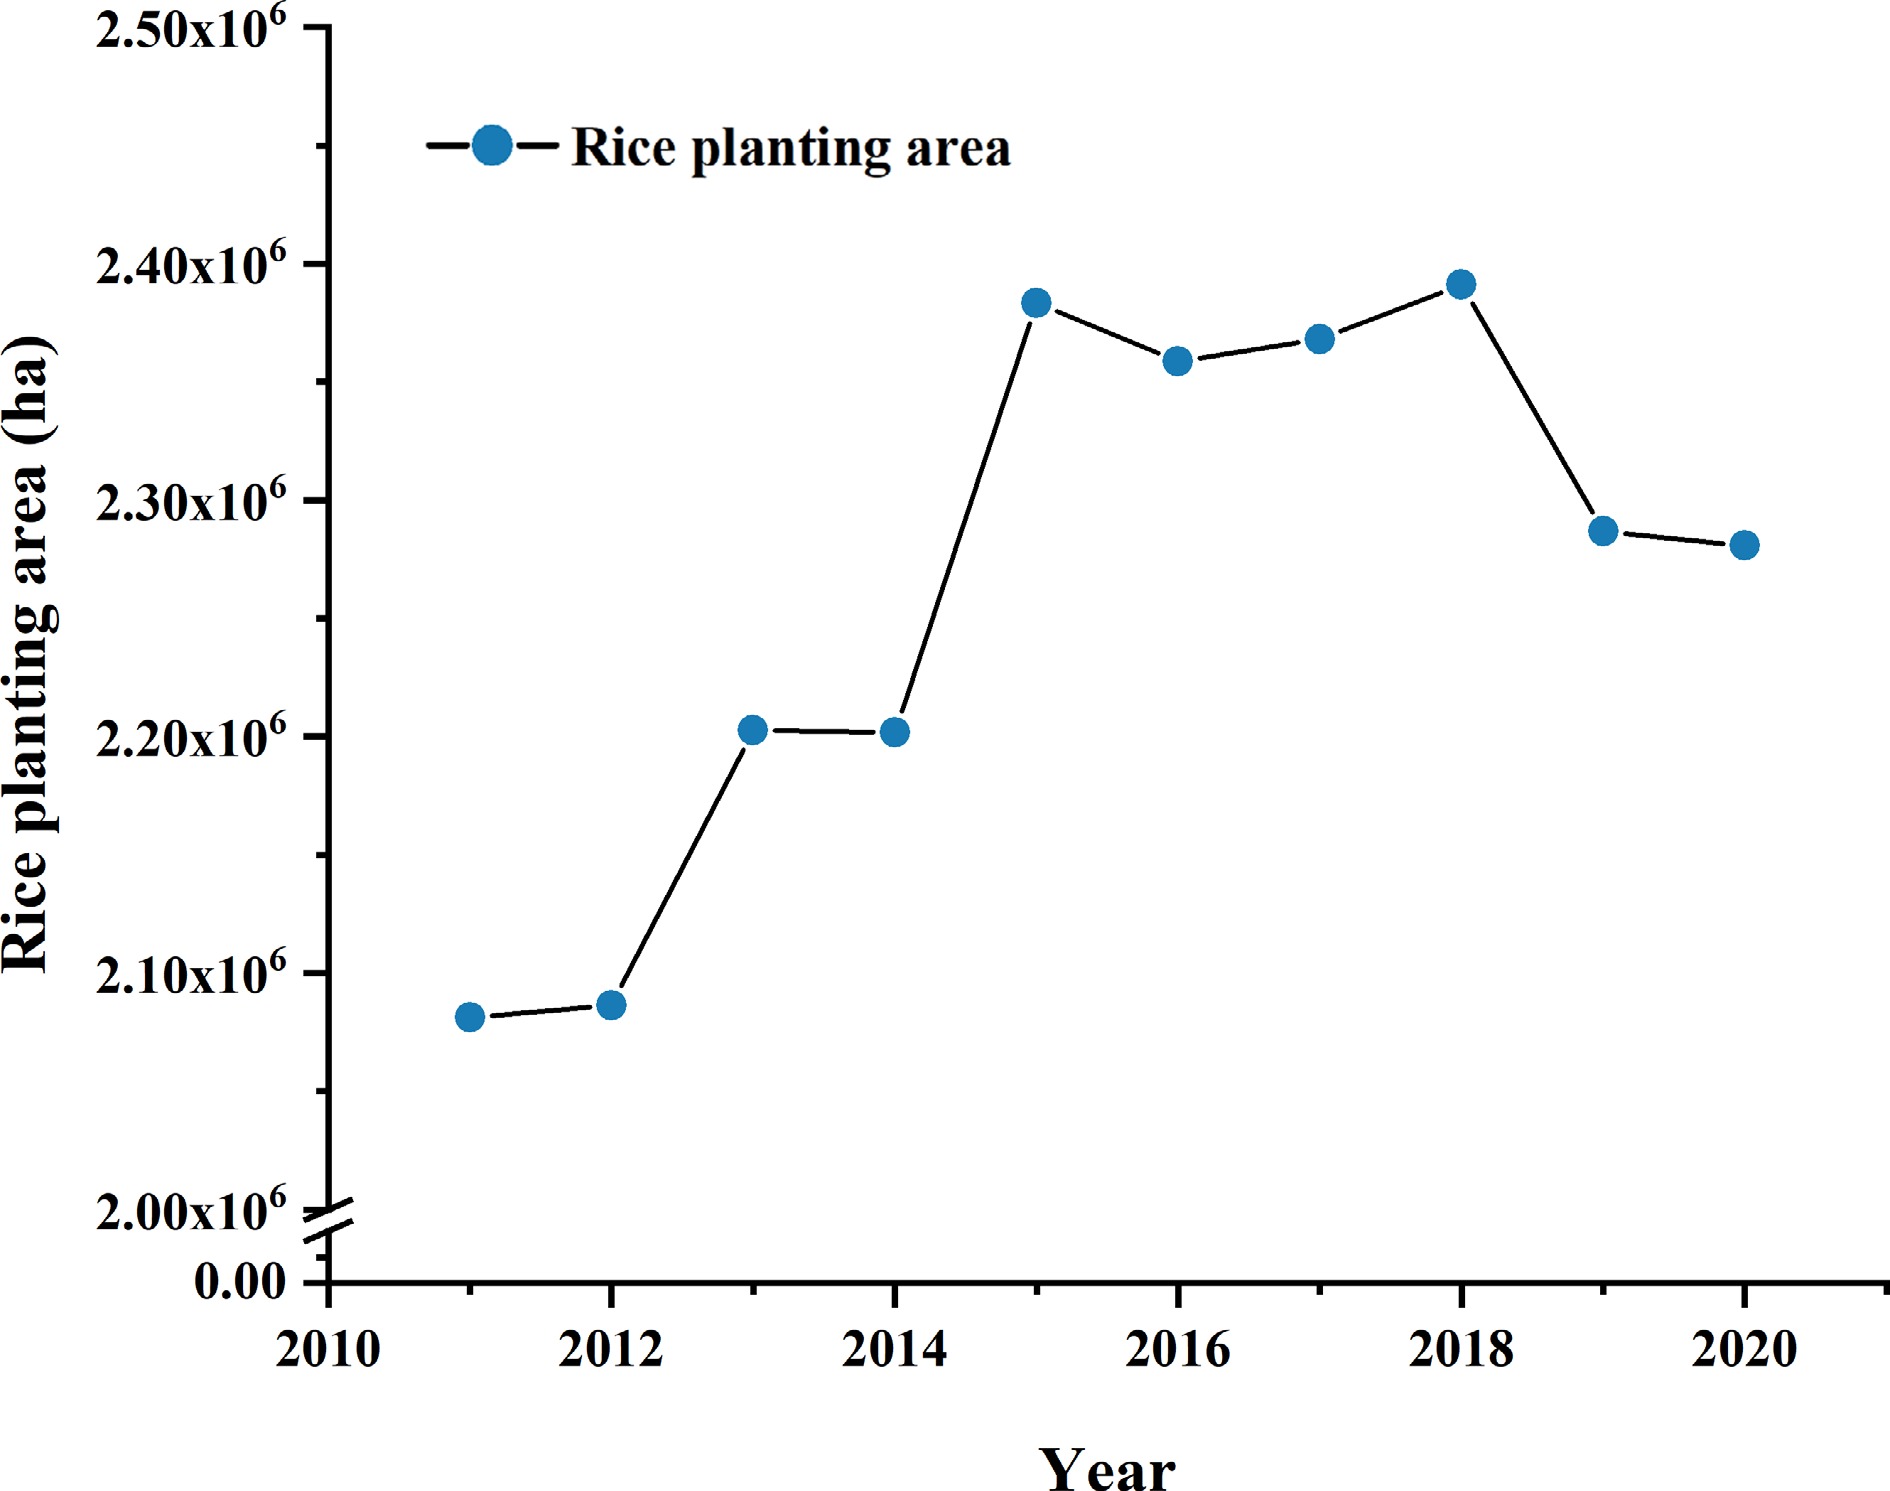
Figure 2.
Change trend of rice planting area in Hubei province over the past 10 years (data from the Hubei Statistical Yearbook (2011-2020)).
-
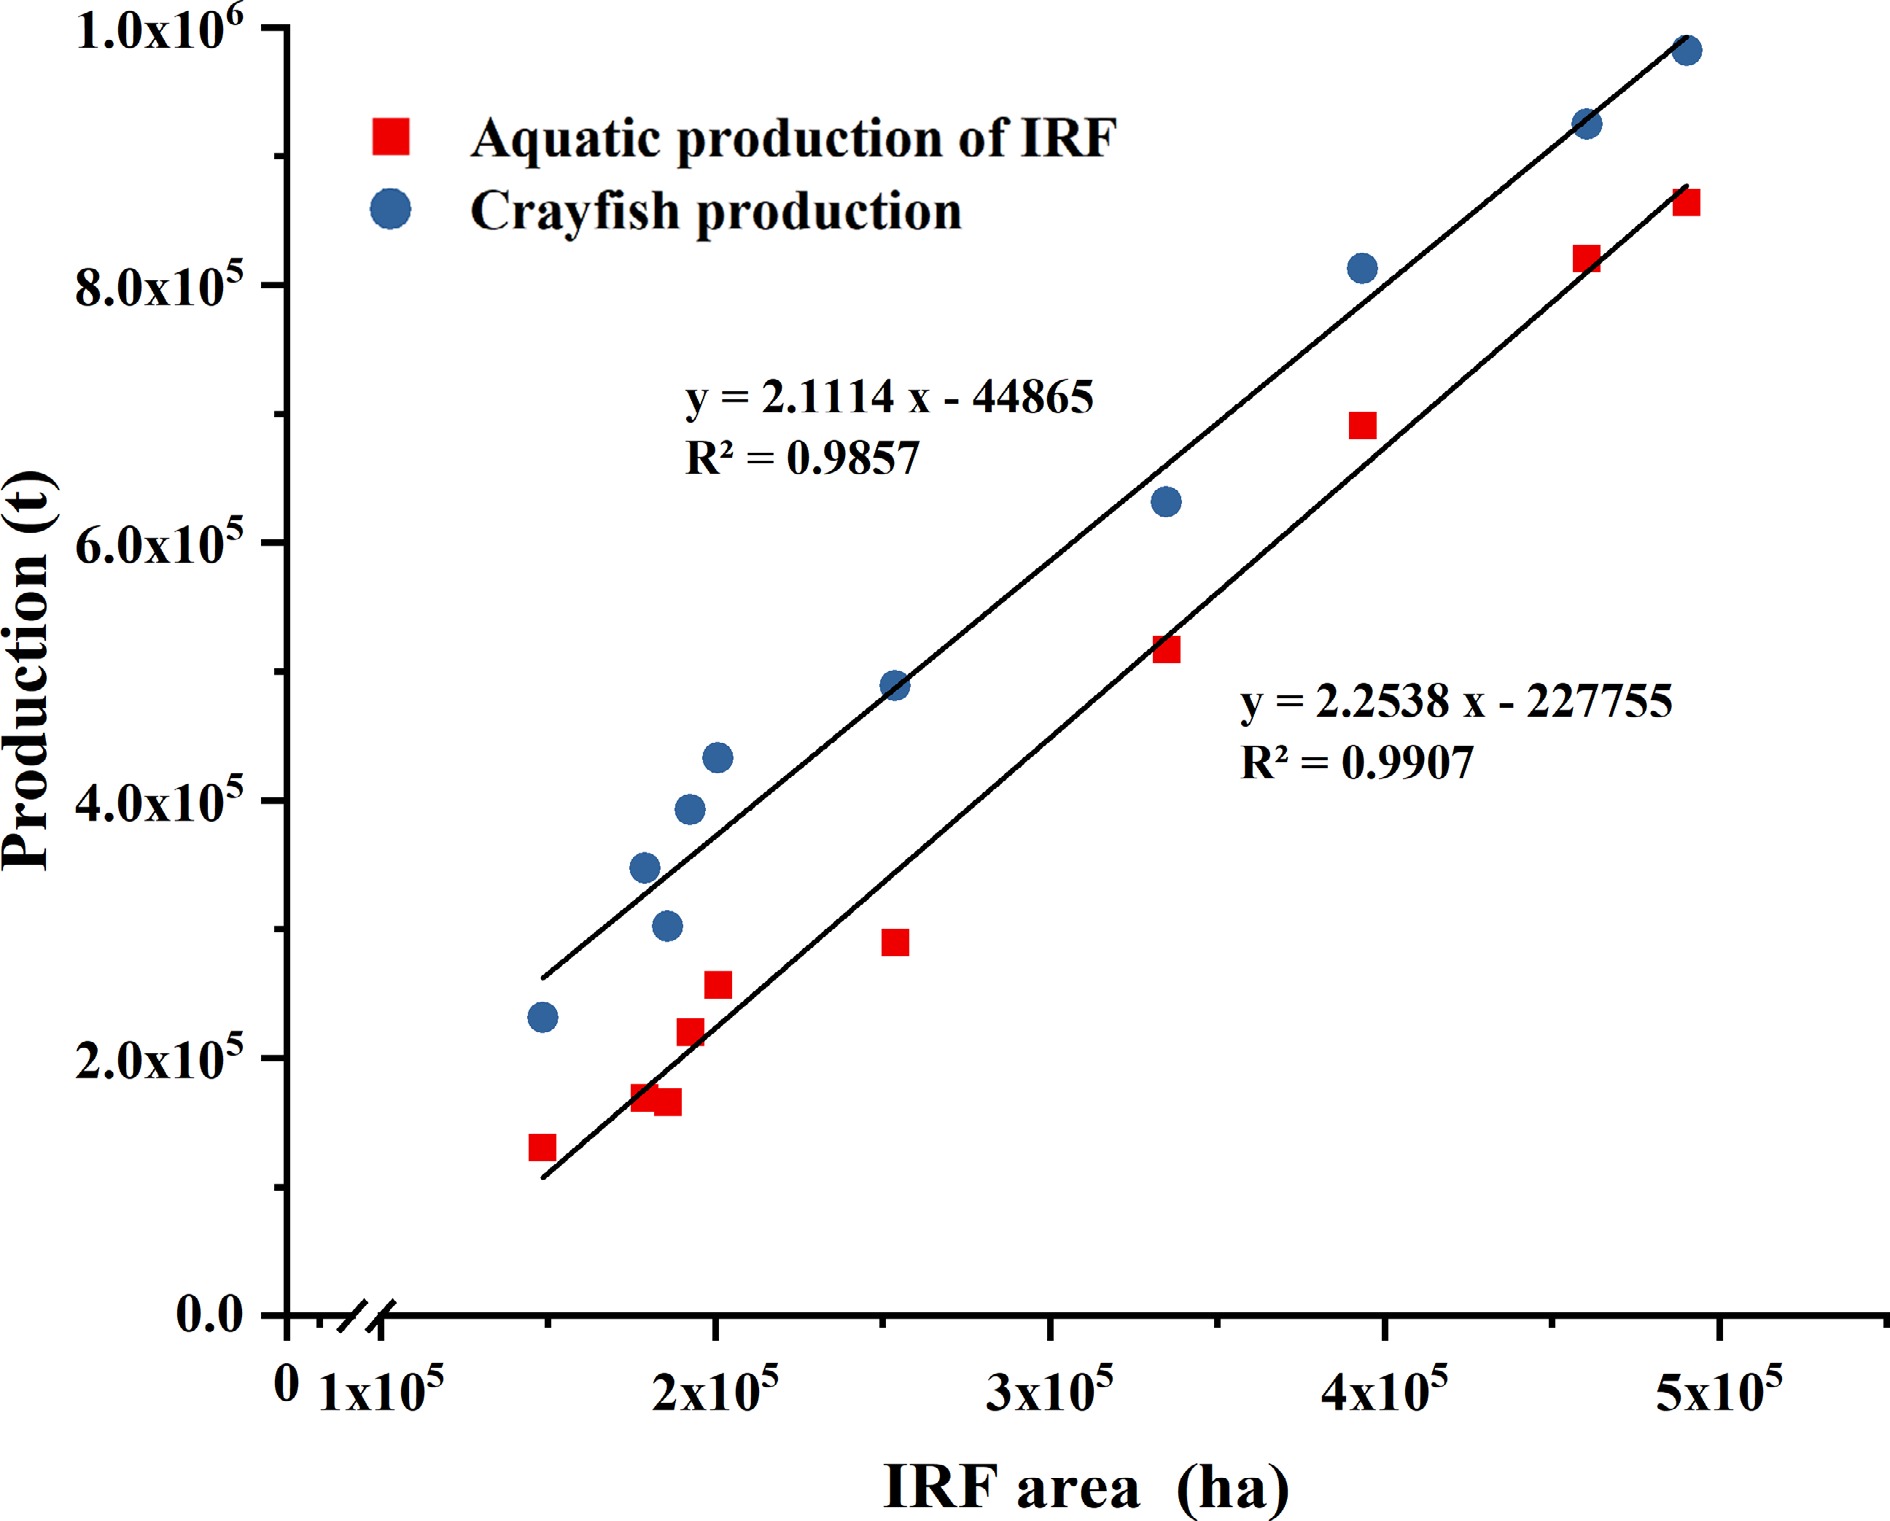
Figure 3.
Relationship between total crayfish production and aquatic production of IRF in Hubei province over the past 10 years (data from the Hubei Rural Statistical Yearbook and the China Fishery Statistical Yearbook (2011-2020)).
-
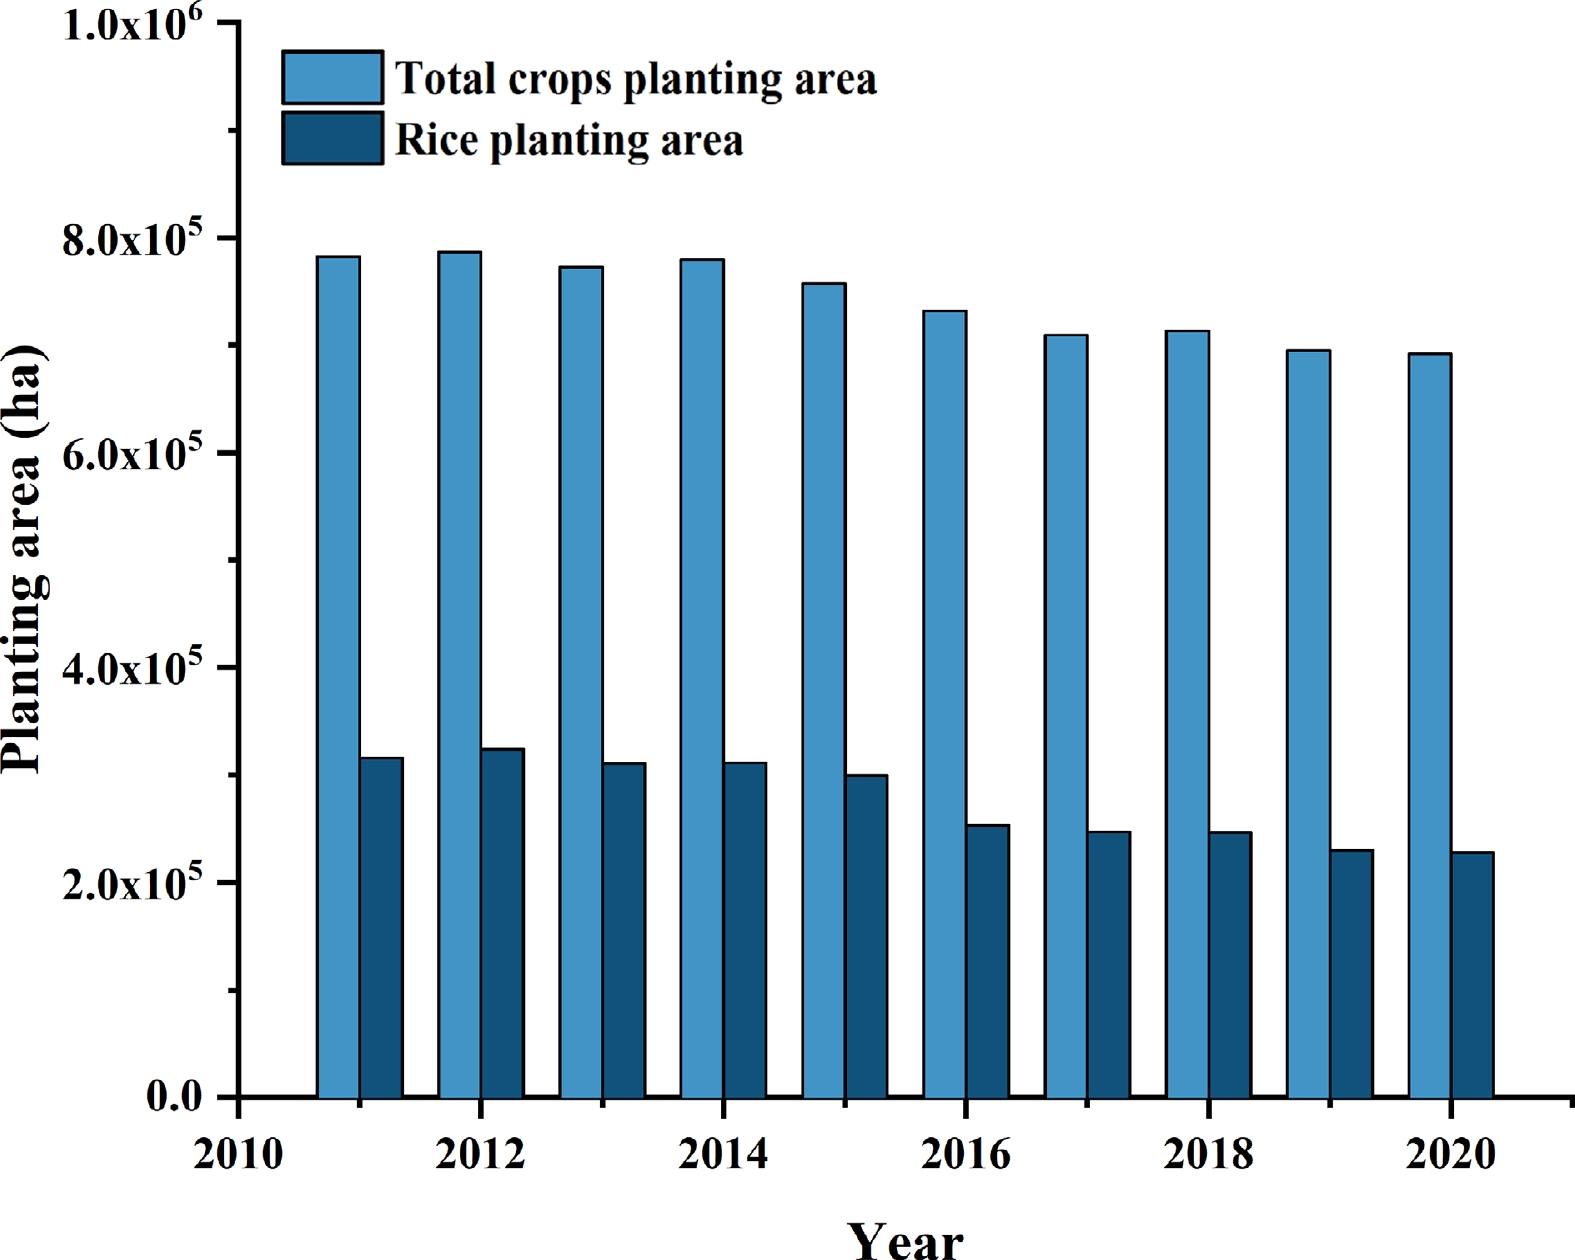
Figure 4.
Change trend of rice planting area in Hainan province over the past 10 years (data from the Hainan Statistical Yearbook (2011-2020)).
-
Province Rice planting area (ha) IRF area (ha) Proportion of IRF area to
rice planting area (%)Jiangsu 2.18 × 10⁶ 1.92 × 10⁵ 8.80 Anhui 2.51 × 10⁶ 2.72 × 10⁵ 10.84 Jiangxi 3.35 × 10⁶ 1.01 × 10⁵ 3.02 Hubei 2.29 × 10⁶ 4.60 × 10⁵ 20.11 Hunan 3.86 × 10⁶ 3.13 × 10⁵ 8.12 Sichuan 1.87 × 10⁶ 3.13 × 10⁵ 16.73 Guizhou 6.65 × 10⁵ 1.79 × 10⁵ 26.98 Yunnan 8.42 × 10⁵ 9.74 × 10⁴ 11.57 Table 1.
IRF area/rice planting area in eight provinces in 2019.
-
Seasons Grain yield (t·ha−1) RM RCF (excluding culture ditch) RCF (including culture ditch) Early-season 7.74 a 6.83 b 5.51 b Late-season 3.45 b 4.01 a 3.24 b Within a row for each season, means followed by the different letters are significantly different from each other, while the means followed by the same letter are not, according to LSD (0.05). Table 2.
Comparison of grain yield in field trials.
-
Seasons NPFP (kg·kg−1) RM RCF (excluding culture ditch) RCF (including culture ditch) Early-season 64.47 b 85.32 a 68.92 b Late-season 28.74 c 50.13 a 40.49 b Within a row for each season, means followed by the different letters are significantly different from each other, while the means followed by the same letter are not, according to LSD (0.05). Table 3.
Comparison of NPFP in field trials.
-
Seasons Economic benefits (CNY·ha−1) RM RCF (including
culture ditch)Early-season 23,208.42 b 91,539.73 a Late-season 10,345.68 b 9,718.02 b Within a row for each season, means followed by the different letters are significantly different from each other, while the means followed by the same letter are not, according to LSD (0.05). Note: rice price was 3 CNY·kg−1, crayfish price was 50 CNY·kg−1. Table 4.
Economic benefit analysis of field trials.
Figures
(4)
Tables
(4)