-
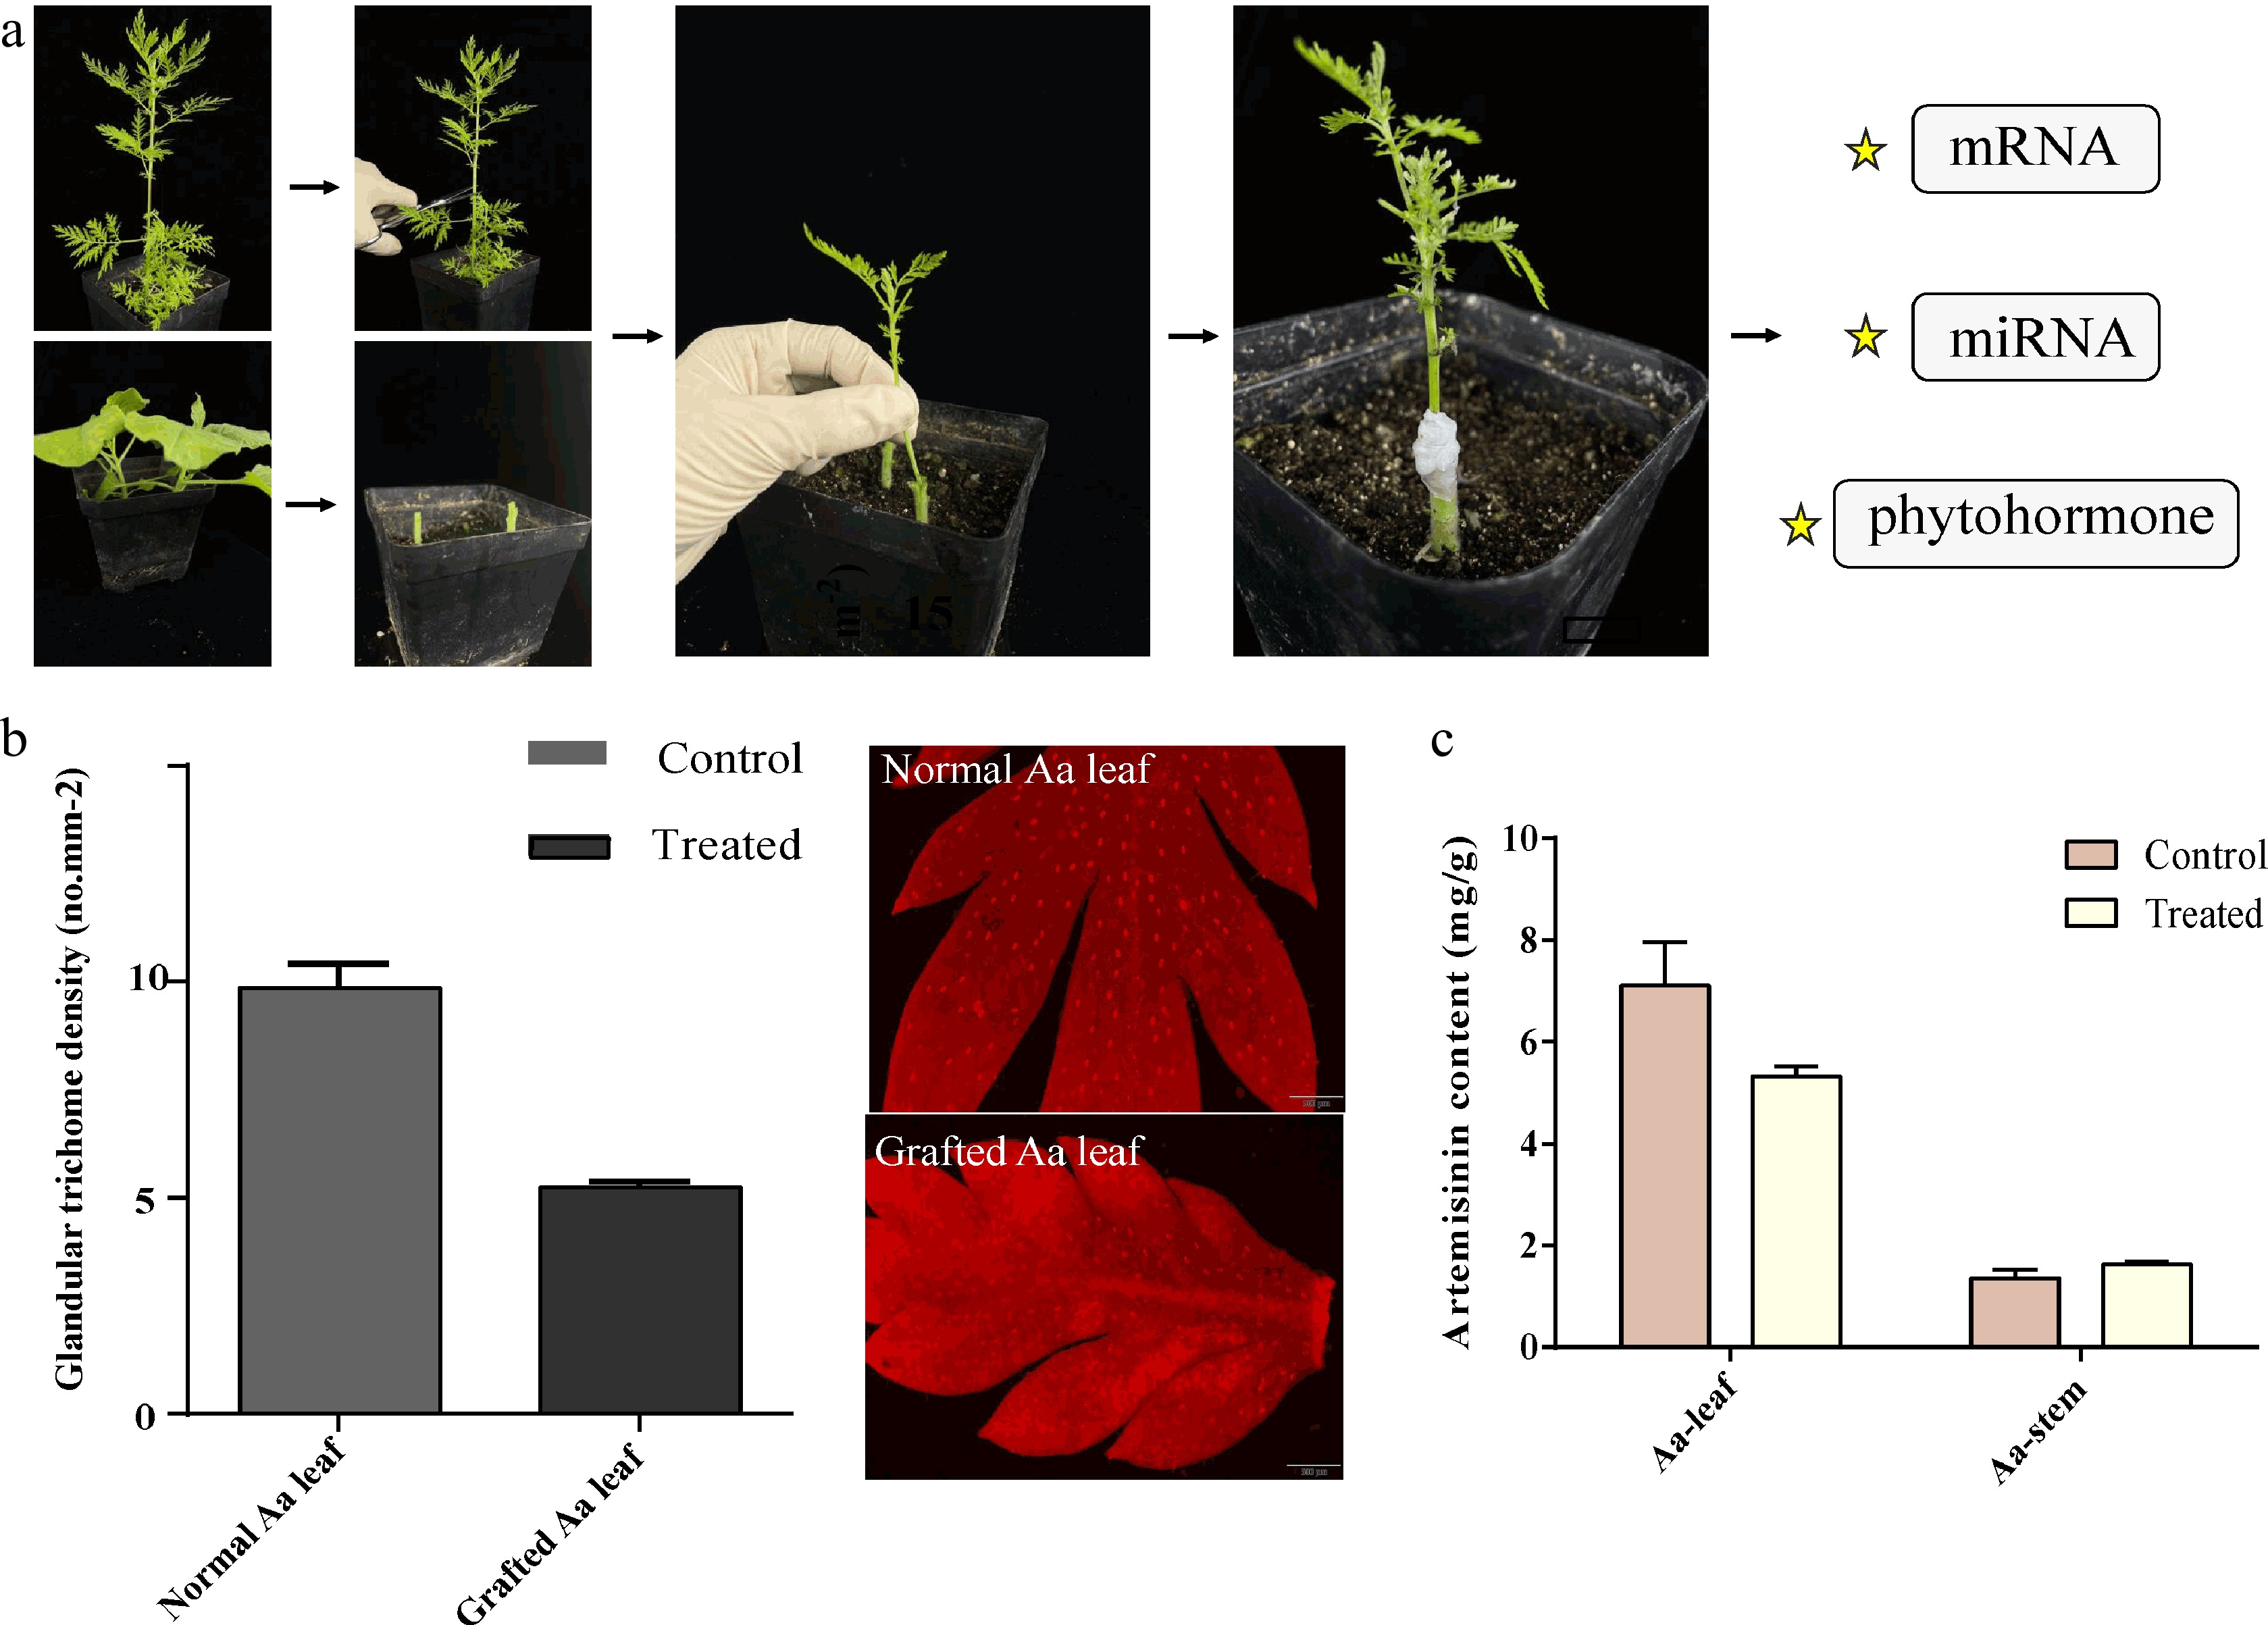
Figure 1.
A heterograft model of A. annua scion and N. benthamiana rootstock. (a) The upper half of A.annua and bottom half of N. benthamiana were cut using a sharp knife. Through the apical wedge grafting technique, the two part were combined and co-grown for a month. (b) The density of gladular trichome in leaves and (c) artemisinin content were calculated as shown in the histogram, no less than three biological replicates were performed for each data.
-
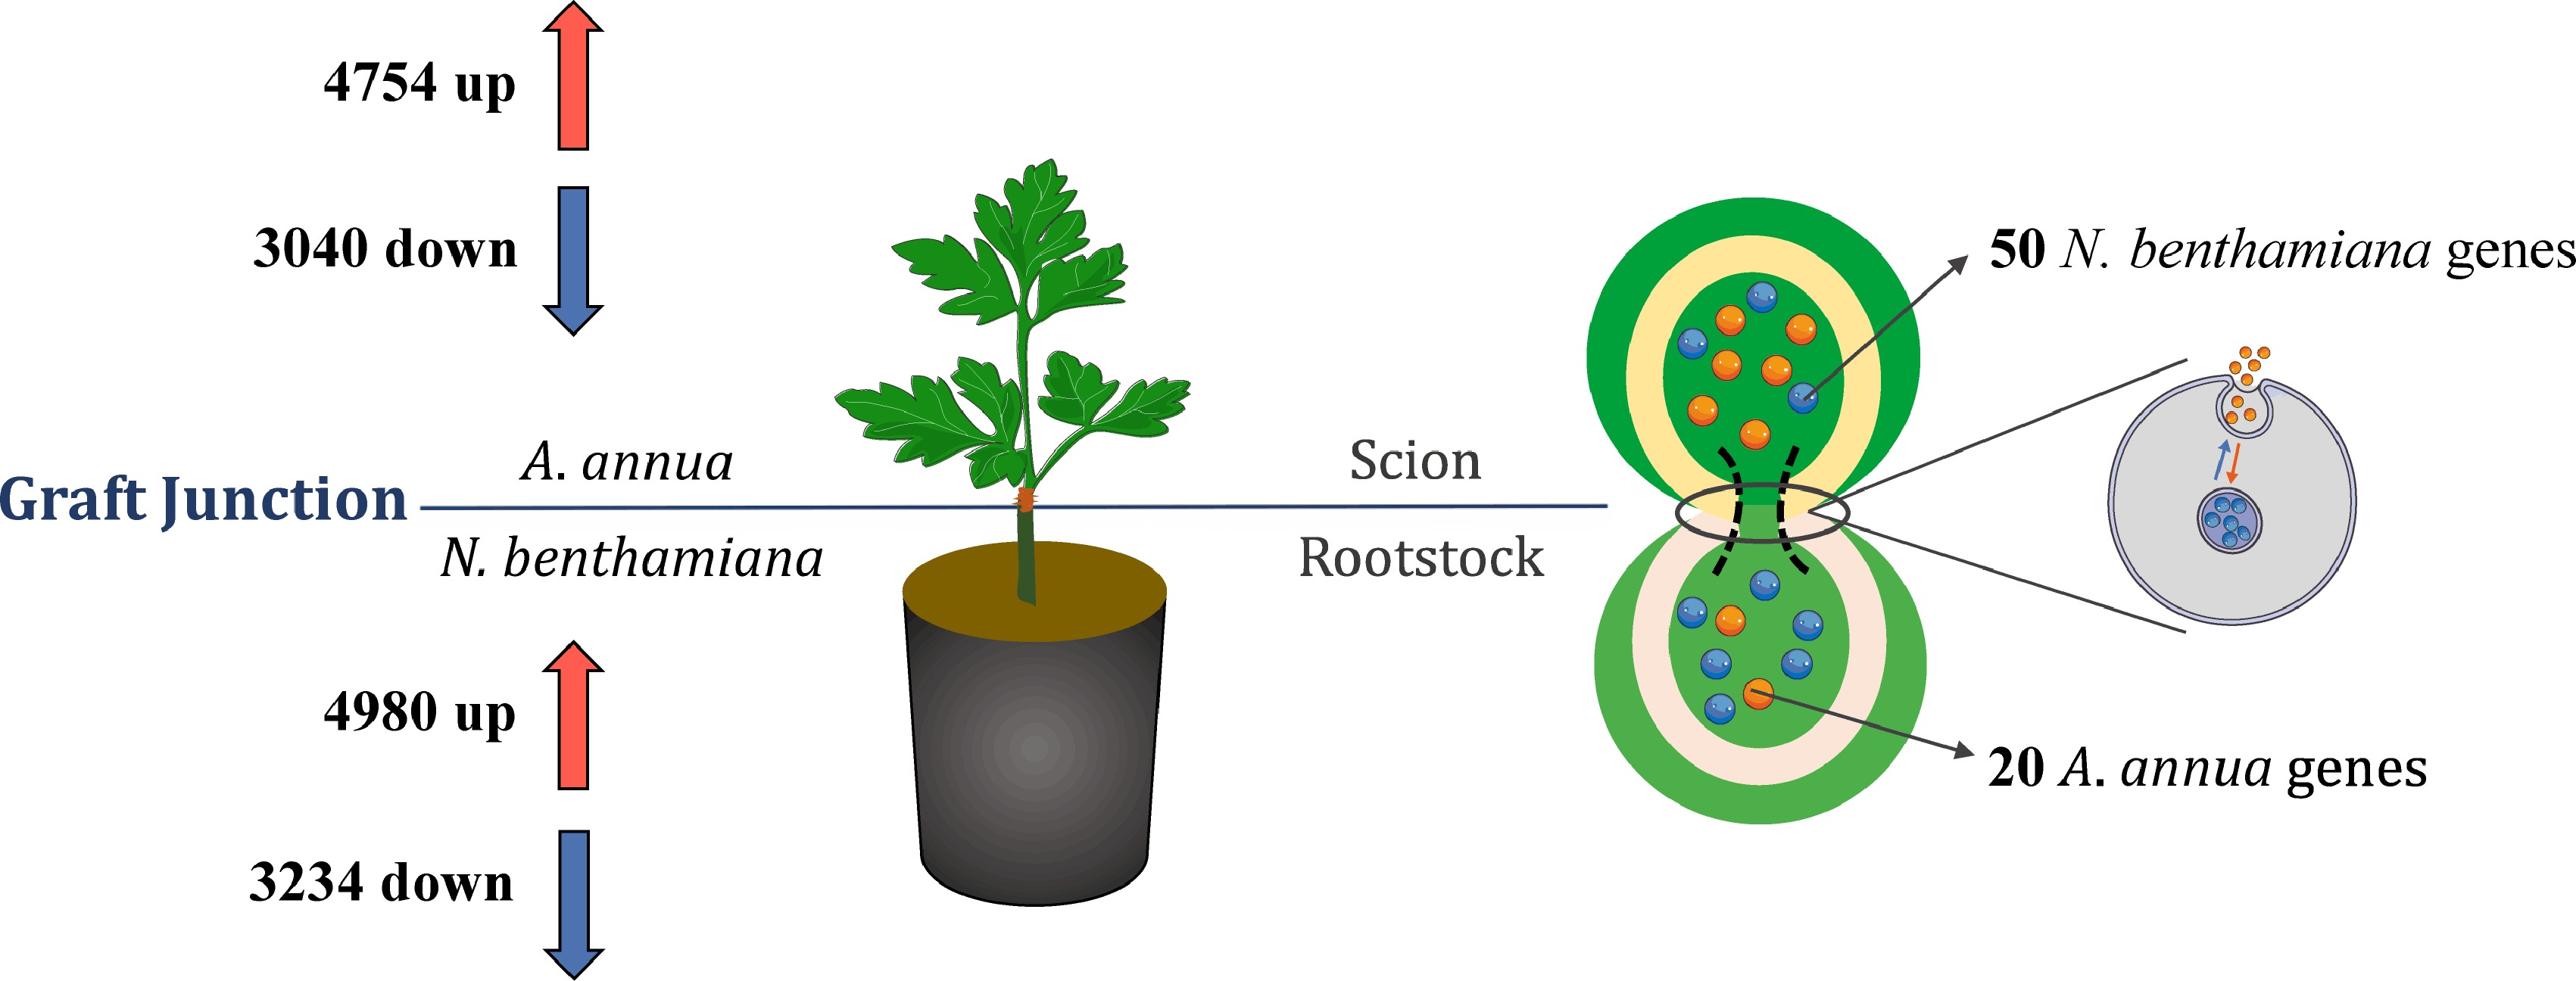
Figure 2.
DEGs and potential mobile mRNAs identified from the Aa/Nb heterograft model. The upper scion part belonged to A. annua, and the bottom rootstock part was N. benthamiana as separated with horizontal line. The left half of the information was the number of up-regulated and down-regulated of different expression genes related to comparing with the same plant. The right half of the photo exhibited the movement process of mRNAs and identification of non-homologous genes.
-
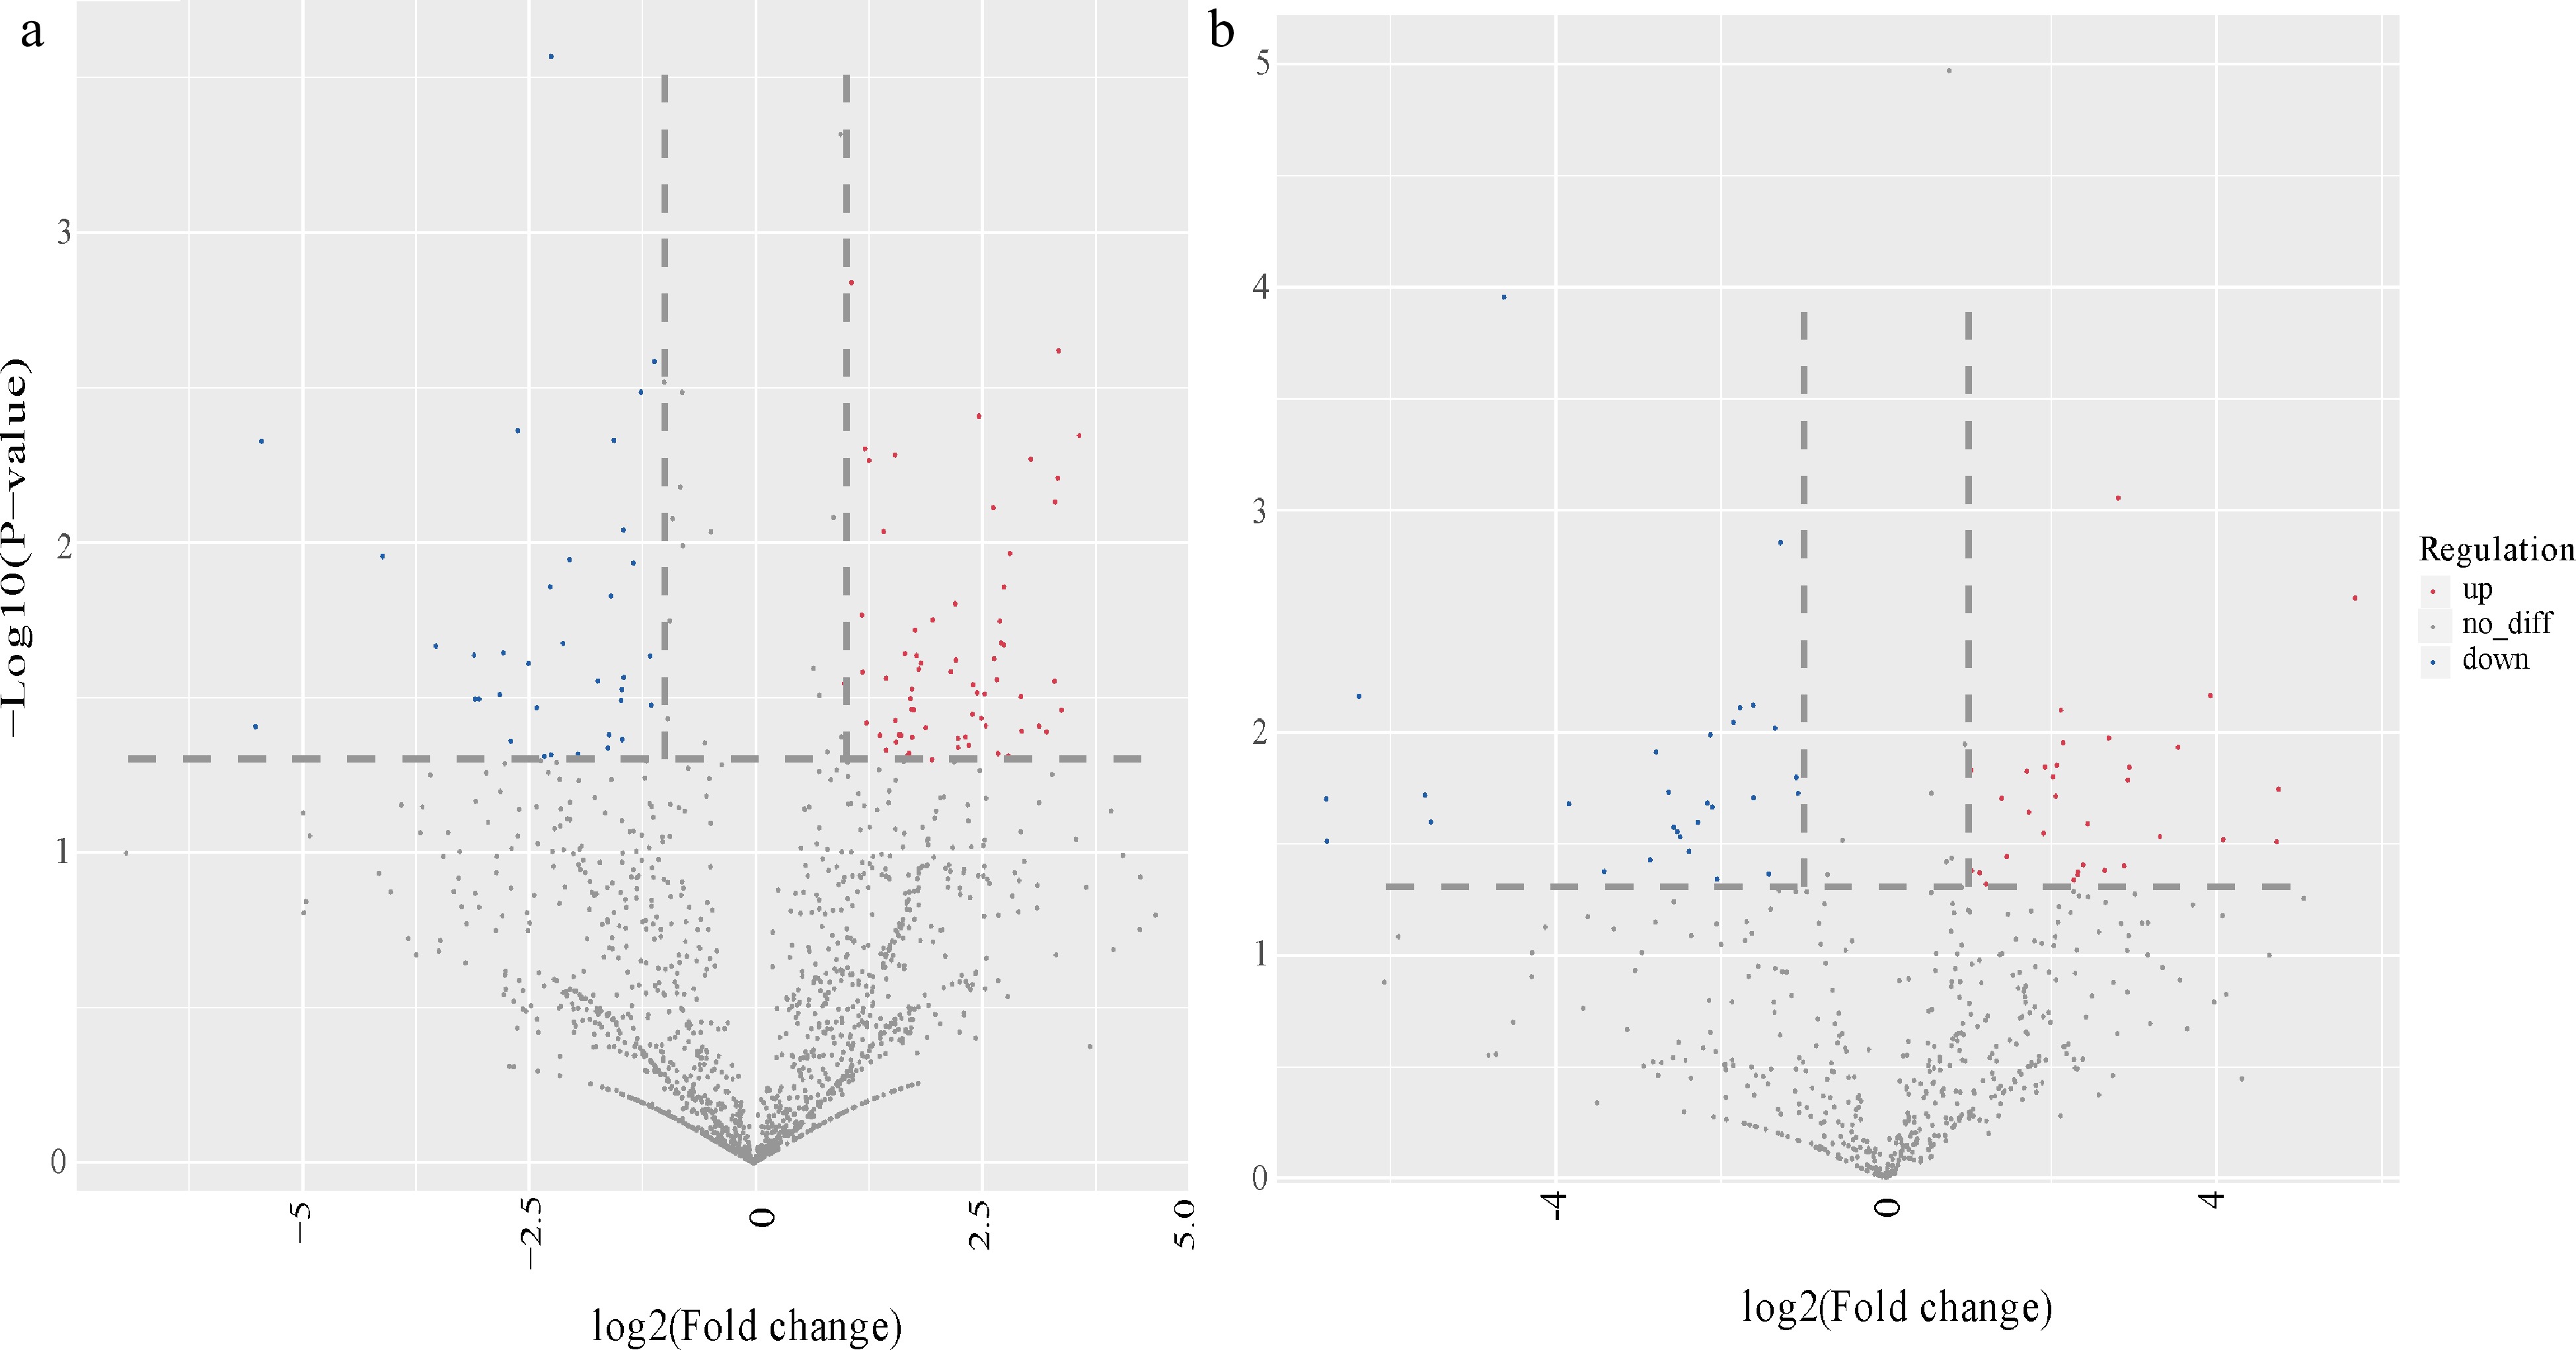
Figure 3.
Volcano photo of differentially expressed miRNAs in scion and rootstock. Overall distribution of differentially expressed miRNA in (a) Aa scion and (b) Nb rootstock. The abscissa represents the differential expression multiple changes of miRNA in different samples. The ordinate represents the statistical significance of miRNA expression changes. Red dots represent significantly up-regulated differentially expressed genes, blue dots represent significantly down-regulated differentially expressed genes, and gray dots represent non-significantly differentially expressed genes.
-
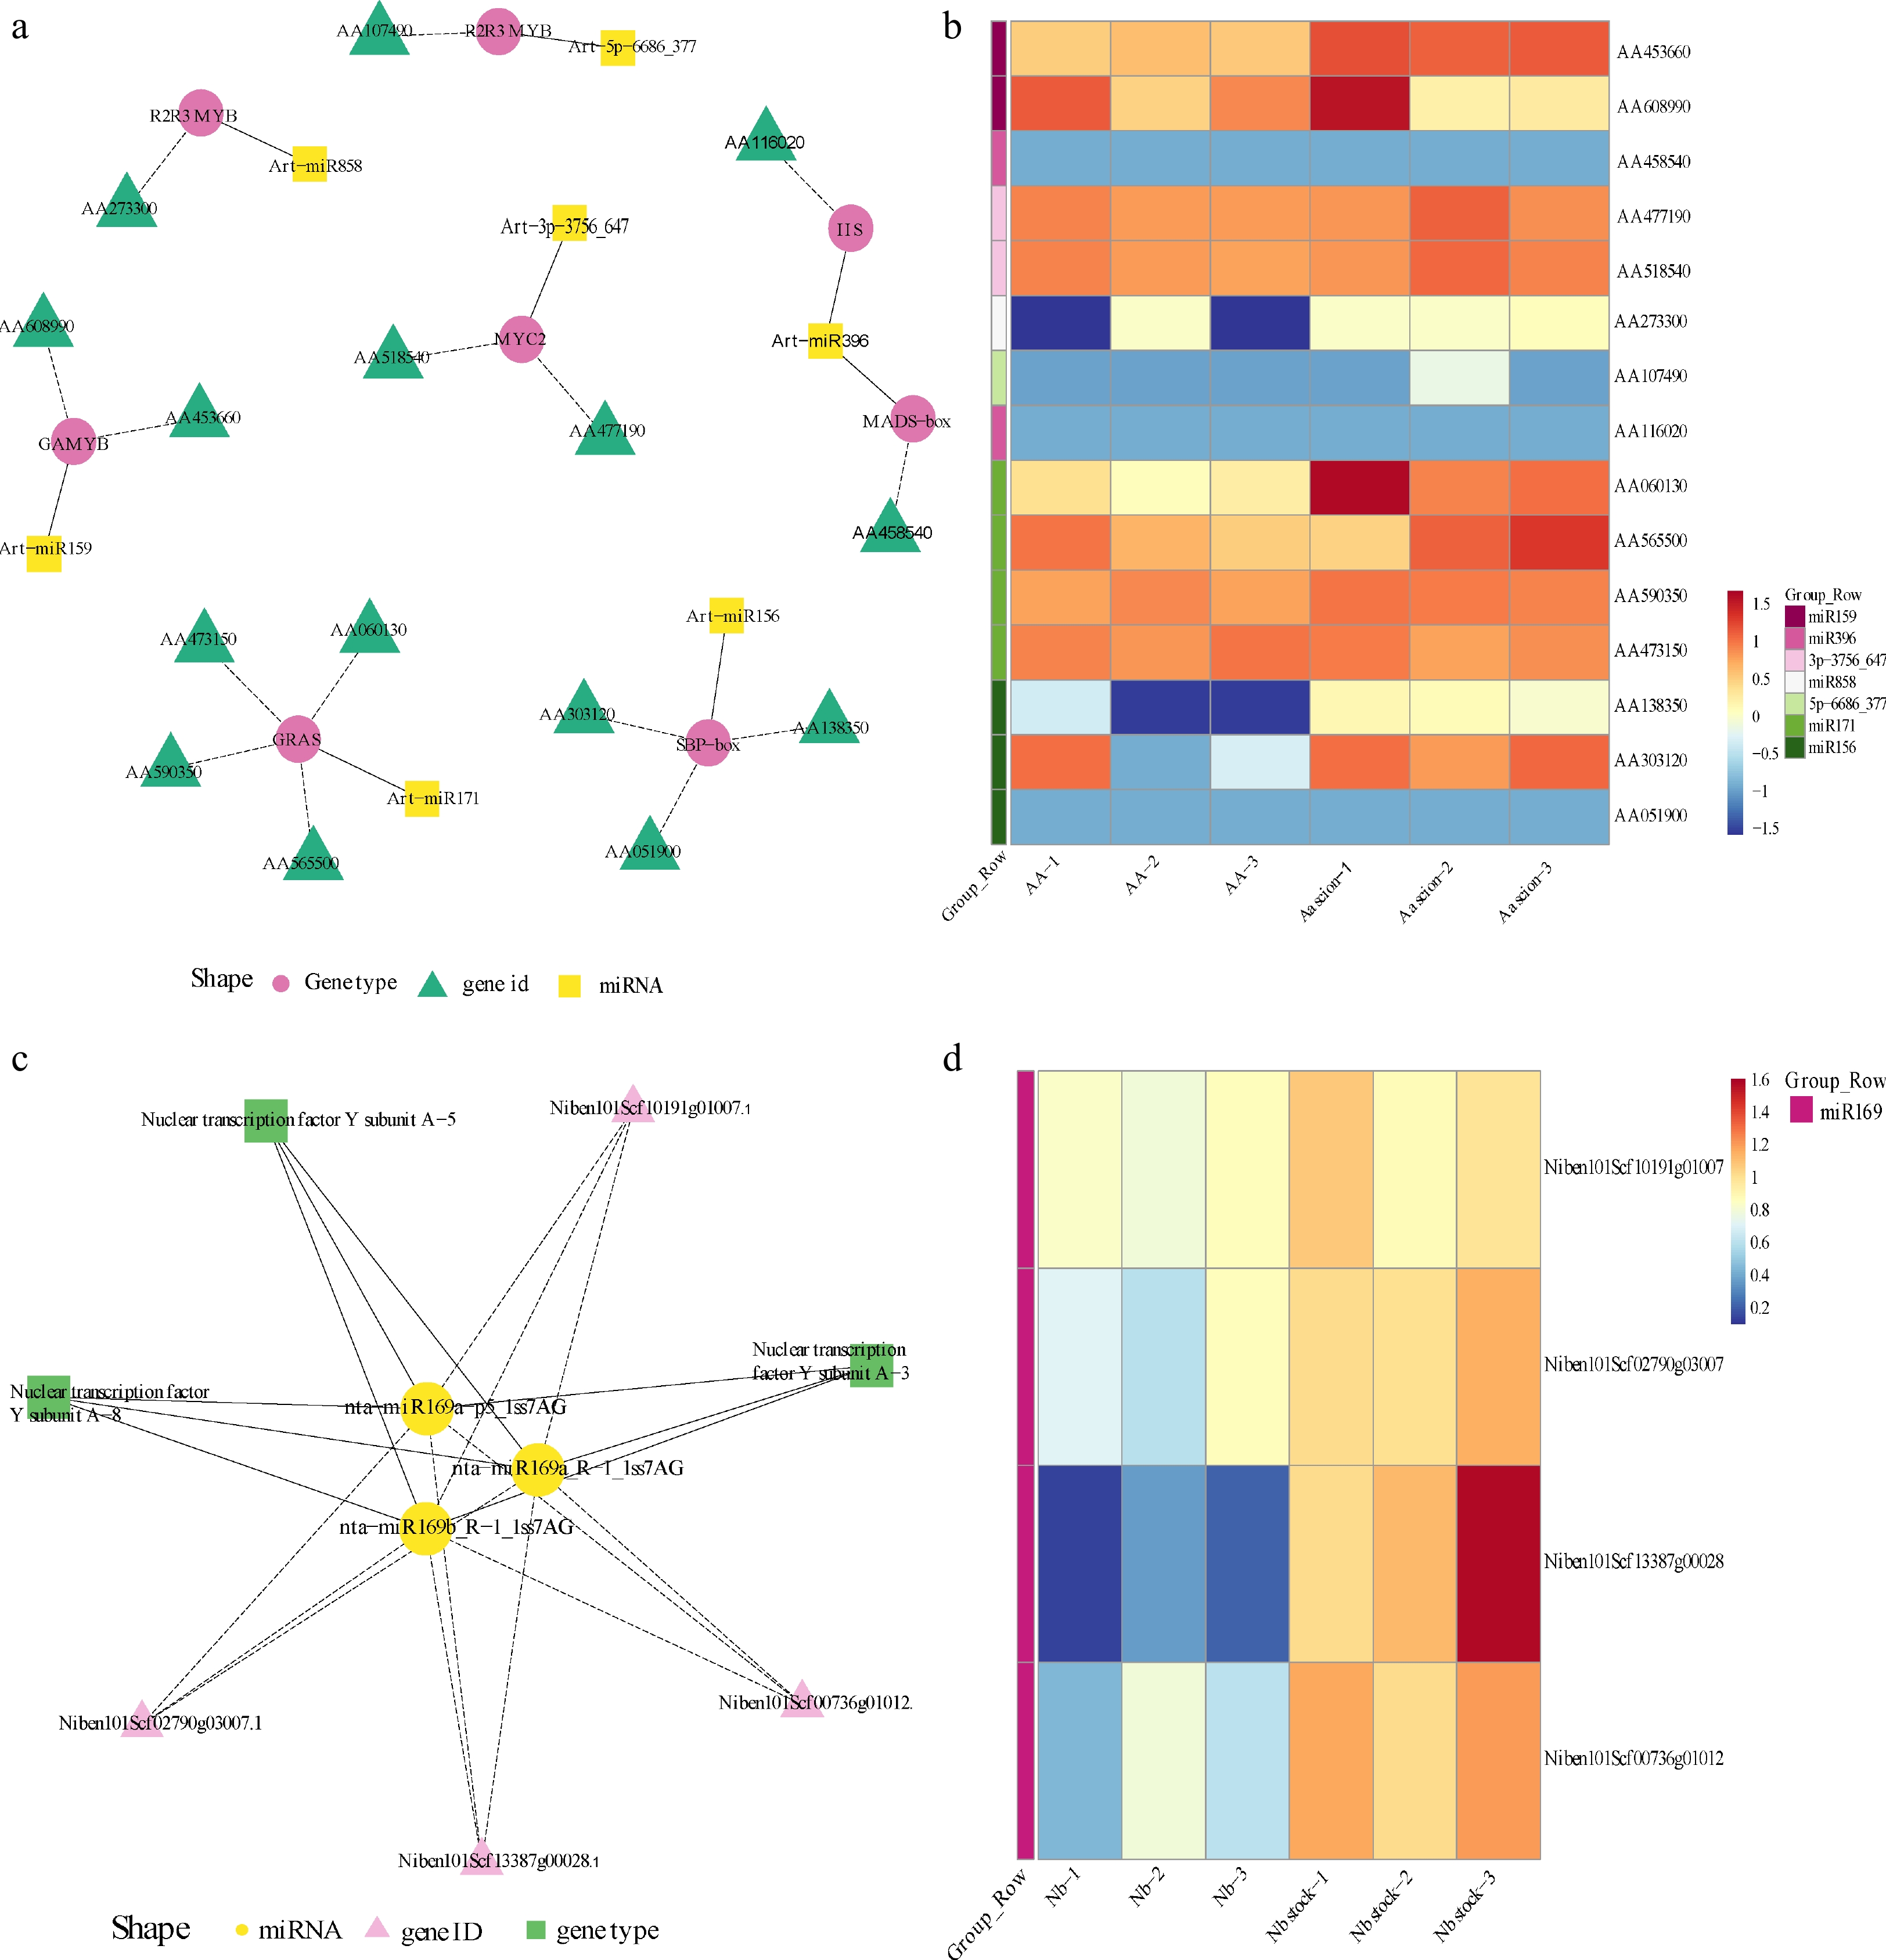
Figure 4.
Regulatory network research of transcription factors in differentially expression miRNAs and heatmap analysis of target gene among Aa scion and Nb rootstock. (a) Network plot of different expression miRNAs in A. annua scion. (b) Heatmap of different expression miRNAs targets in A. annua scion. (c) Network plot of different expression miRNAs in N. benthamiana rootstock. (d) Heatmap of different expression miRNAs targets in N. benthamiana rootstock. The legend at the bottom of the left figure marks the miRNA name, target gene name and gene type in different colors and shapes, respectively. Heatmap of target genes was used FPKM as expression quantity. Different colors indicate different gene expression levels, from blue to white to red, indicating low to high expression levels, with red indicating high expression genes and blue indicating low expression genes. The group of each gene corresponds to the color bar on the left.
-
Figure 5.
Changes of genes involved in phytohormone signal transduction. (a) Phytohormone transduction pathway of A. annua scion. (b) Phytohormone transduction pathway of N. benthamiana rootstock. Changes in DEGs were mapped in boxes, green and red boxes represent down-regulated and up-regulated, respectively. Orange boxes represents genes in the pathway indicting bidirectional regulation. Purple boxes illustrate no DEG.
-
Figure 6.
The content of measured ABA, JA and CK in A. annua scion and N. benthamiana rootstock. The abscissa represents the sampling site, and the ordinate represents the phytohormone concentration. The error bar represents the standard error for three independent experiments.
-
Pathway Pathway_ID Gene name Gene number Protein processing in endoplasmic reticulum ko04141 Niben101Scf01834g01011;
Niben101Scf12154g01009;
Niben101Scf03138g010103 Ubiquitin mediated proteolysis ko04120 Niben101Scf01002g13002 1 Spliceosome ko03040 Niben101Scf09268g00007;
Niben101Scf12154g01009;
Niben101Scf05678g010013 ABC transporters ko02010 Niben101Scf01719g08010 1 Carbon metabolism ko01200 Niben101Scf05270g01002;
Niben101Scf14996g00009;
Niben101Scf02480g020123 Biosynthesis of amino acids ko01230 Niben101Scf05270g01002 1 Glyoxylate and dicarboxylate metabolism ko00630 Niben101Scf02480g02012;
Niben101Scf14996g000092 Amino sugar and nucleotide sugar metabolism ko00520 Niben101Scf16022g04004;
Niben101Scf03036g030232 Tryptophan metabolism ko00380 Niben101Scf14996g00009 1 Phagosome ko04145 Niben101Scf03370g07004 1 Isoflavonoid biosynthesis ko00943 Niben101Scf03016g00008 1 Arginine and proline metabolism ko00330 Niben101Scf01580g05004 1 Ribosome biogenesis in eukaryotes ko03008 Niben101Scf13167g00007;
Niben101Scf02944g010142 RNA transport ko03013 Niben101Scf02944g01014 1 Plant hormone signal transduction ko04075 Niben101Scf06996g02005 1 Glycine, serine and threonine metabolism ko00260 Niben101Scf02480g02012 1 Cysteine and methionine metabolism ko00270 Niben101Scf05270g01002 1 Other glycan degradation ko00511 Niben101Scf05643g05001 1 Glutathione metabolism ko00480 Niben101Scf01580g05004;
Niben101Scf02562g000202 Ribosome ko03010 Niben101Scf06081g02016;
Niben101Scf05490g00015;
Niben101Scf03365g04007;
Niben101Scf13429g02004;
Niben101Scf02102g010165 Sulfur metabolism ko00920 Niben101Scf05270g01002 1 Photosynthesis ko00195 Niben101Scf01116g01004 1 Peroxisome ko04146 Niben101Scf14996g00009 1 Endocytosis ko04144 Niben101Scf12154g010097 1 Plant-pathogen interaction ko04626 Niben101Scf02581g04013;
Niben101Scf05565g020132 Oxidative phosphorylation ko00190 Niben101Scf01460g04018 1 Polyketide sugar unit biosynthesis ko00523 Niben101Scf16022g04004 1 Phosphatidylinositol signaling system ko04070 Niben101Scf05565g02013 1 Table 1.
KEGG pathway enrichment analysis of 50 Nb genes obtained from the Aa scion.
-
Pathway Pathway_ID Gene name Gene number Lysine degradation ko00310 CTI12_AA035330 1 Cutin, suberine and wax biosynthesis ko00073 CTI12_AA476810 1 Peroxisome ko04146 CTI12_AA476810 1 Photosynthesis ko00195 CTI12_AA113120
CTI12_AA297310
CTI12_AA4002003 Phagosome ko04145 CTI12_AA621340 1 mRNA surveillance pathway ko03015 CTI12_AA415690 1 RNA degradation ko03018 CTI12_AA415690 1 RNA transport ko03013 CTI12_AA415690 1 Oxidative phosphorylation ko00190 CTI12_AA297310 1 Steroid biosynthesis ko00100 CTI12_AA106760 1 Ribosome ko03010 CTI12_AA117230 2 Table 2.
KEGG pathway enrichment analysis of 20 A. annua genes obtained from N. benthamiana rootstock.
-
Aa Aa scion Nb Nb rootstock Raw reads 14,833,433 14,976,061 14,057,479 13,596,666 Rfam 279,235 351,738 712,423 1,801,176 mRNA 1,663,742 1,523,161 1,118,362 1,698,556 Valid reads 10,043,761 9,486,686 8,143,546 5,473,716 Table 3.
Overview of miRNA sequencing data from Aa/Nb heterograft plants.
Figures
(6)
Tables
(3)