-
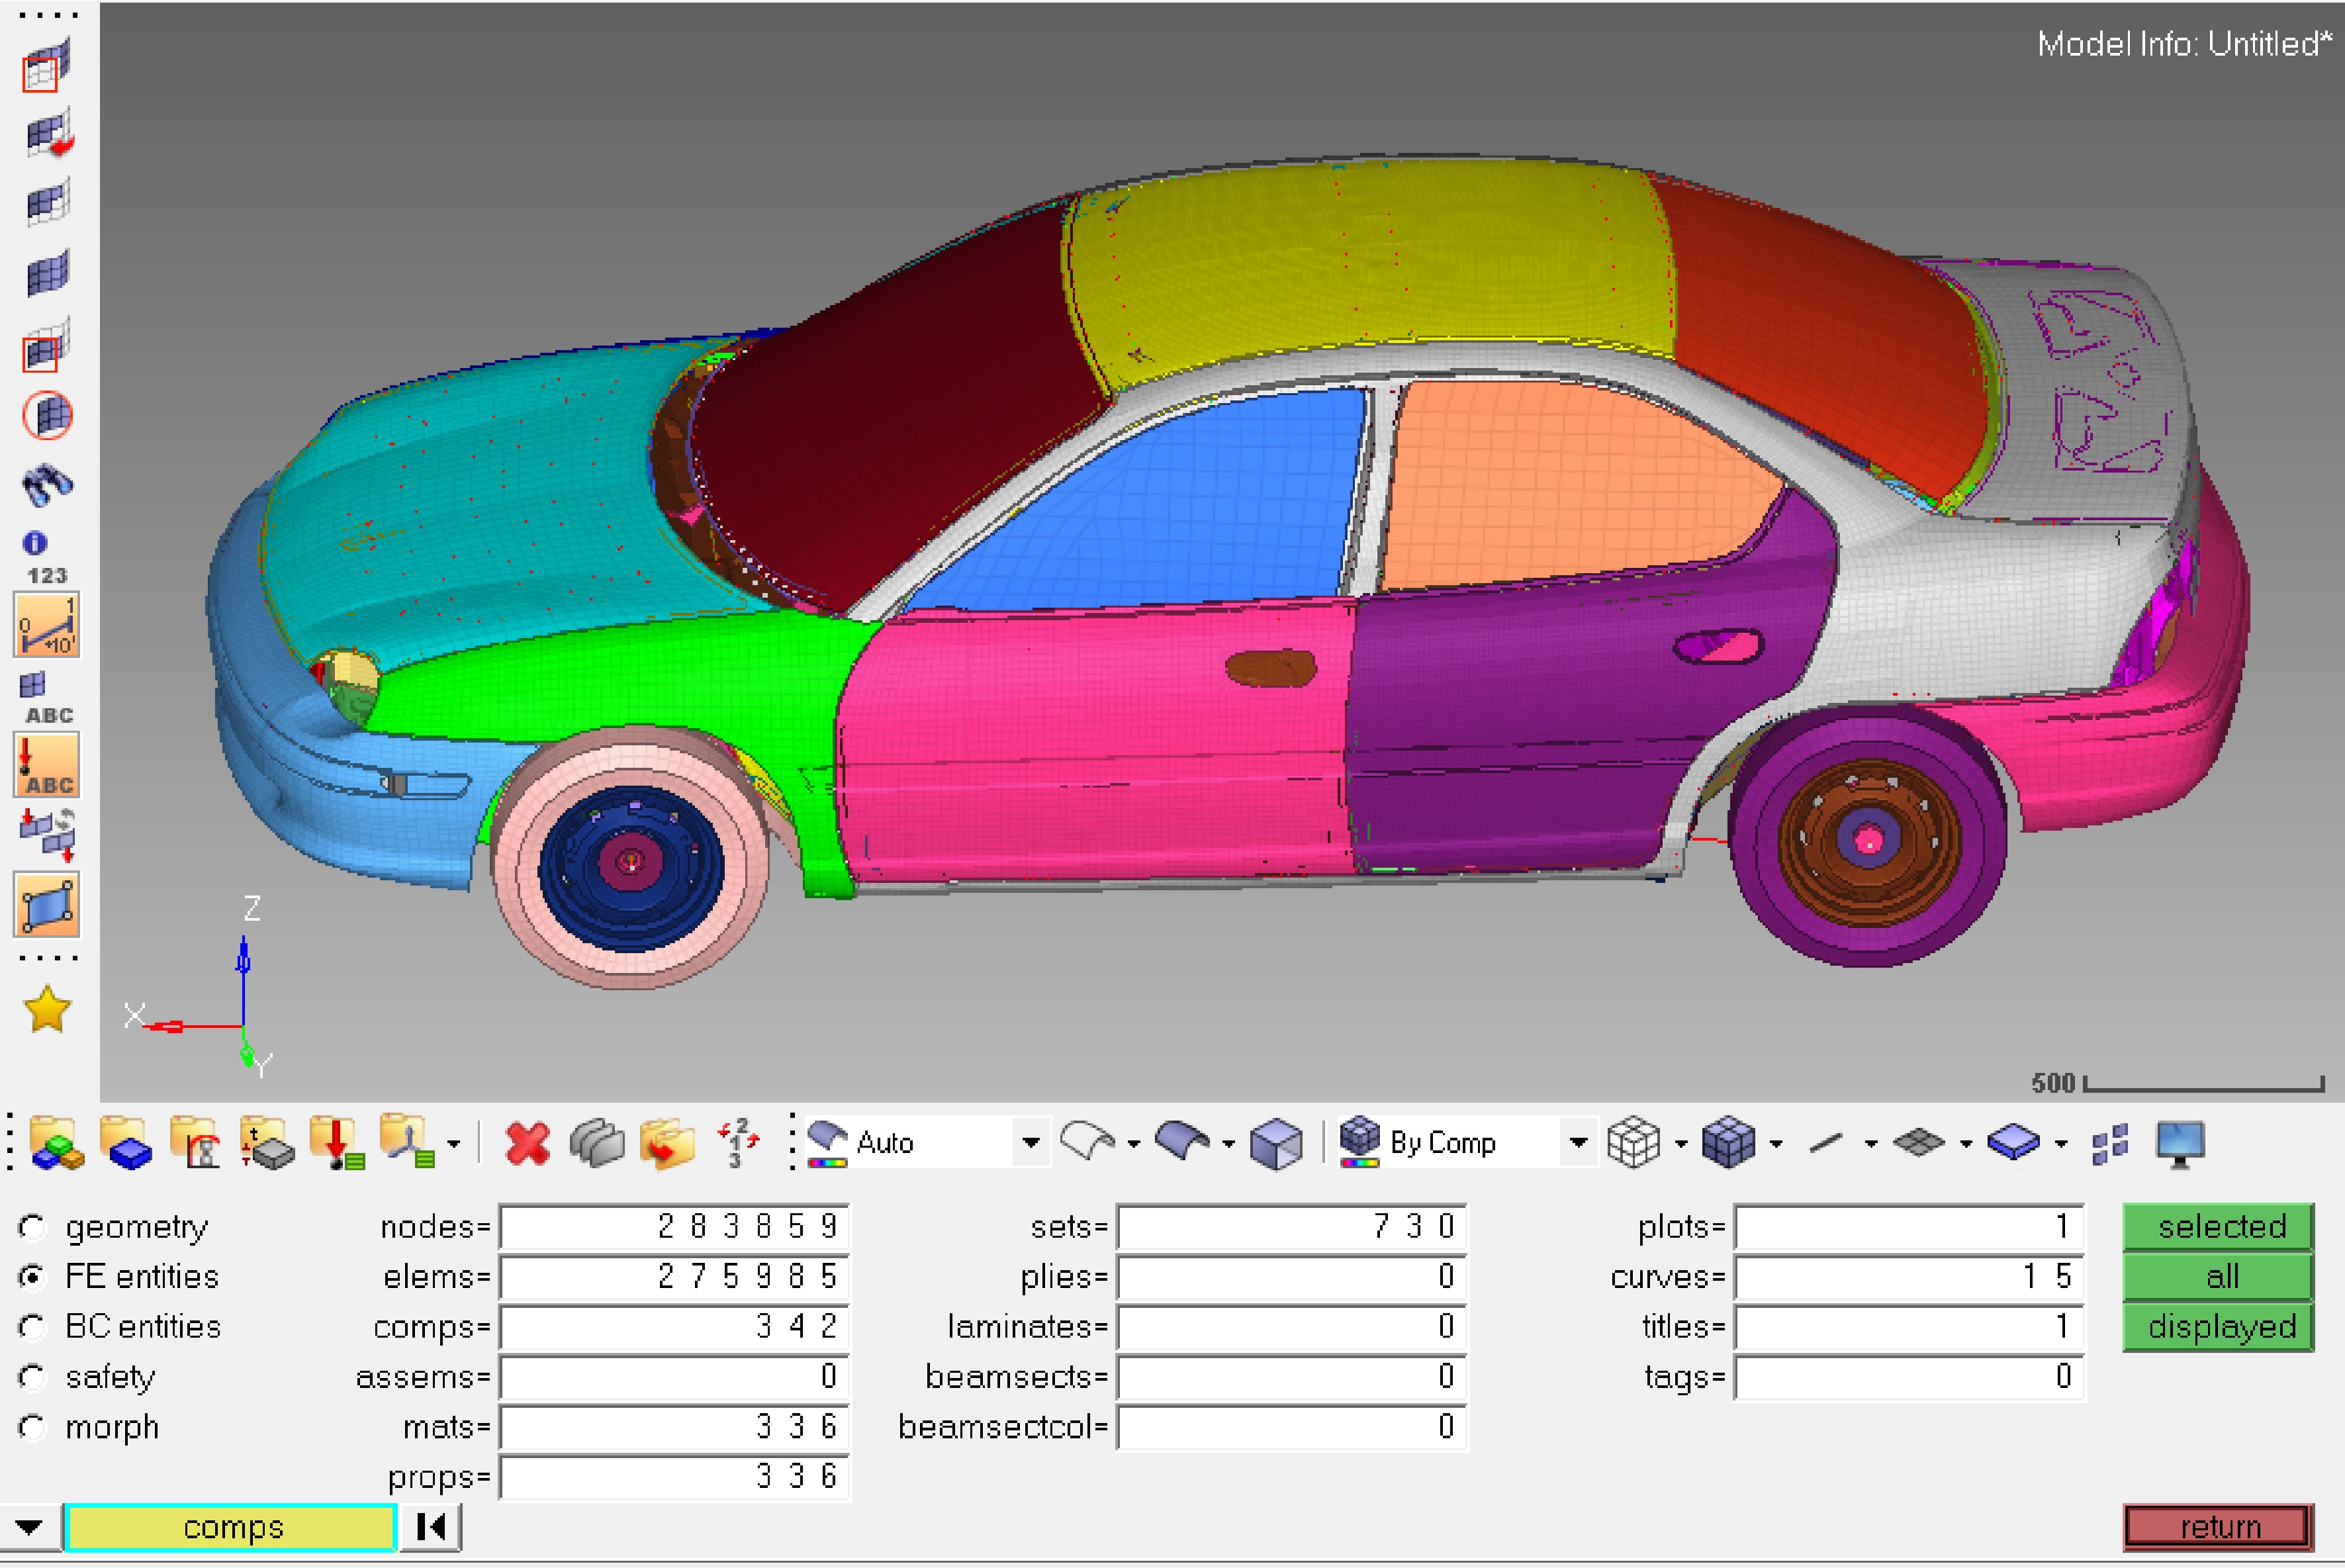
Figure 1.
The vehicle model.
-
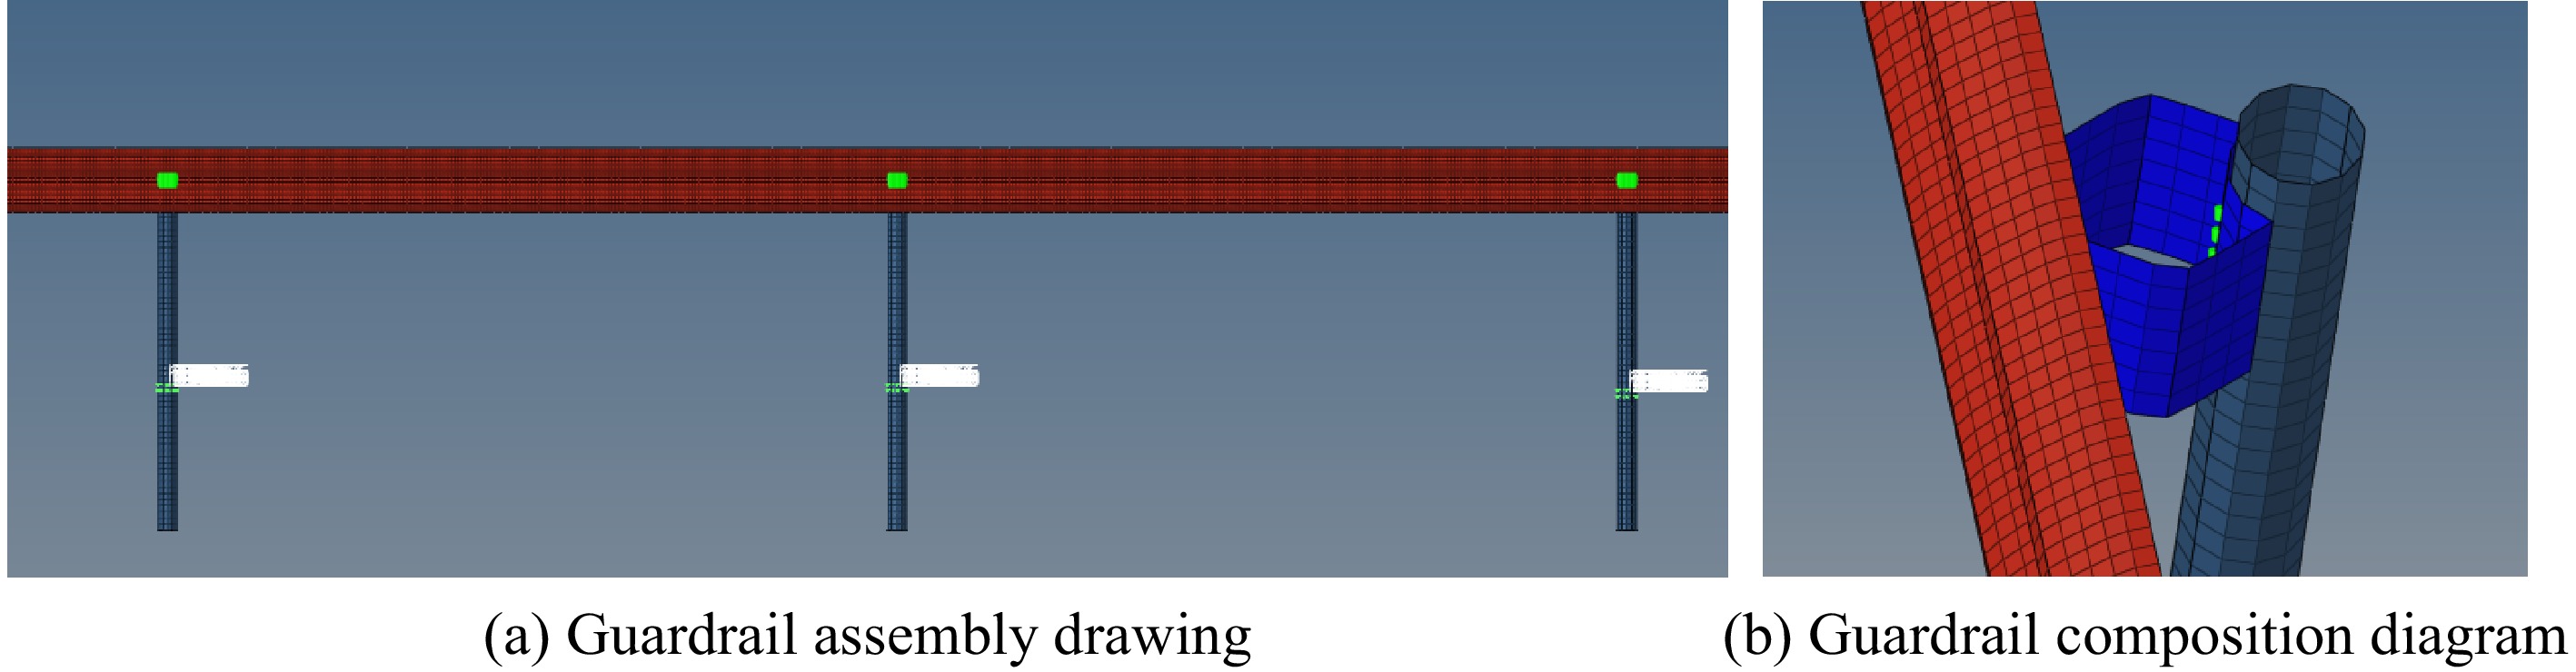
Figure 2.
Guardrail model.
-
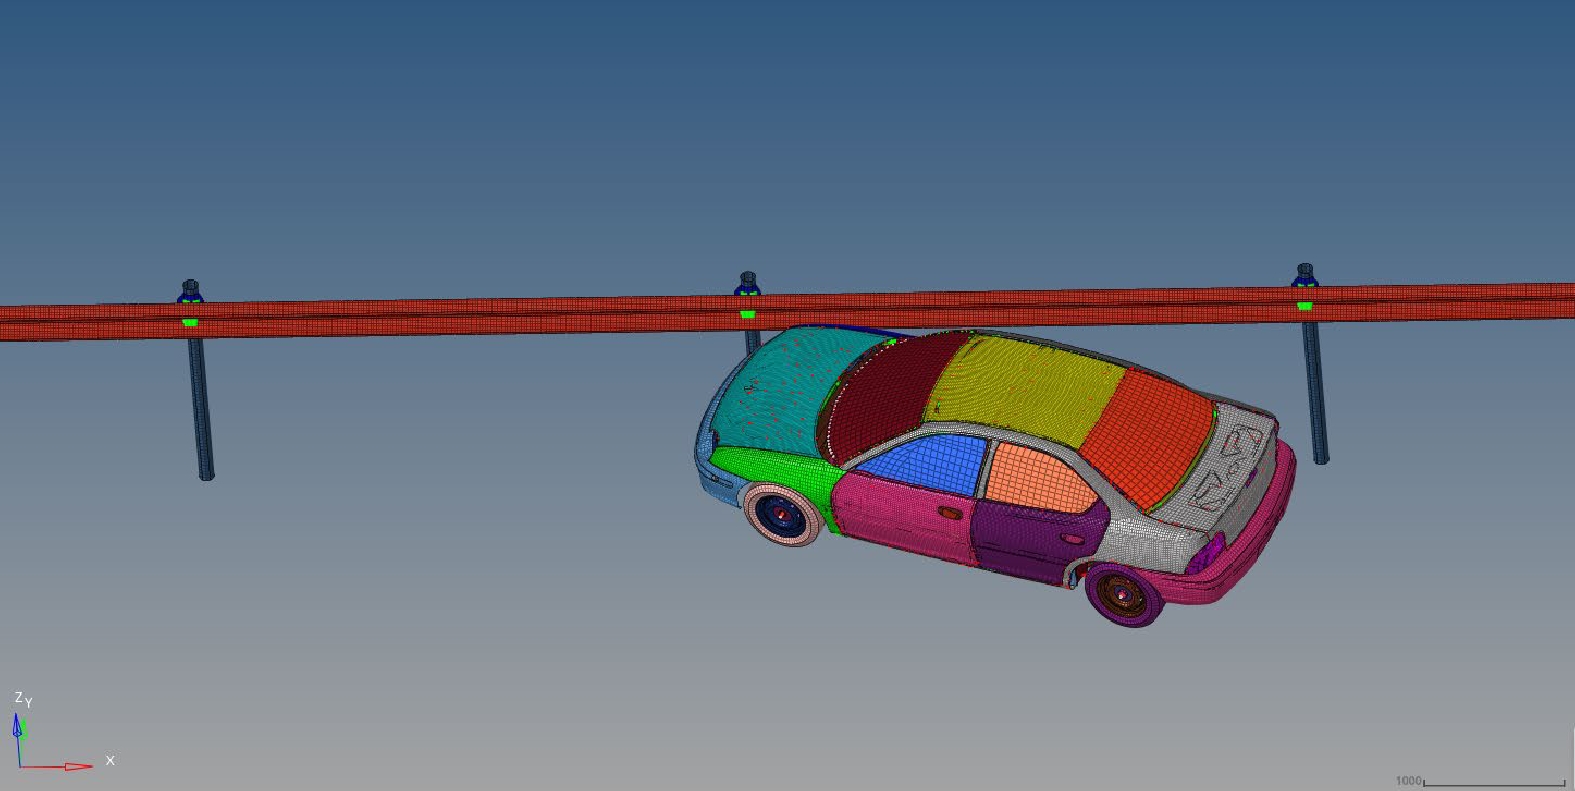
Figure 3.
Coupled vehicle-guardrail model.
-
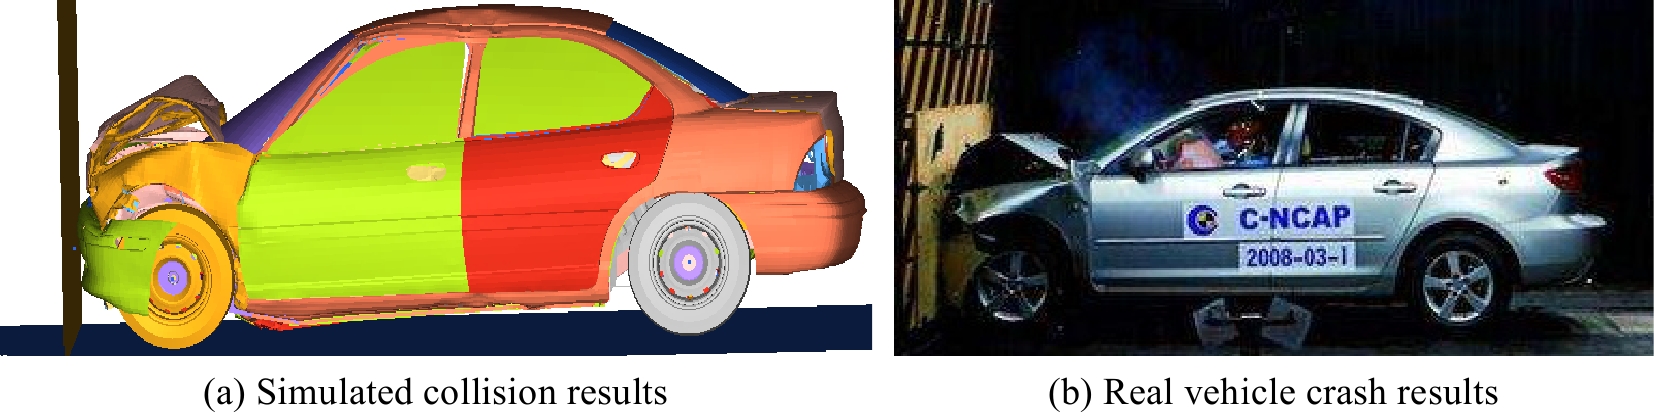
Figure 4.
Vehicle verification experiment.
-
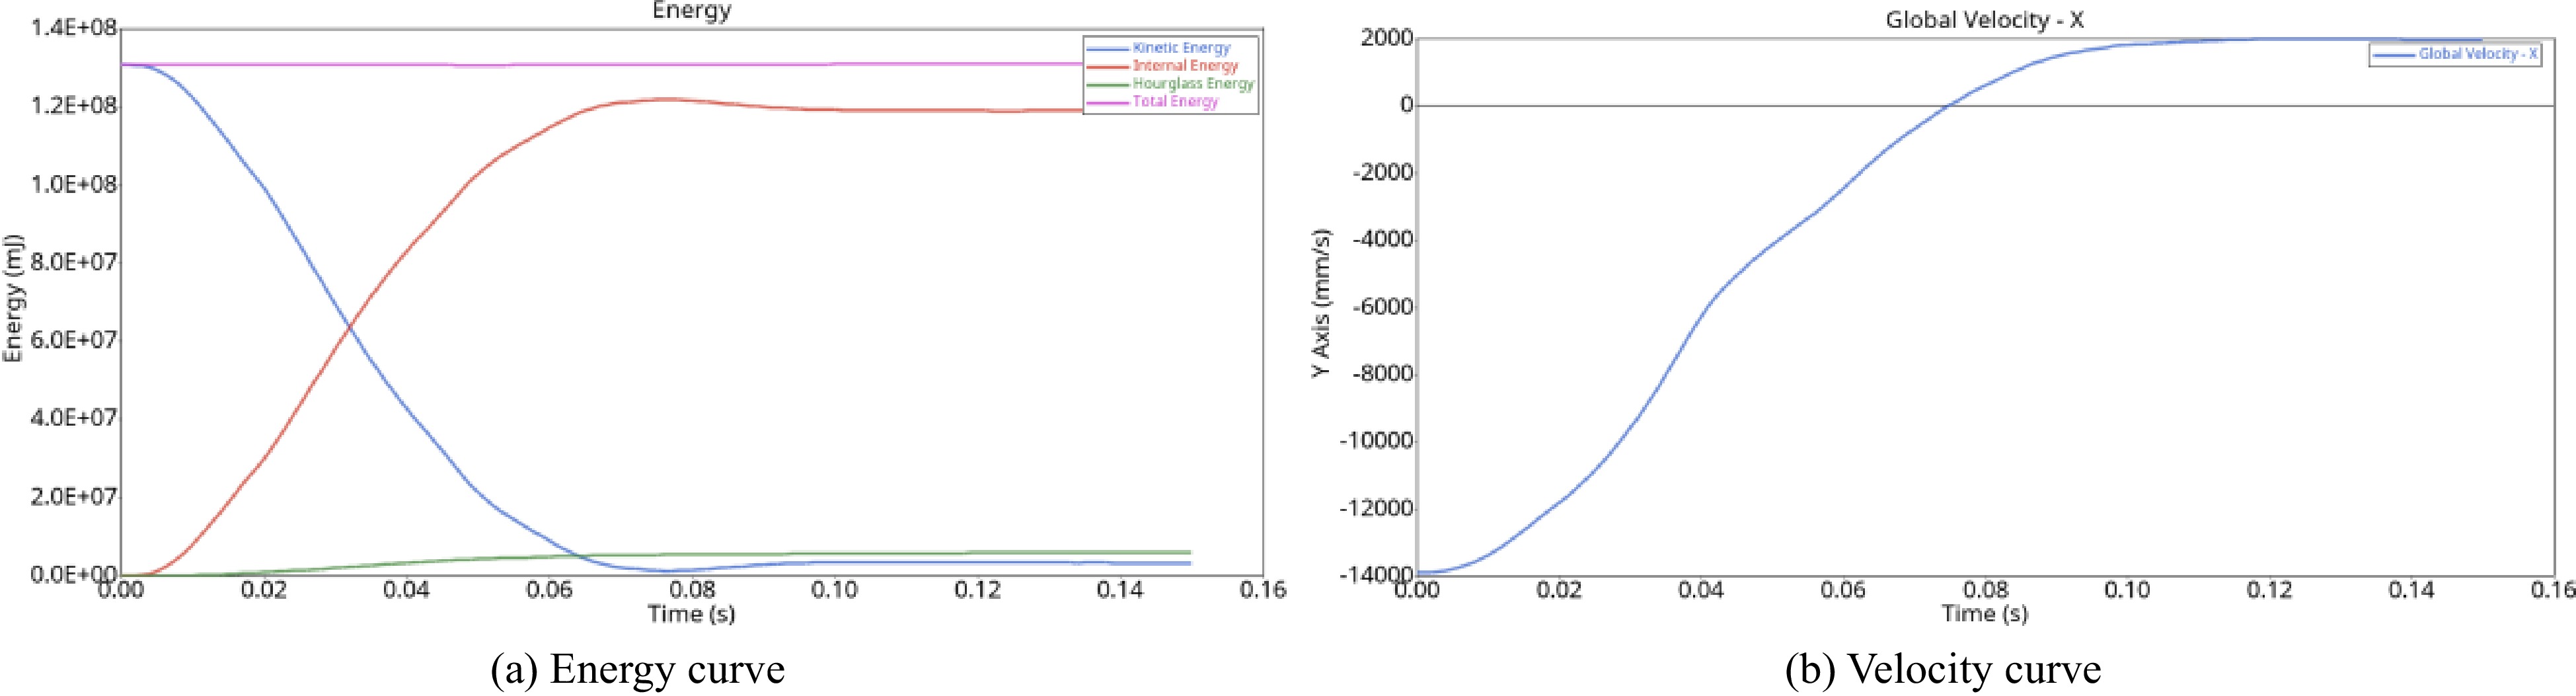
Figure 5.
The collision curve.
-
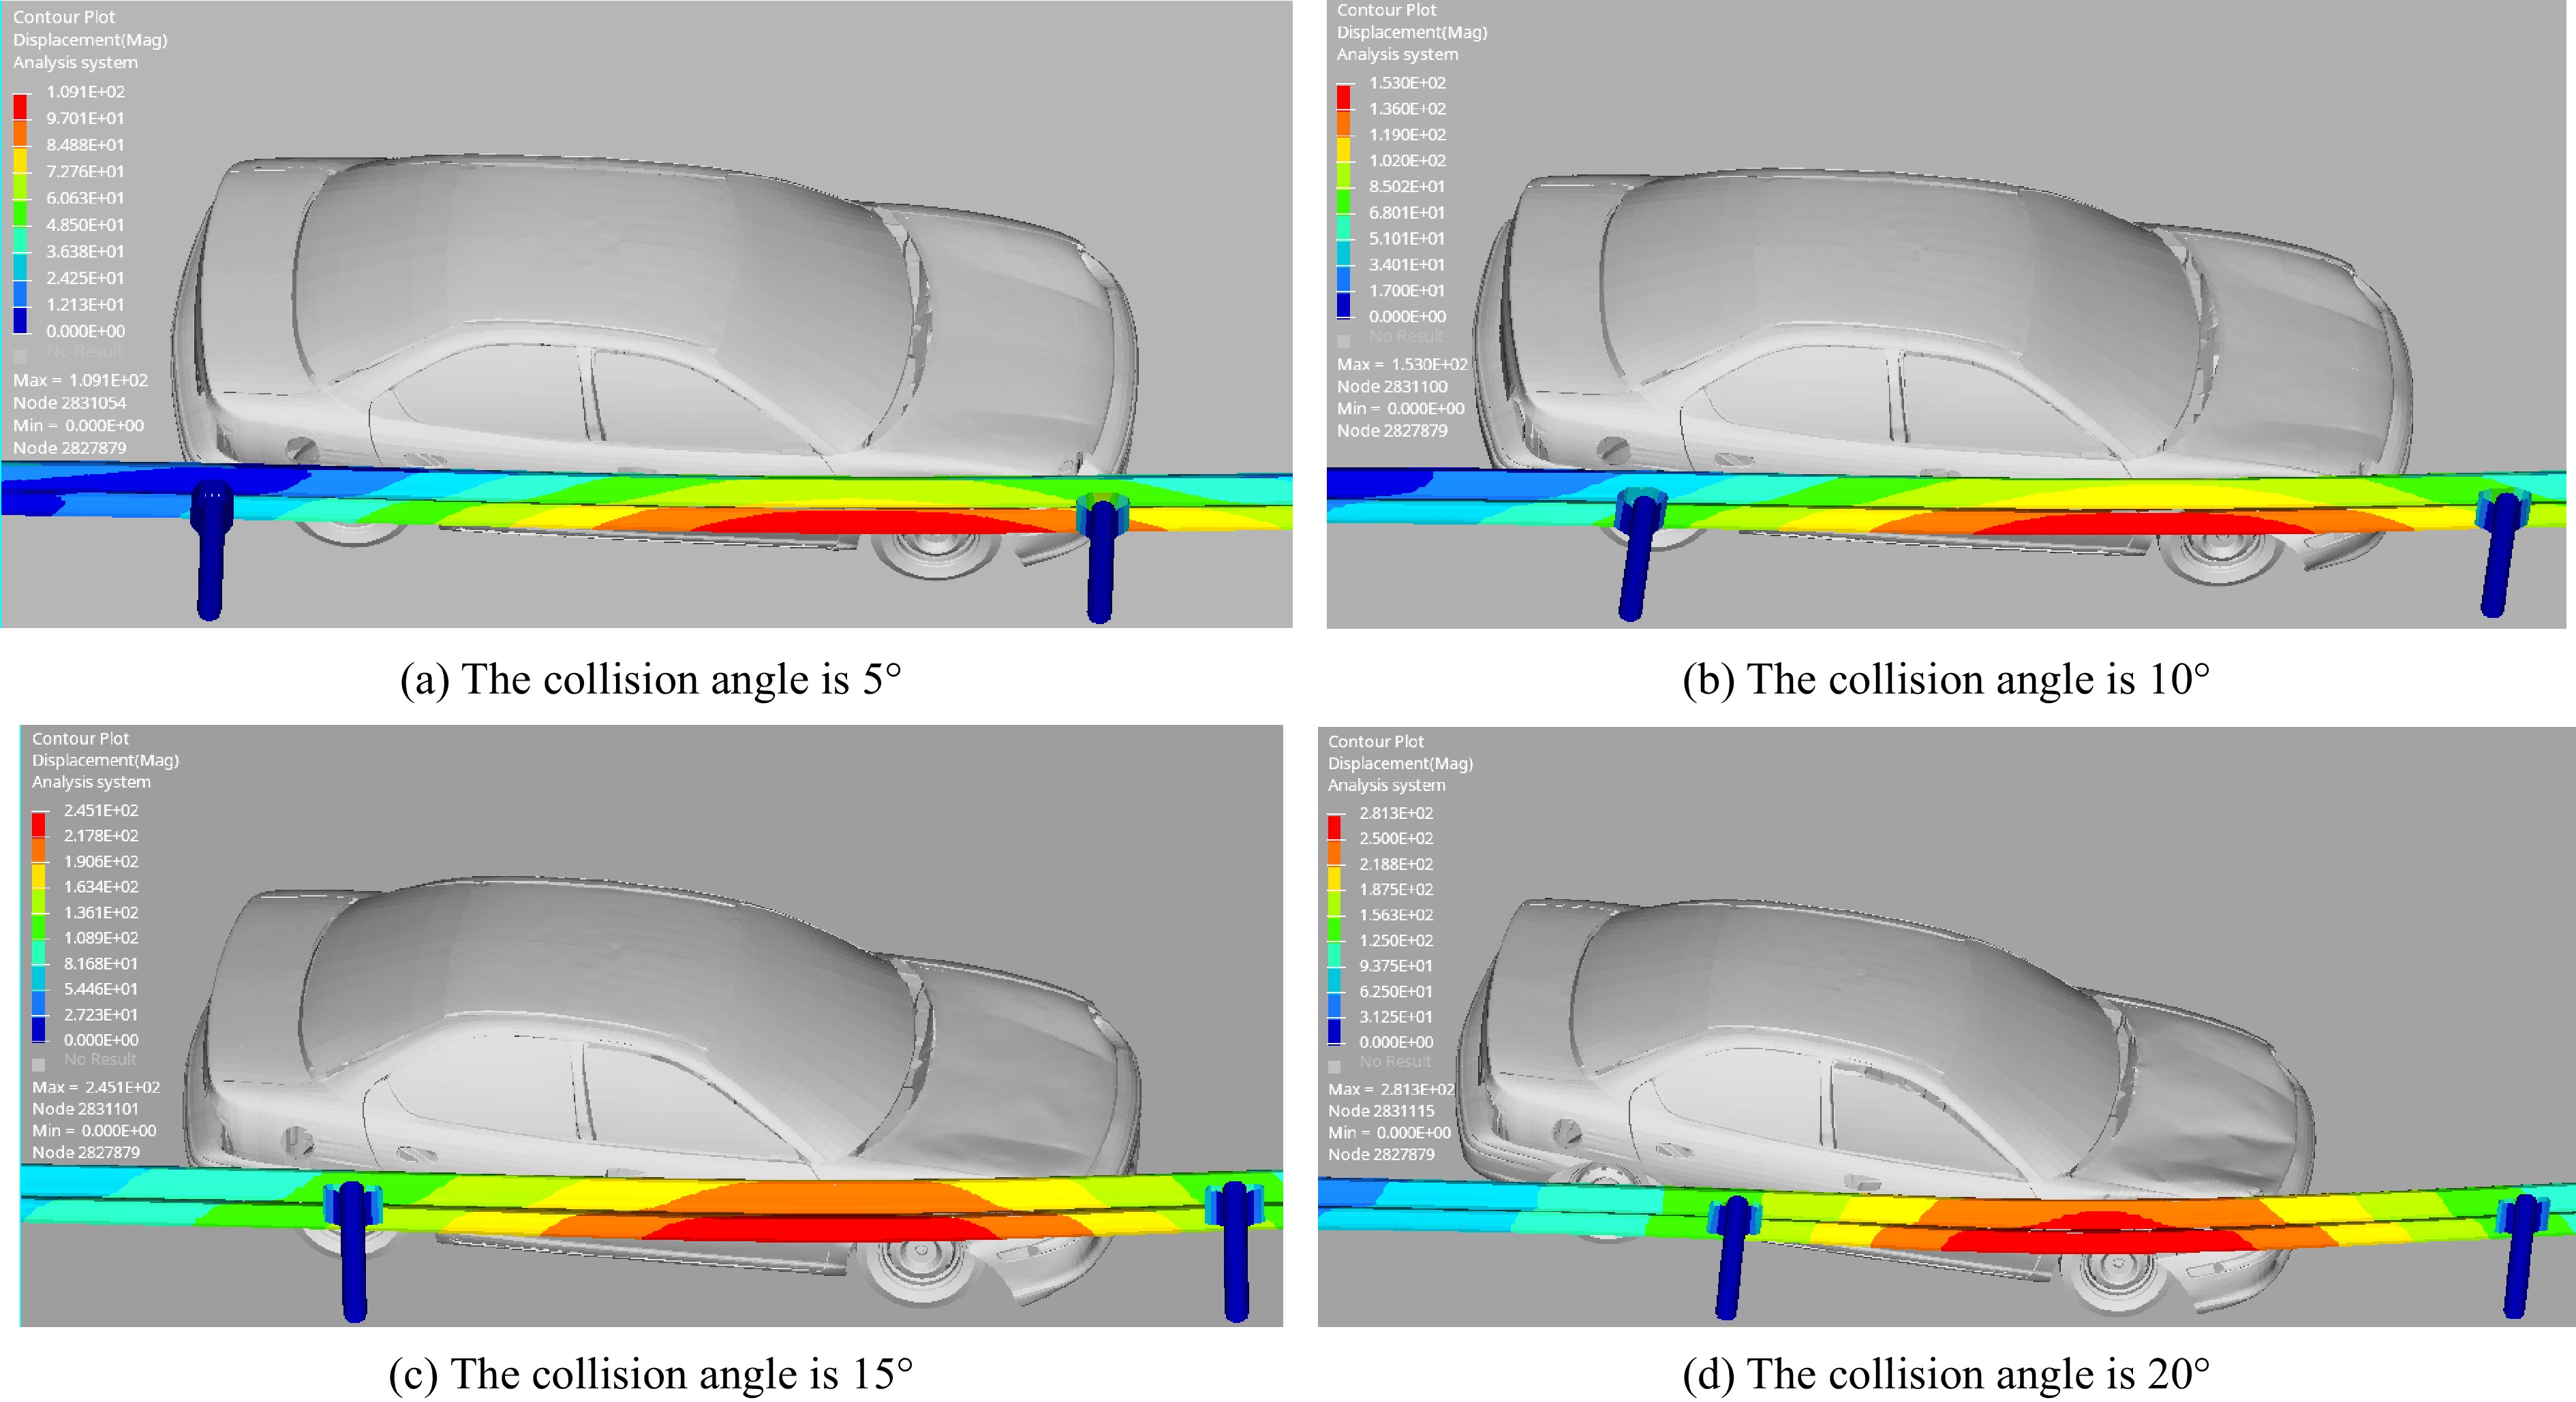
Figure 6.
Deformation of the guardrail at different collision angles (60 km/h).
-
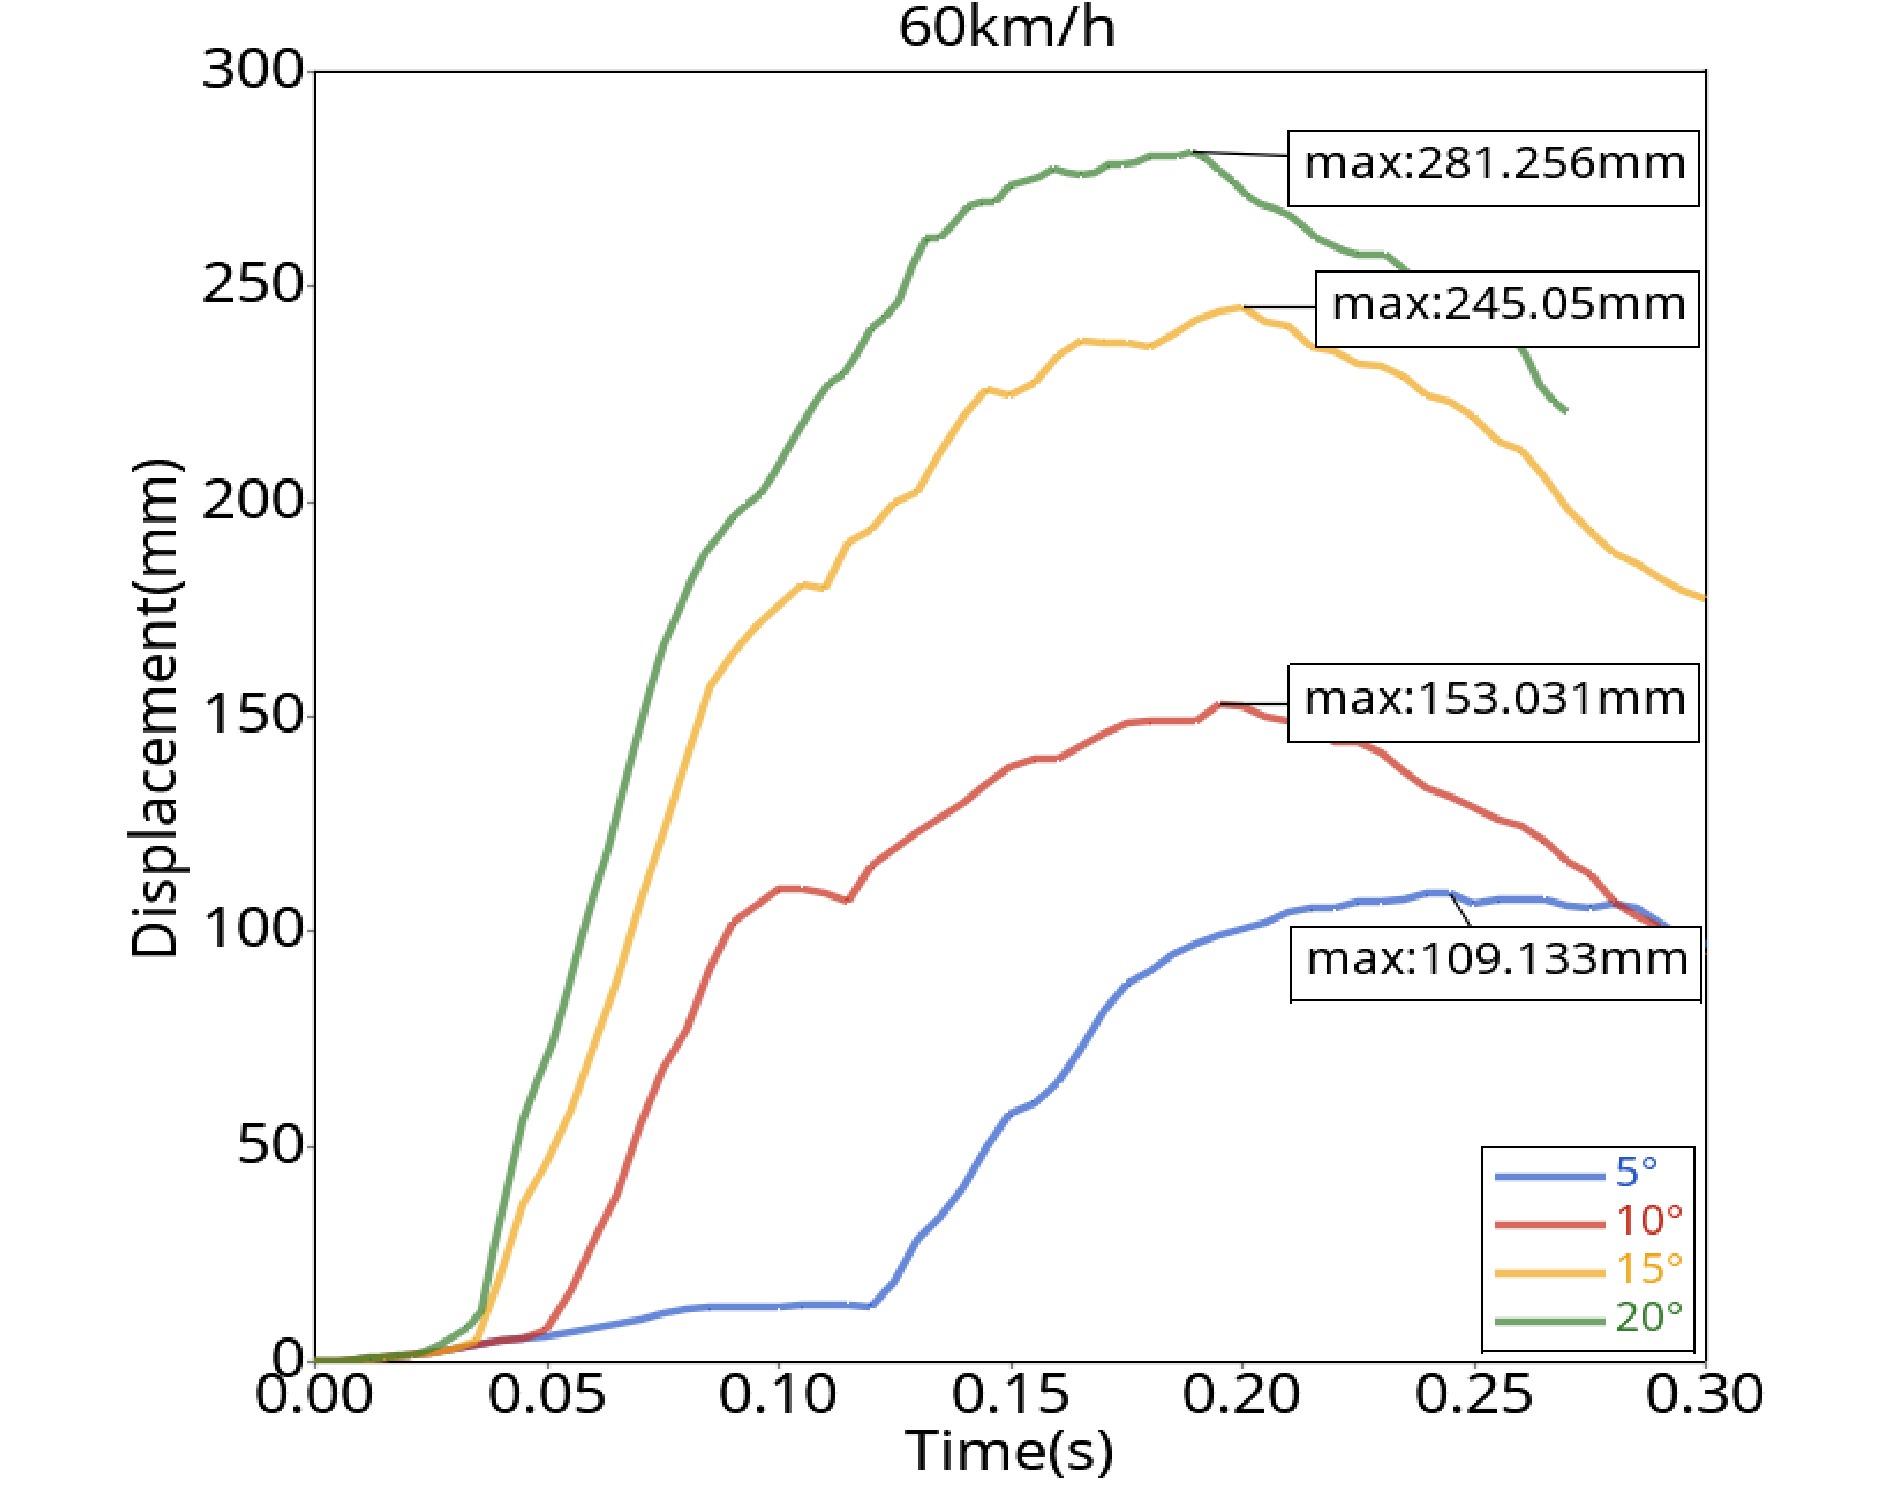
Figure 7.
Guardrail displacement curve (60 km/h).
-
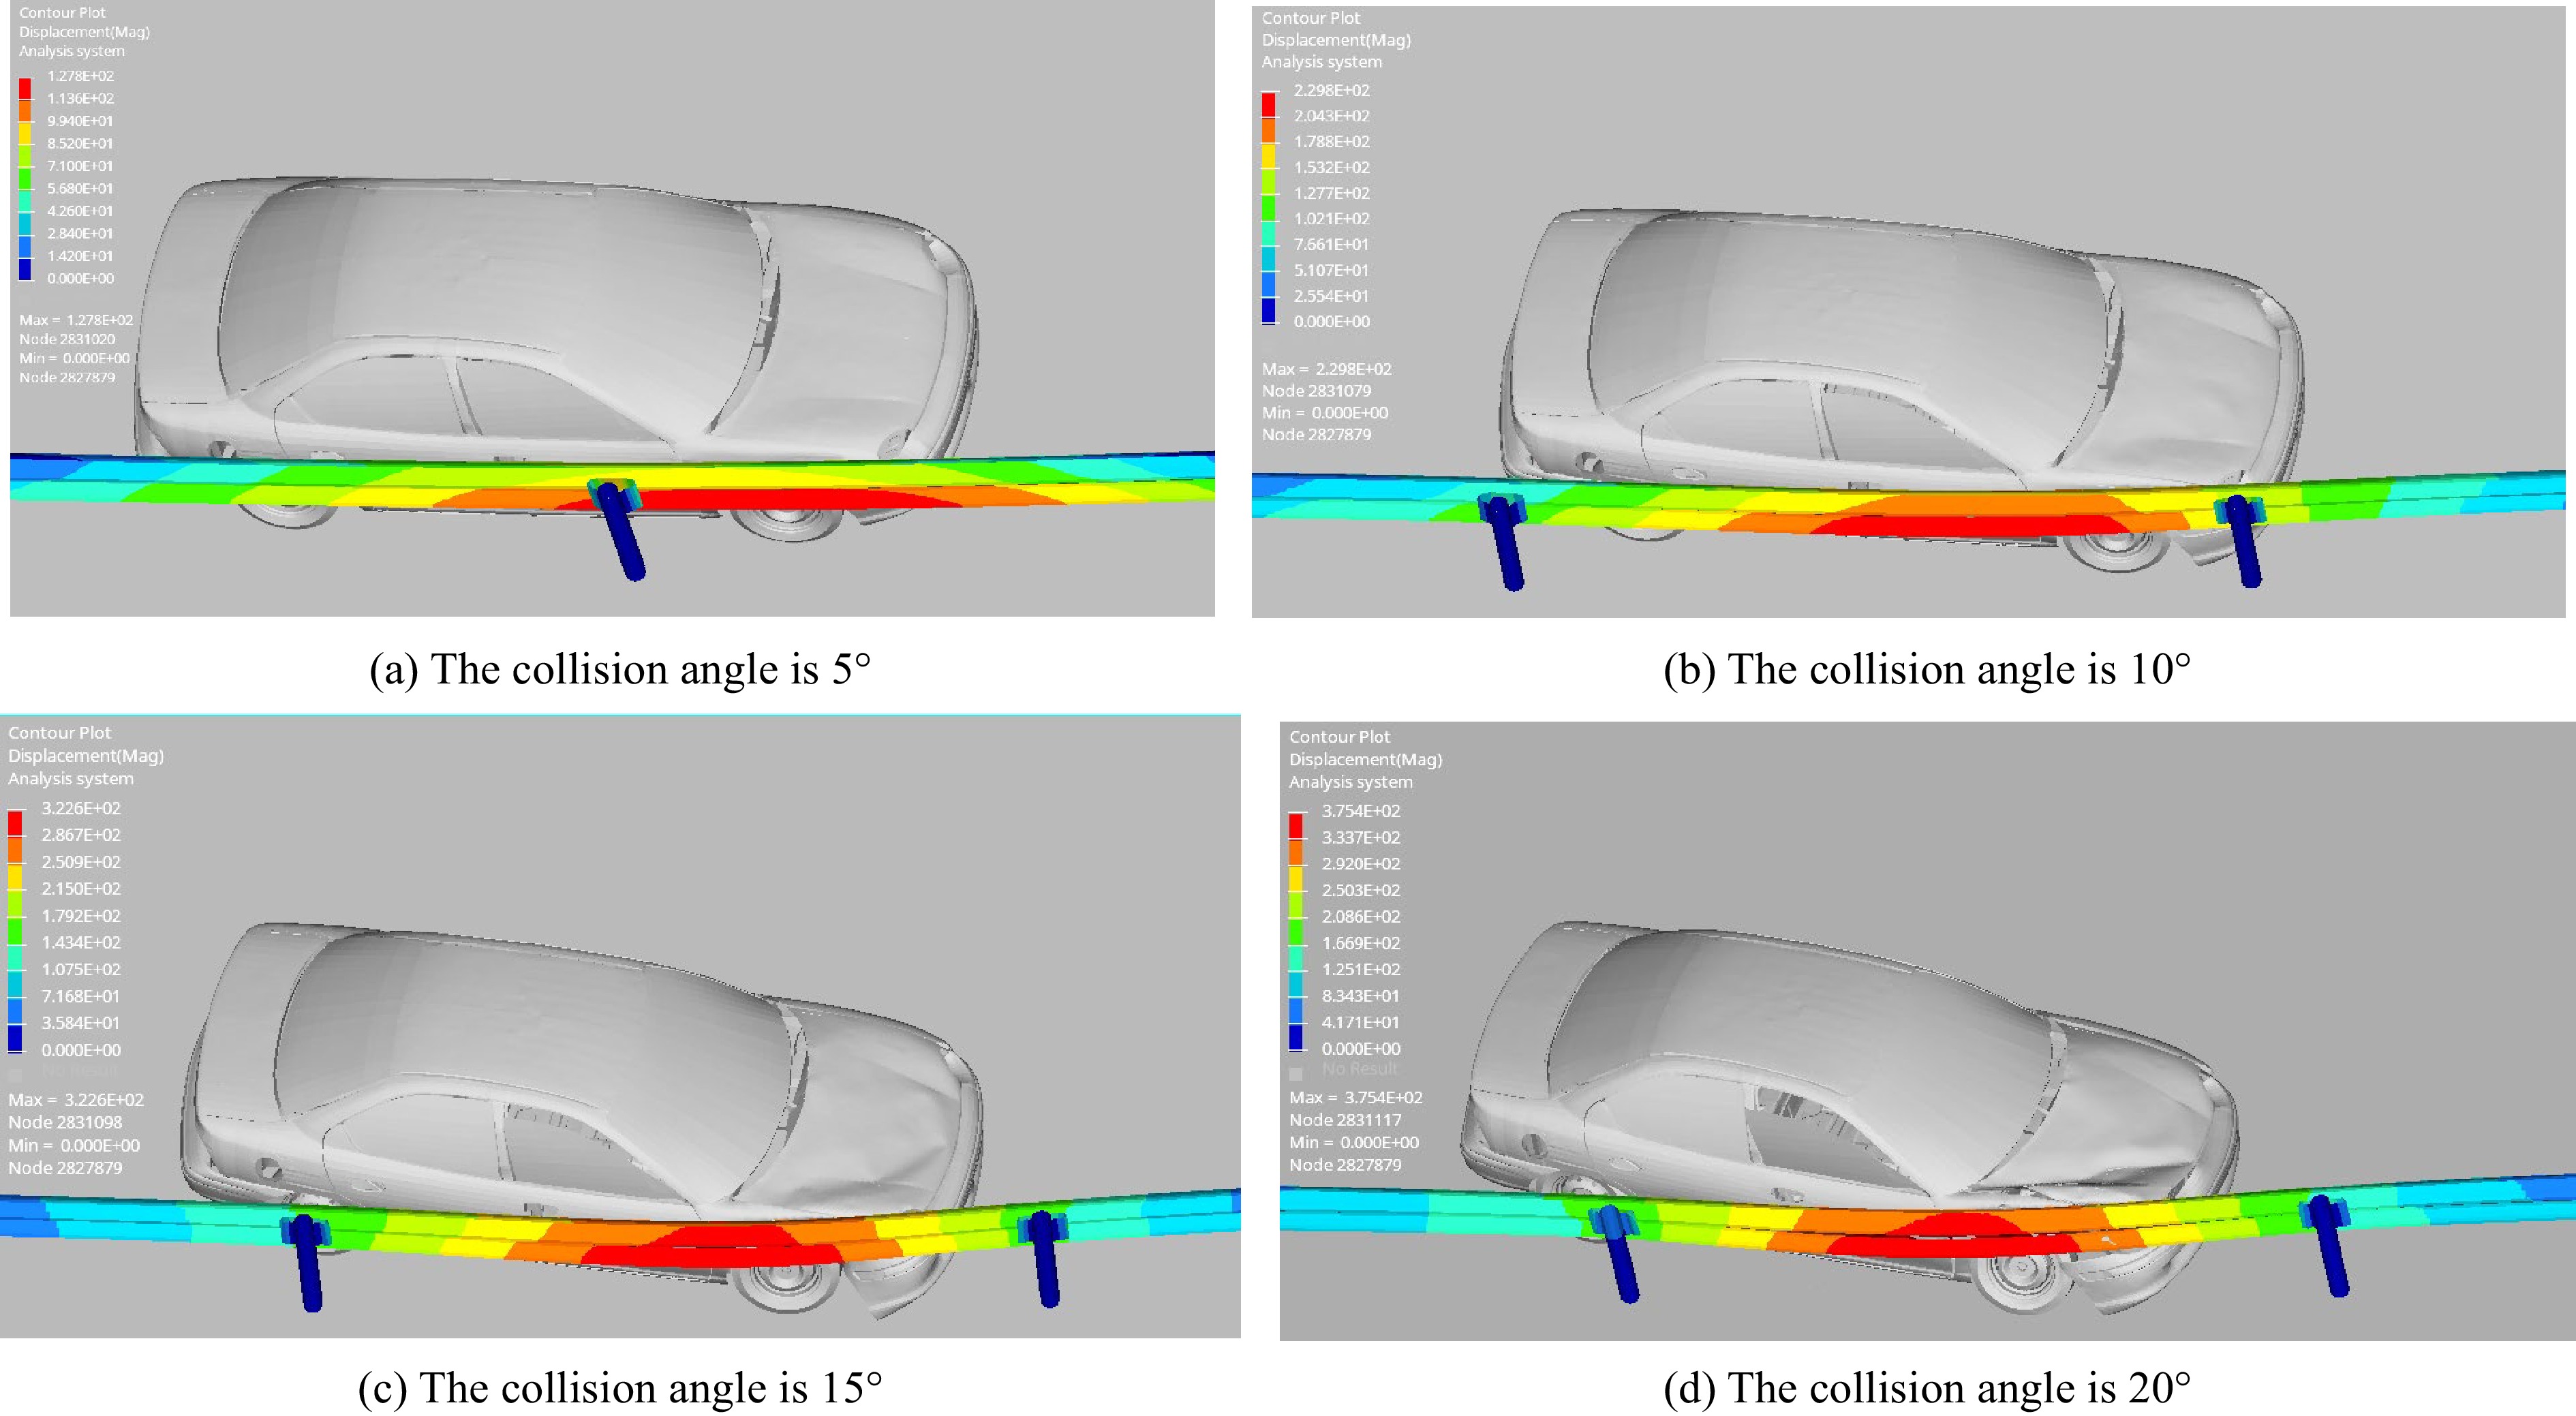
Figure 8.
Deformation of the guardrail at different collision angles (80 km/h).
-
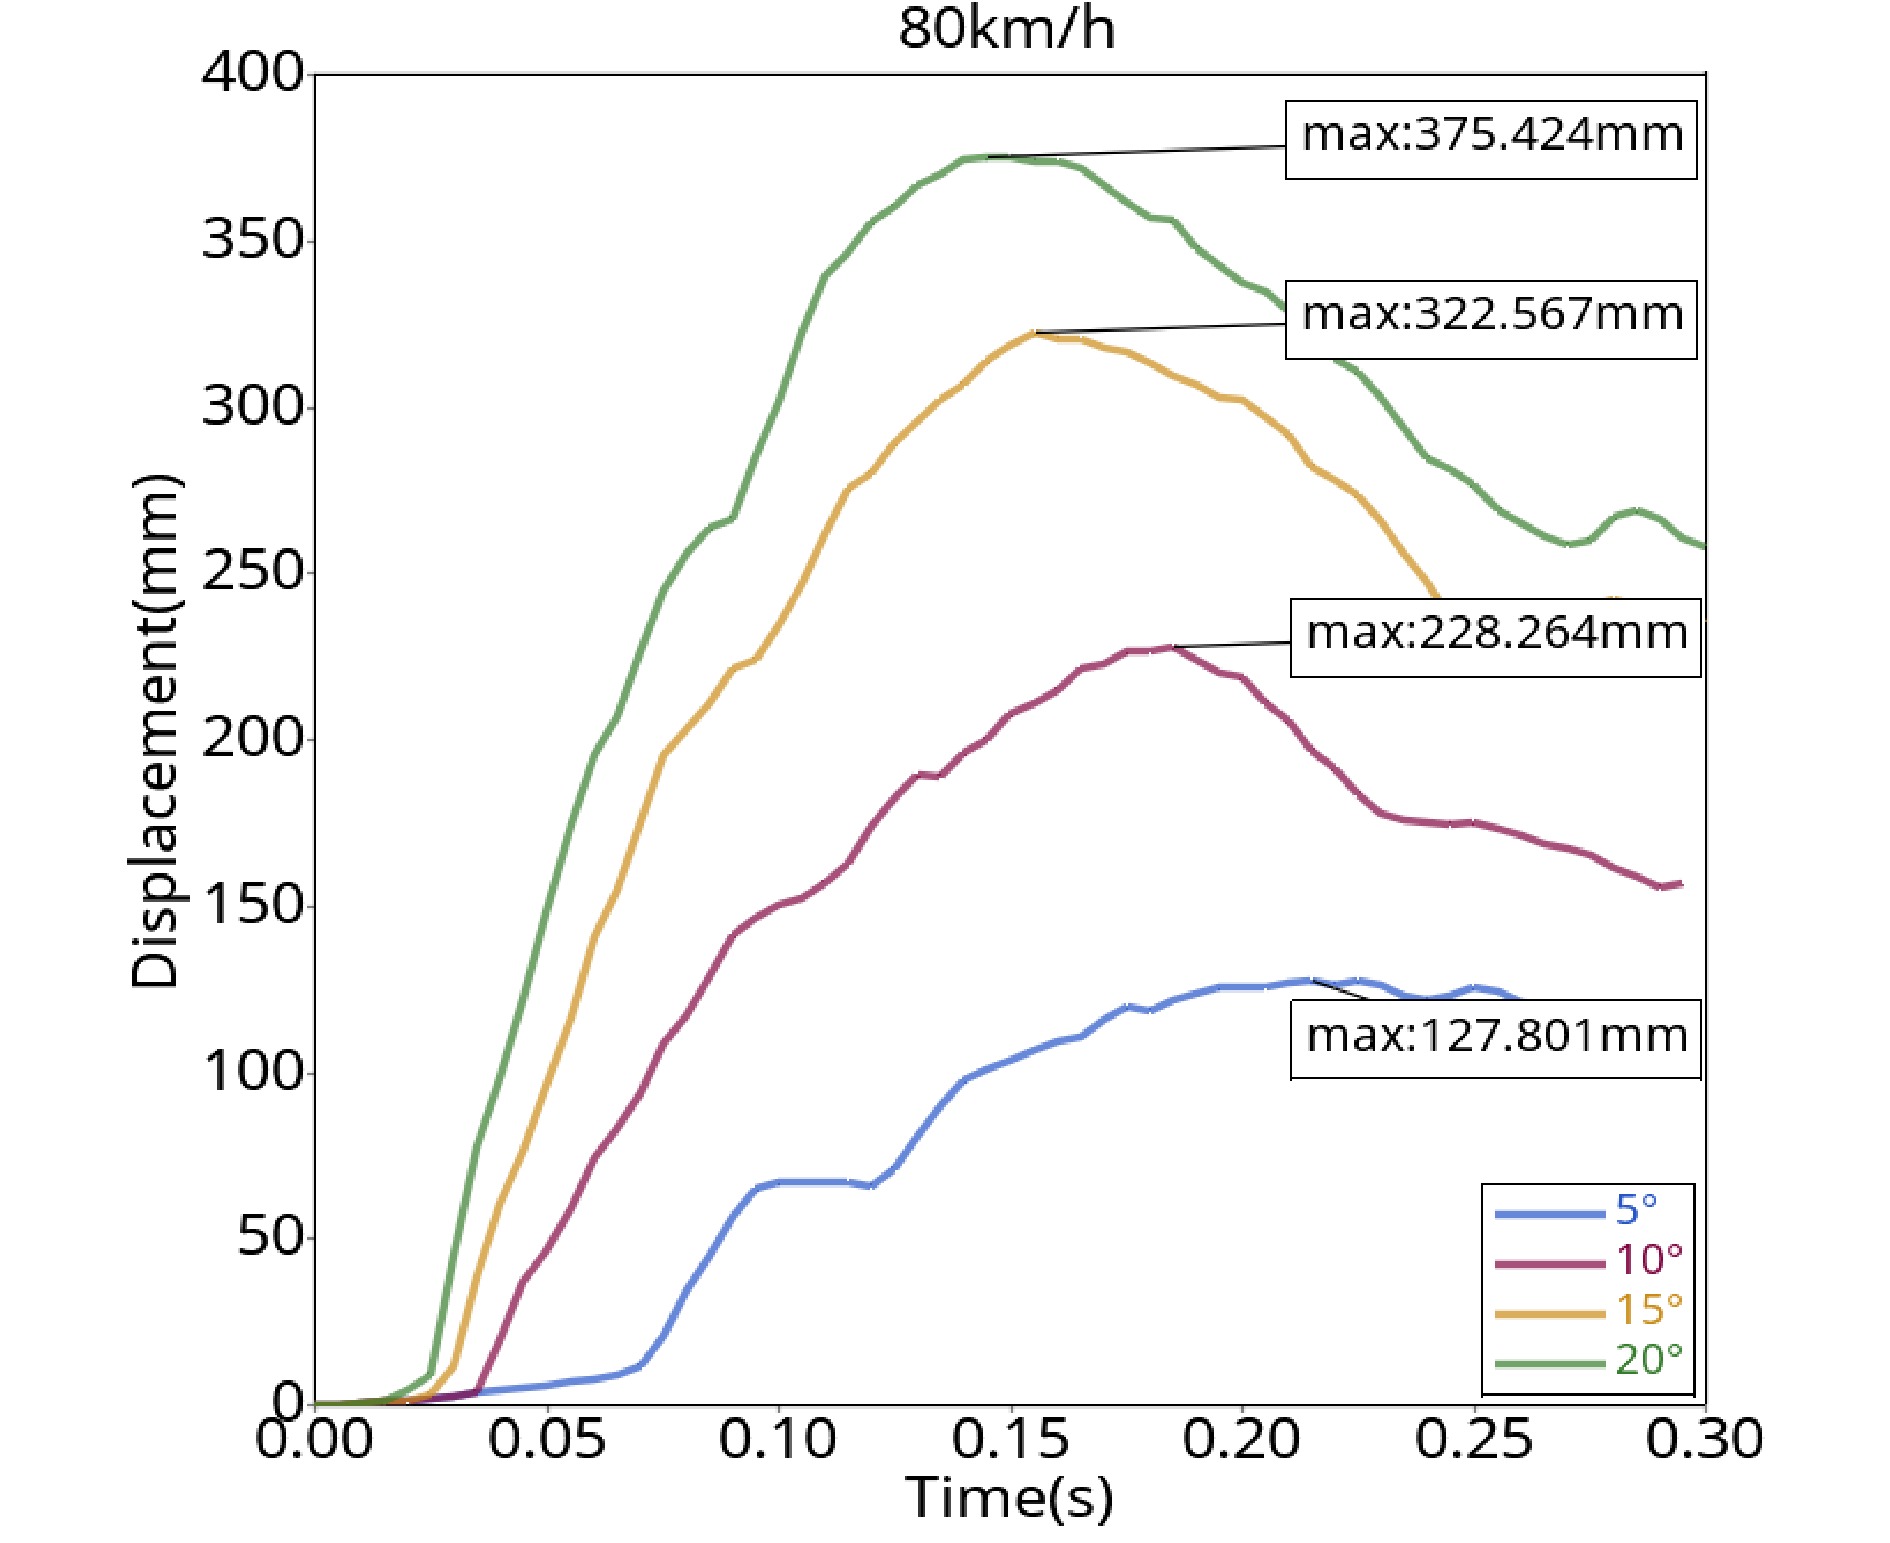
Figure 9.
Guardrail displacement curve (80 km/h).
-
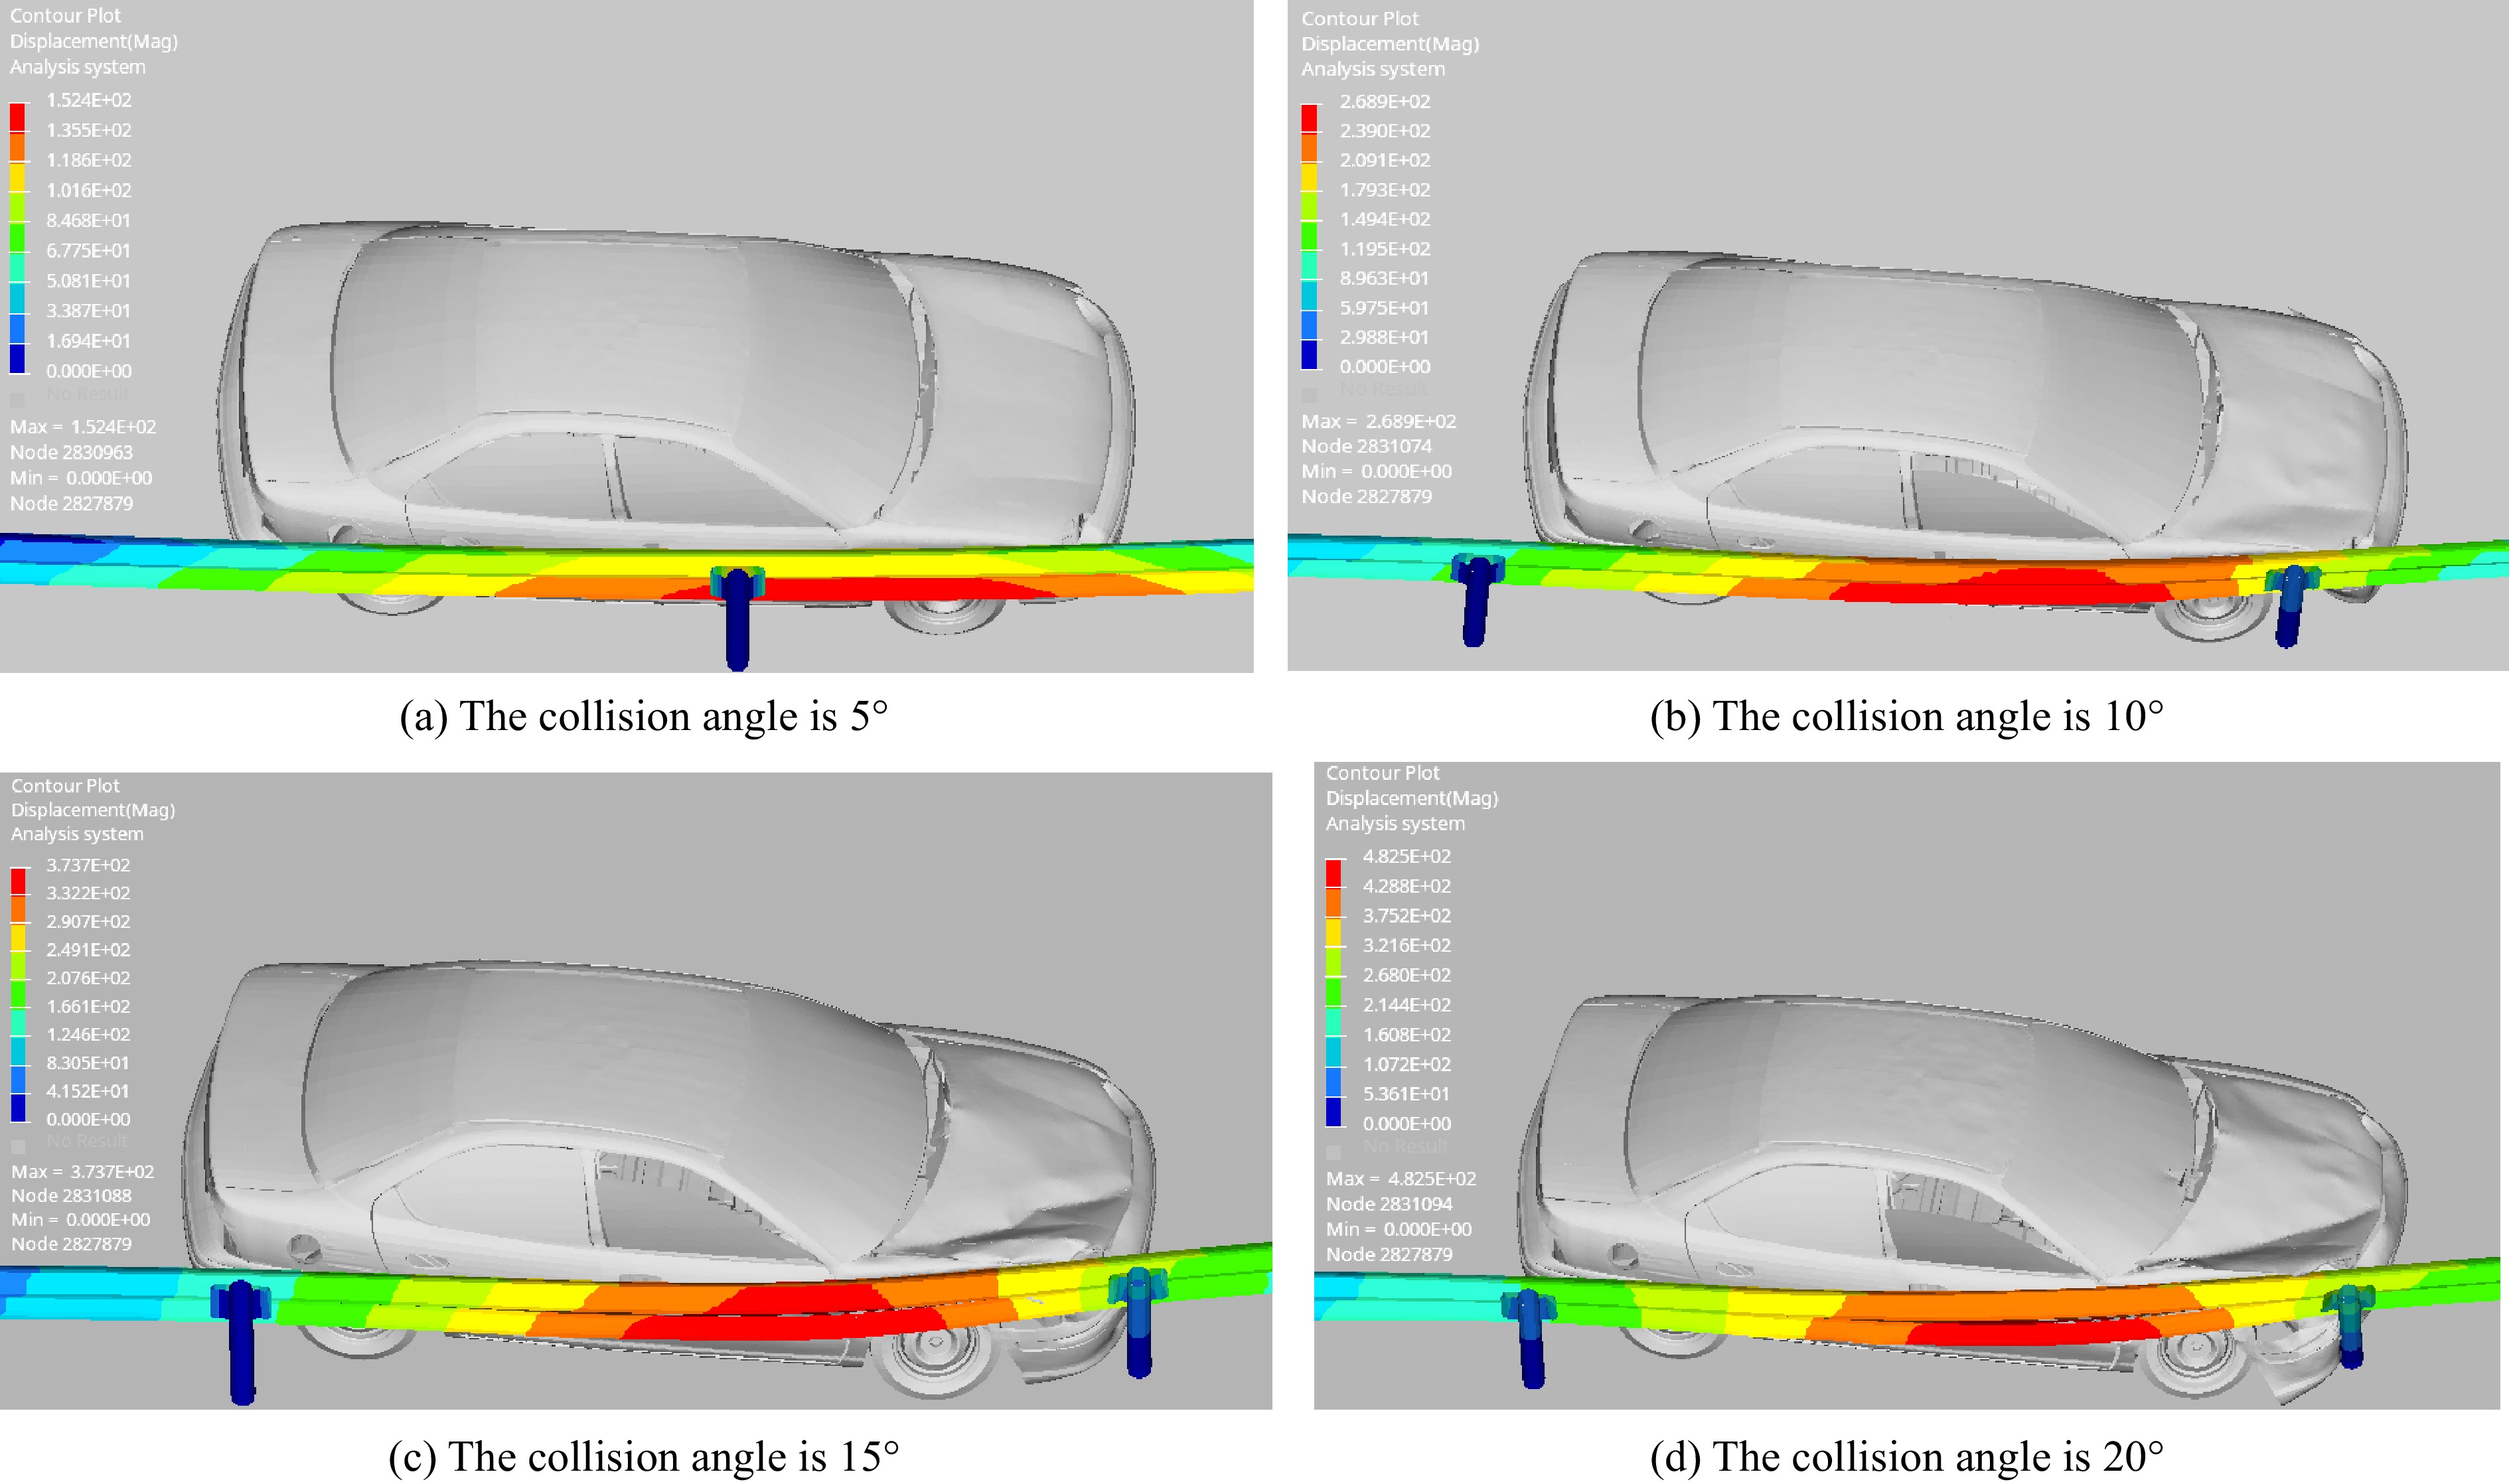
Figure 10.
Deformation of the guardrail impacted at different angles (100 km/h).
-
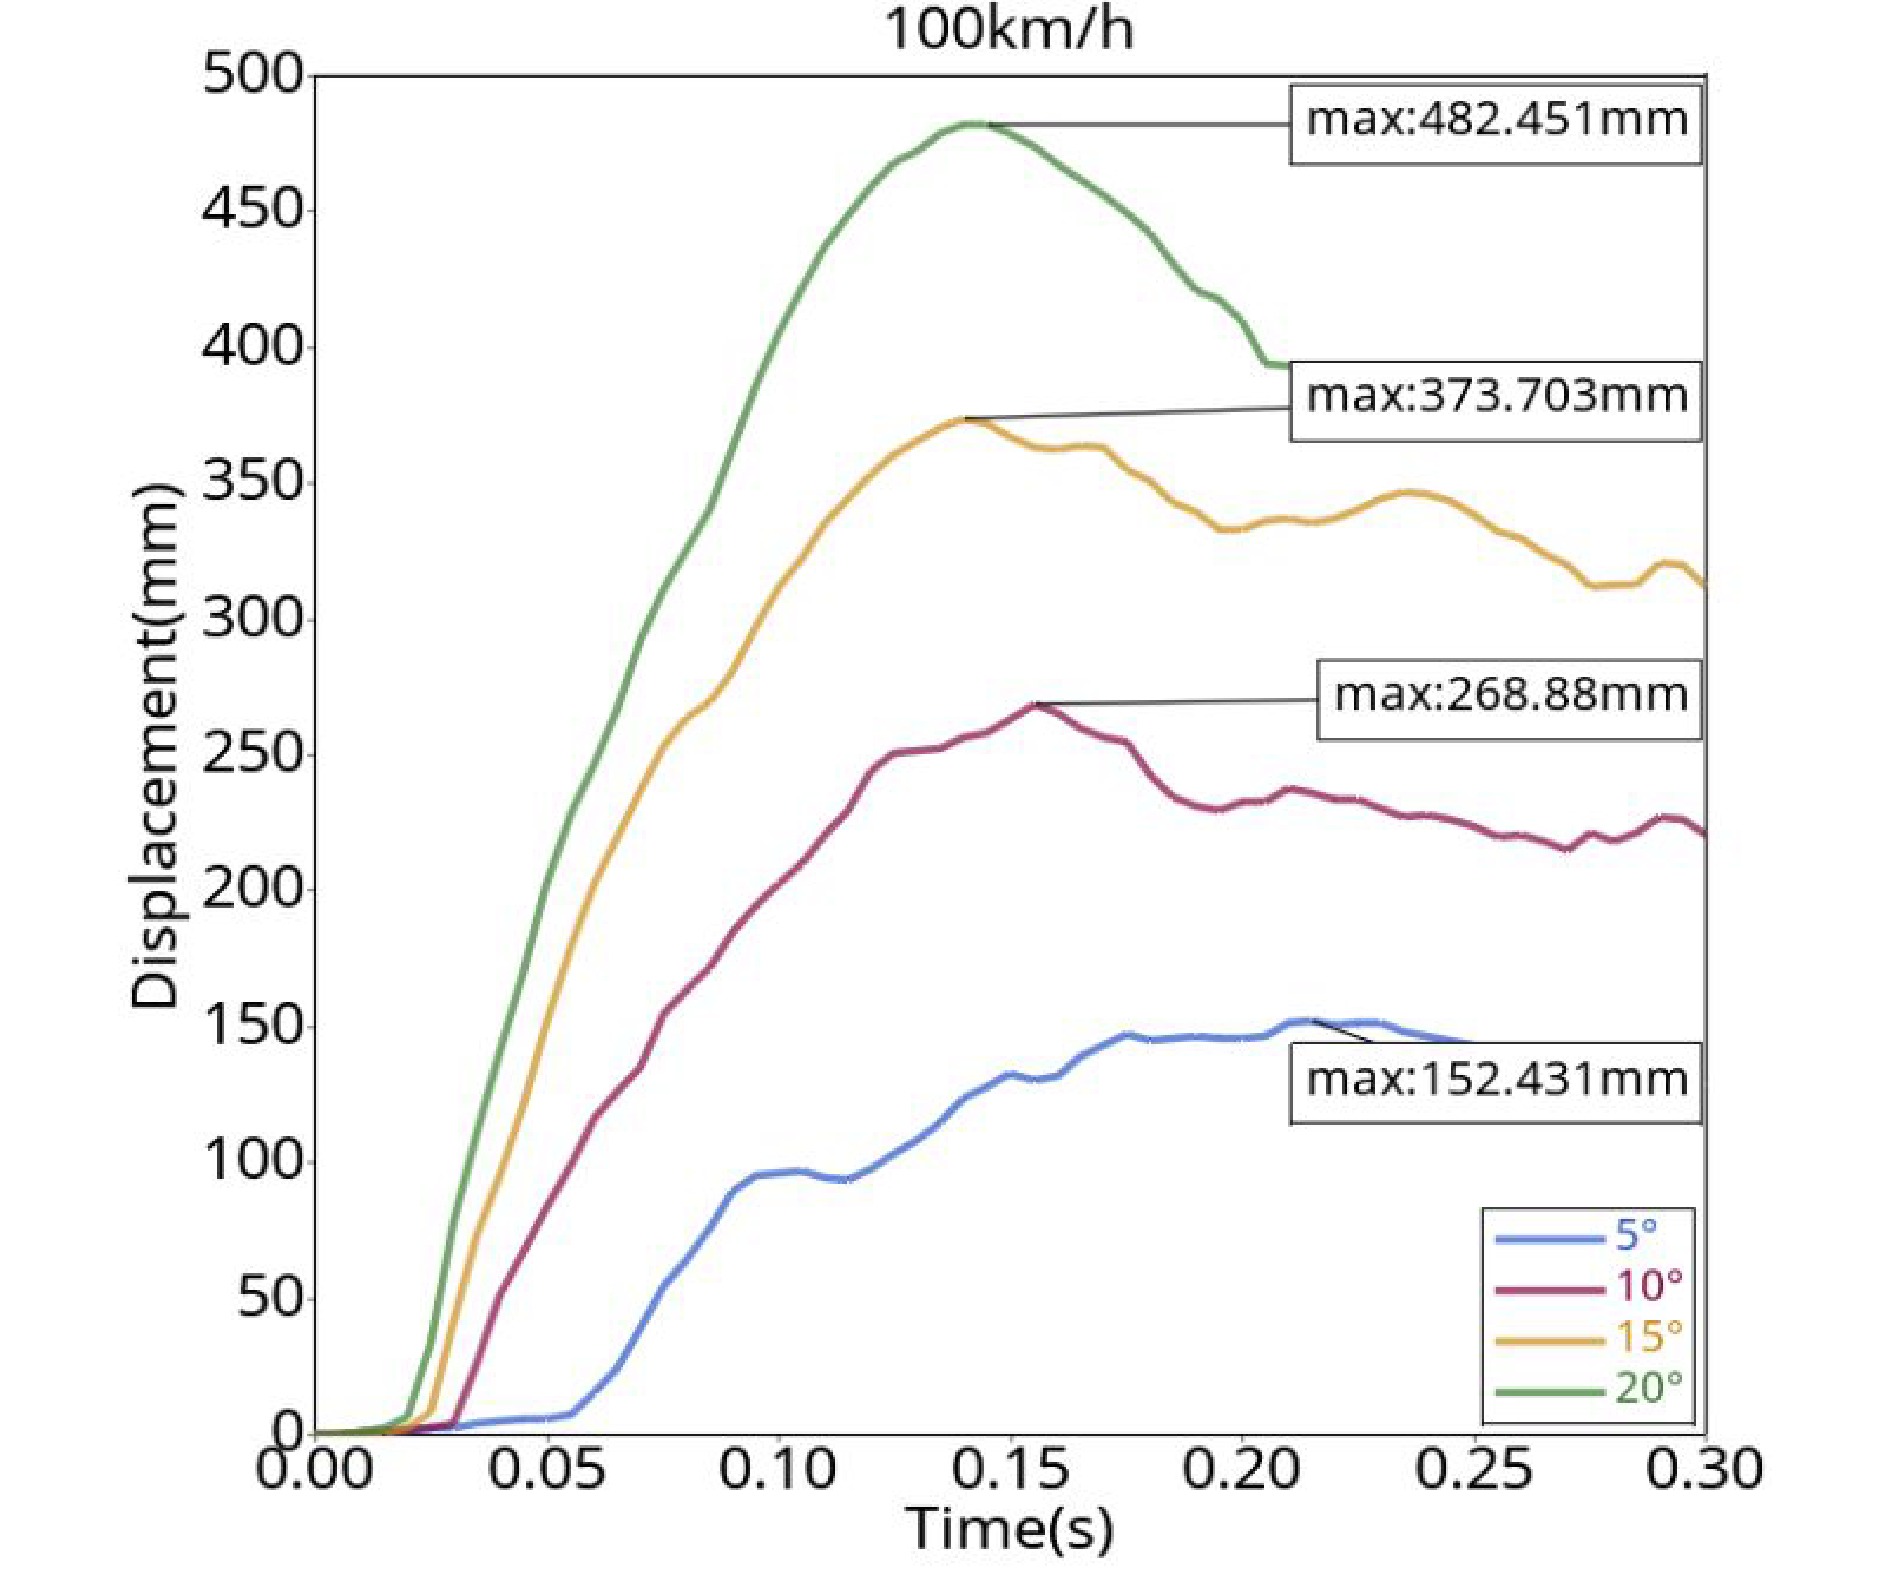
Figure 11.
Guardrail displacement curve (100 km/h).
-
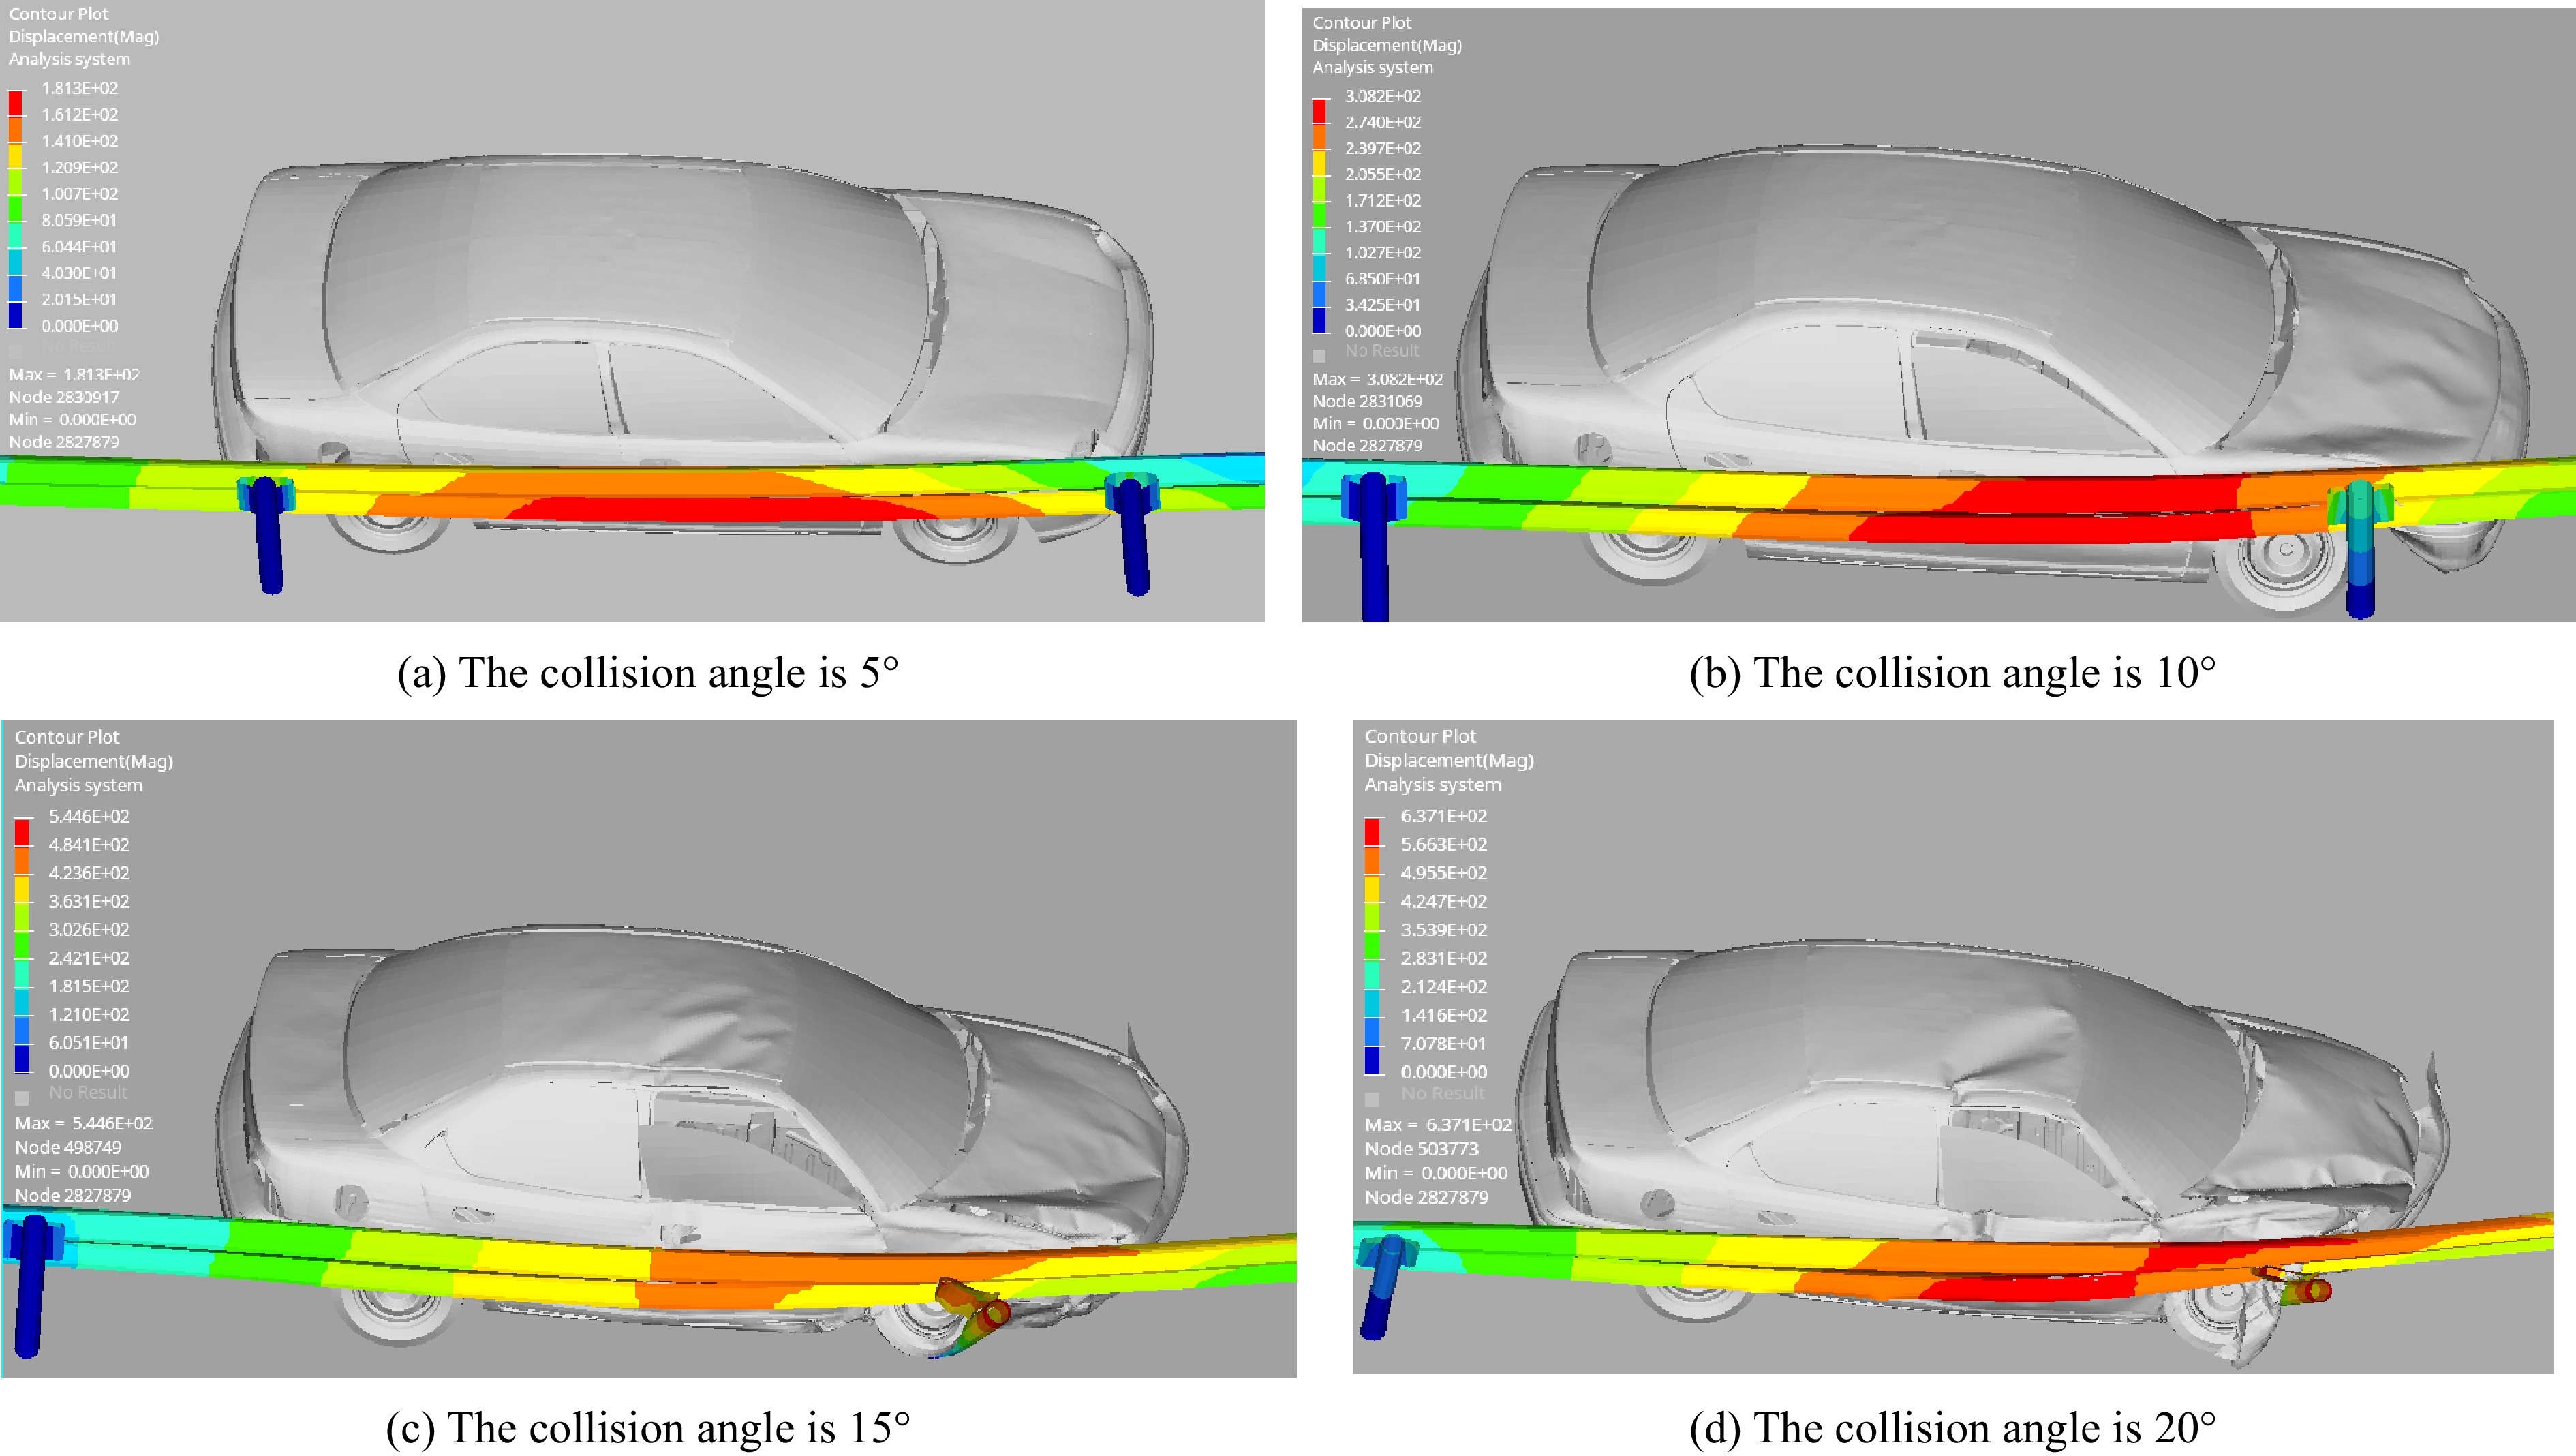
Figure 12.
Deformation of the guardrail impacted at different angles (120 km/h).
-
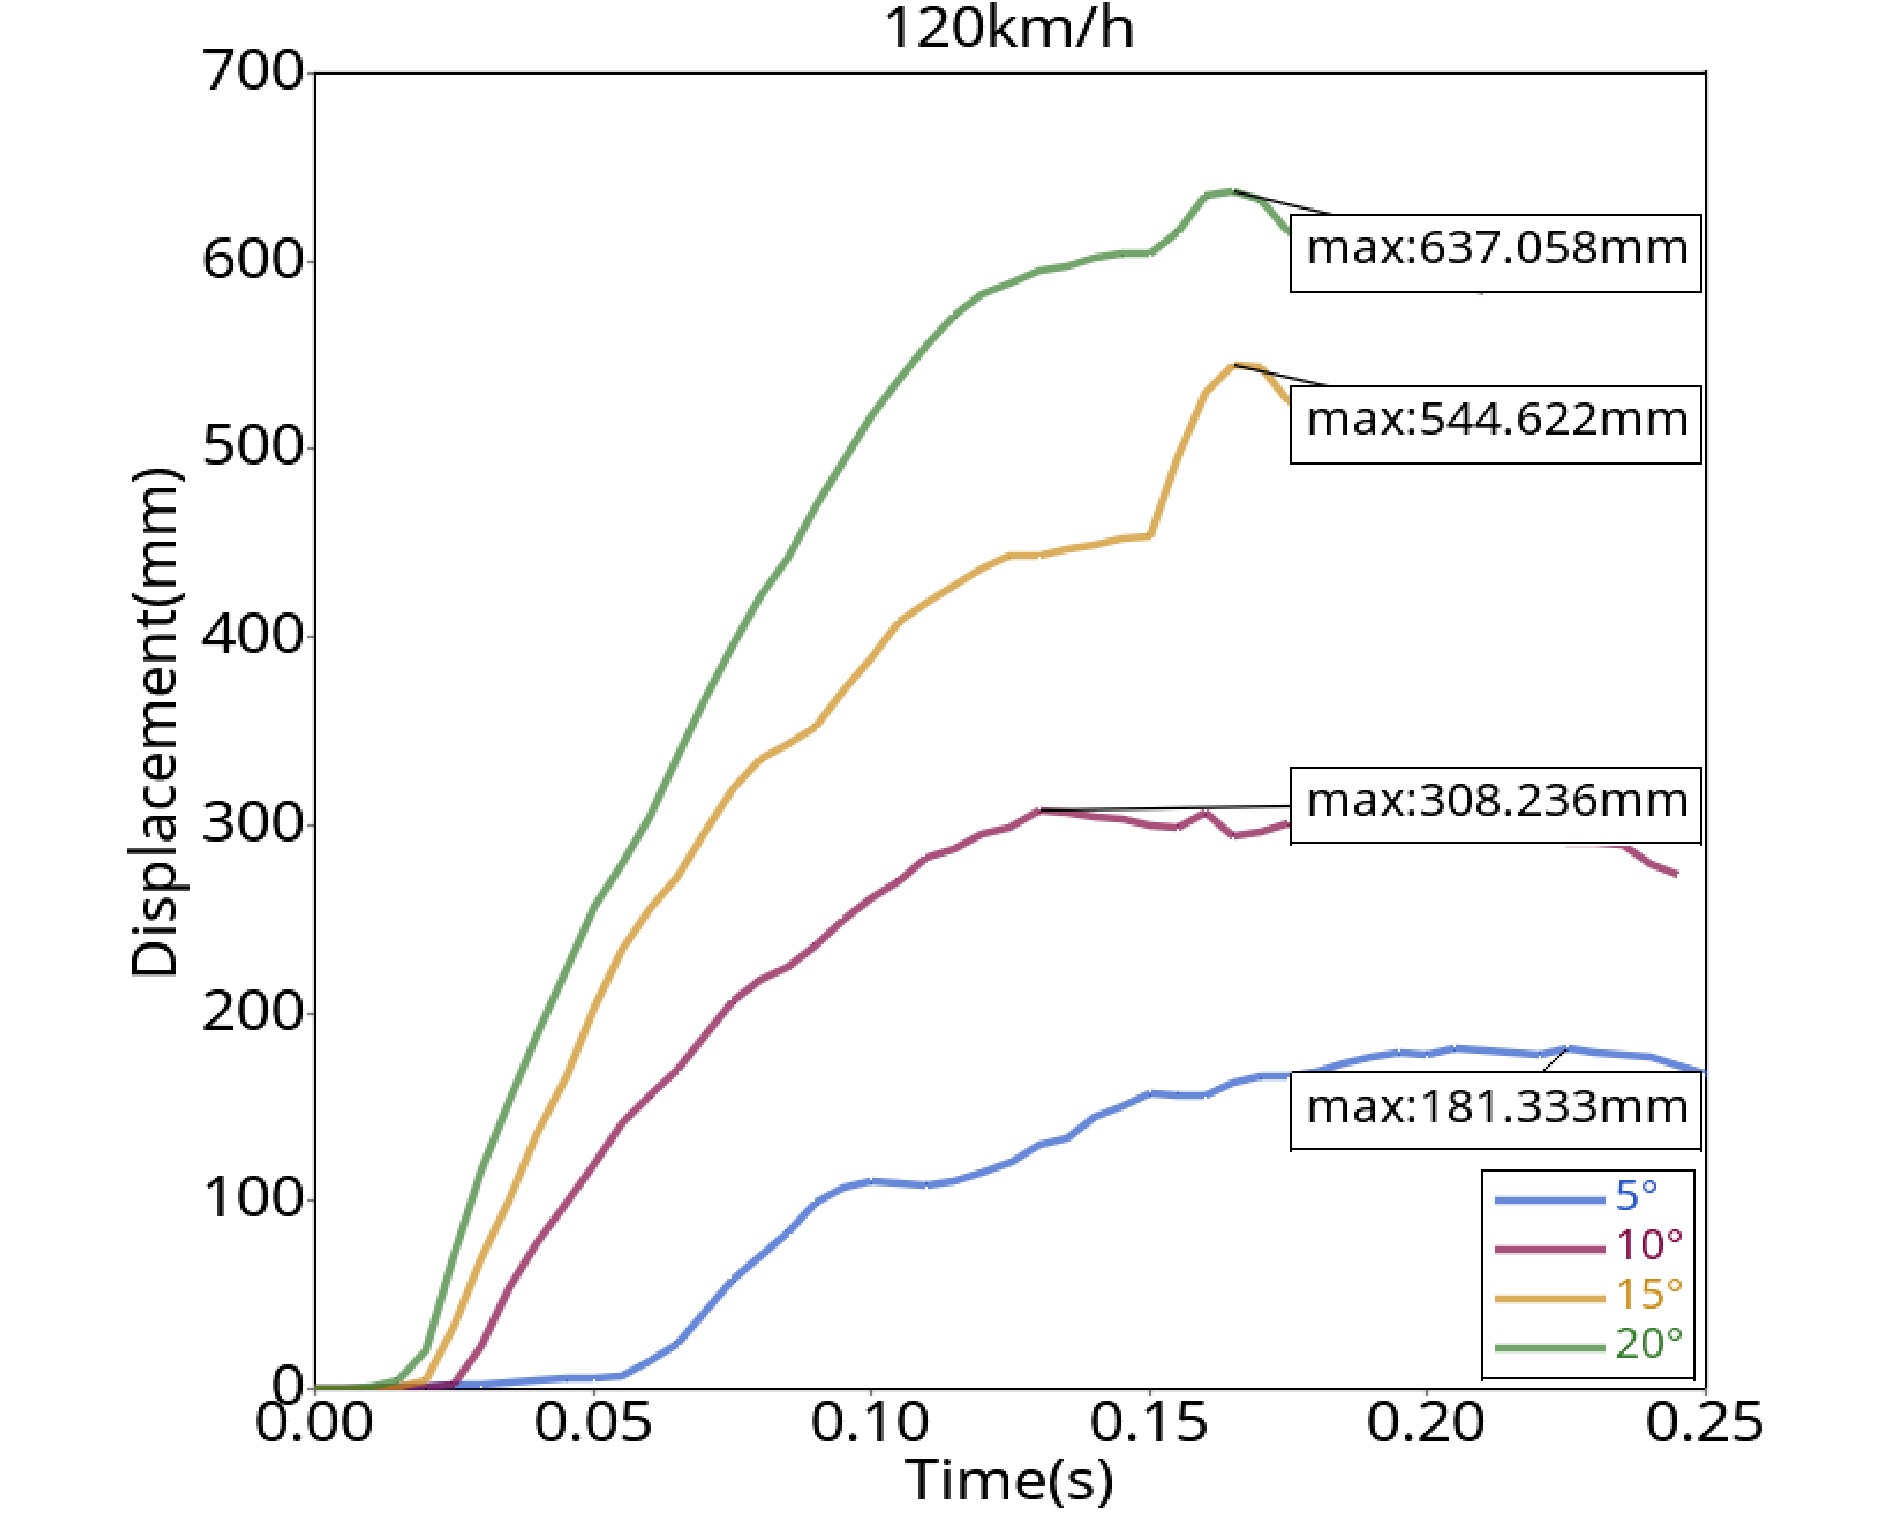
Figure 13.
Guardrail displacement curve (120 km/h).
-
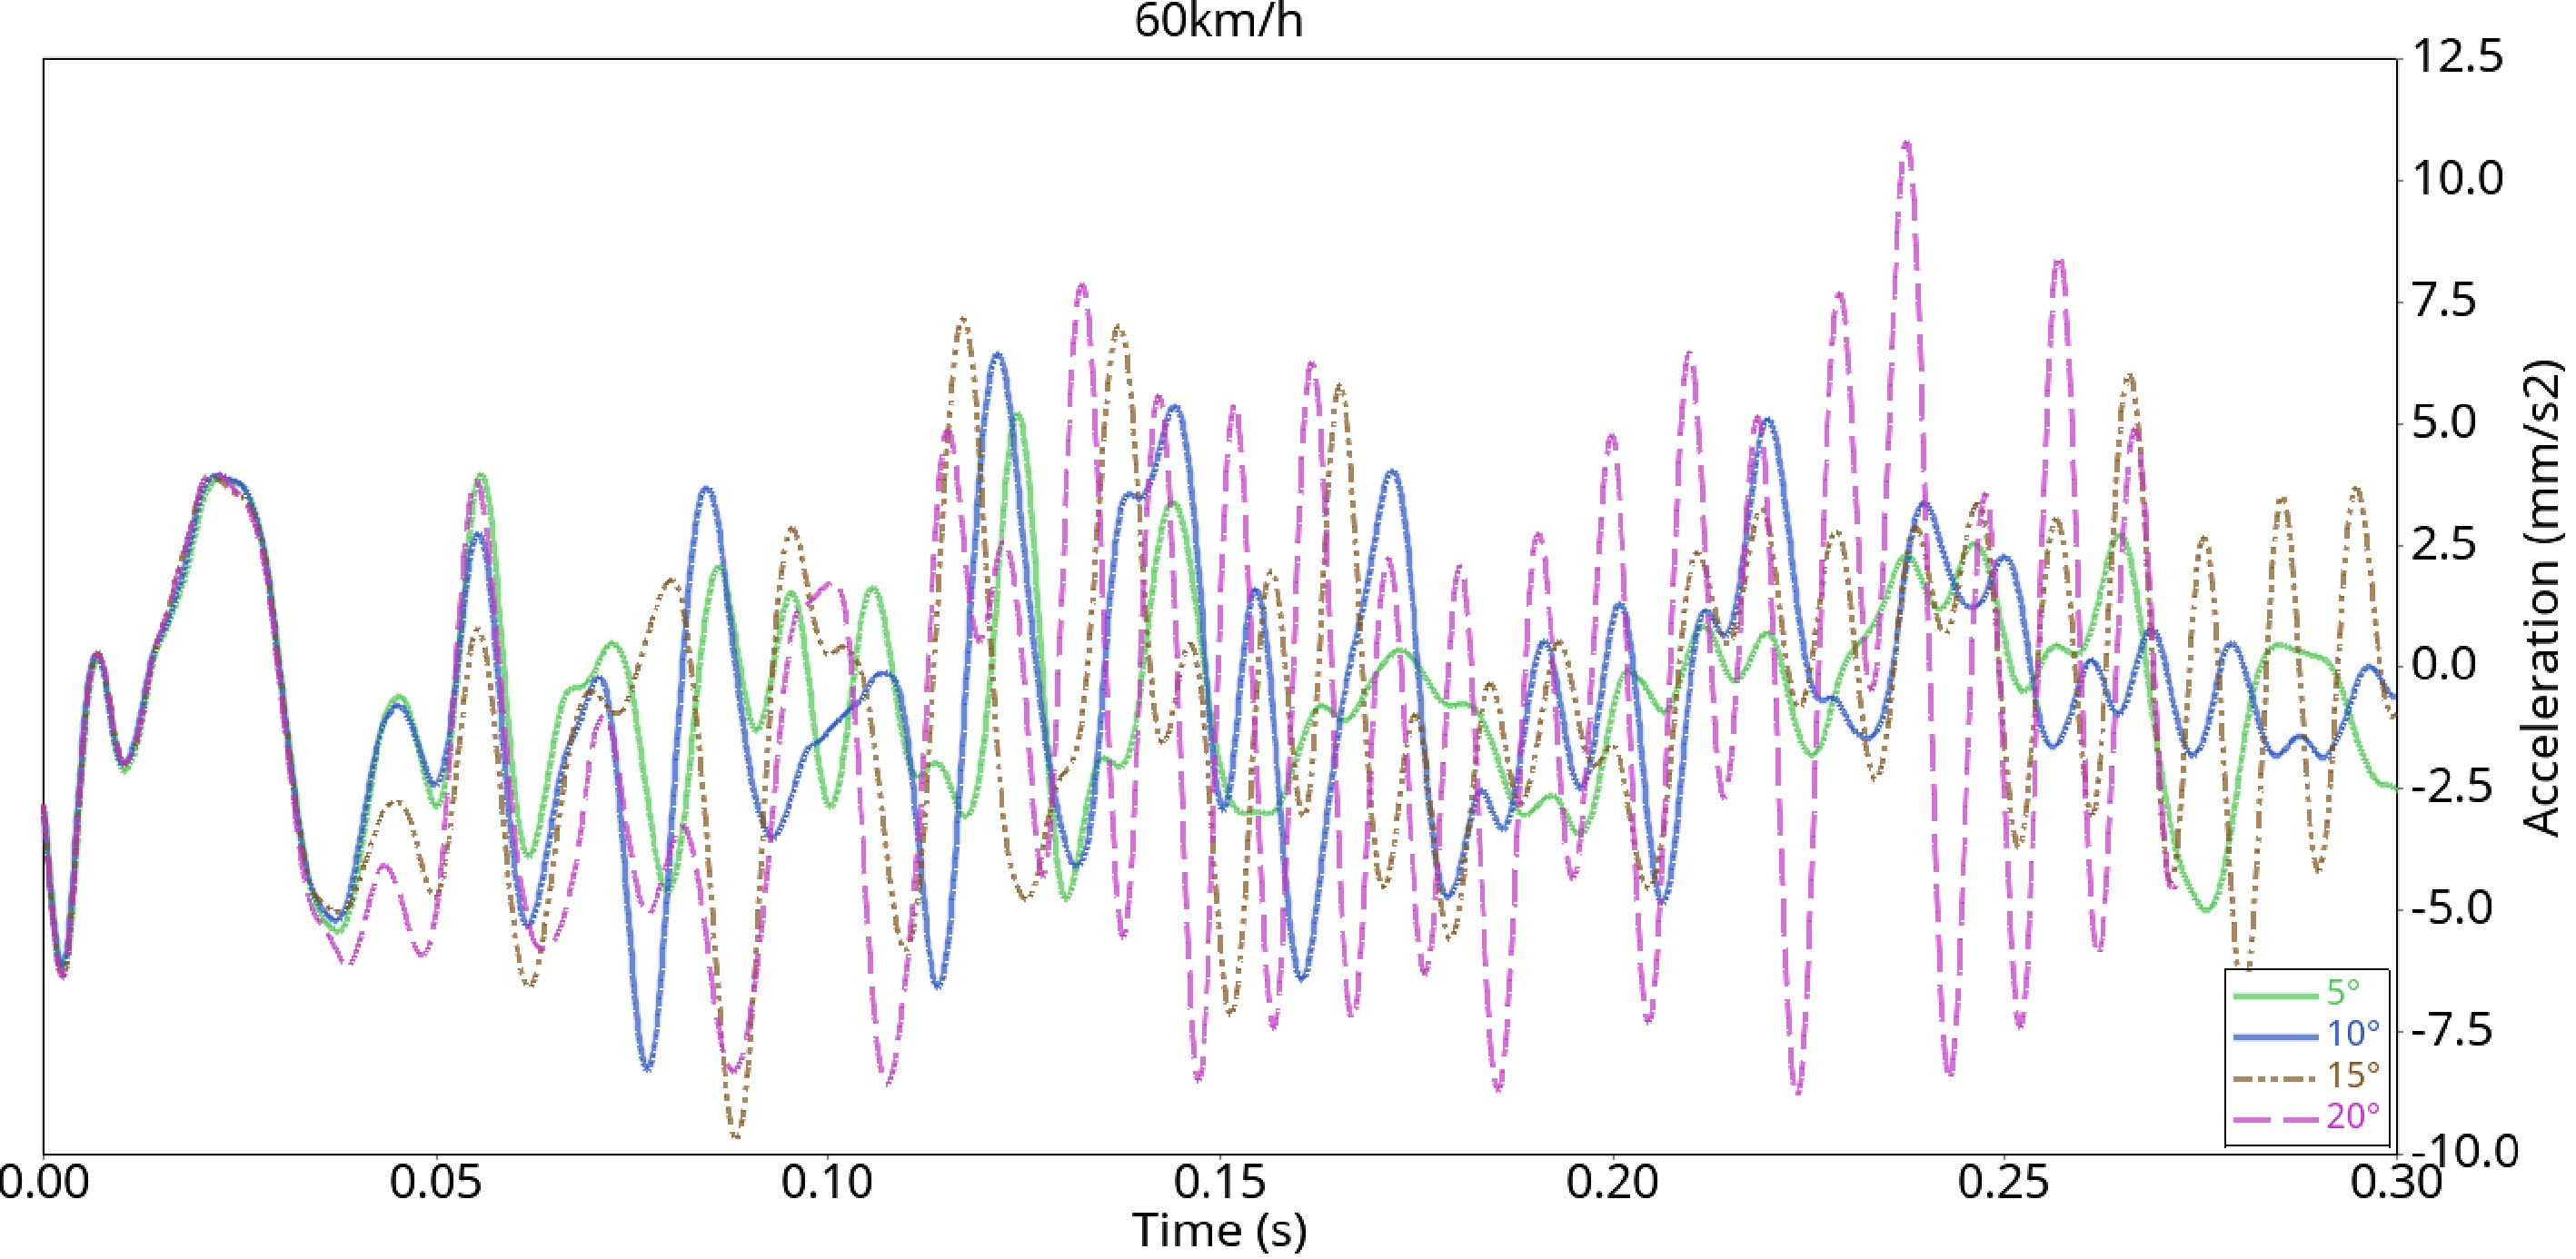
Figure 14.
Acceleration curve (60 km/h).
-
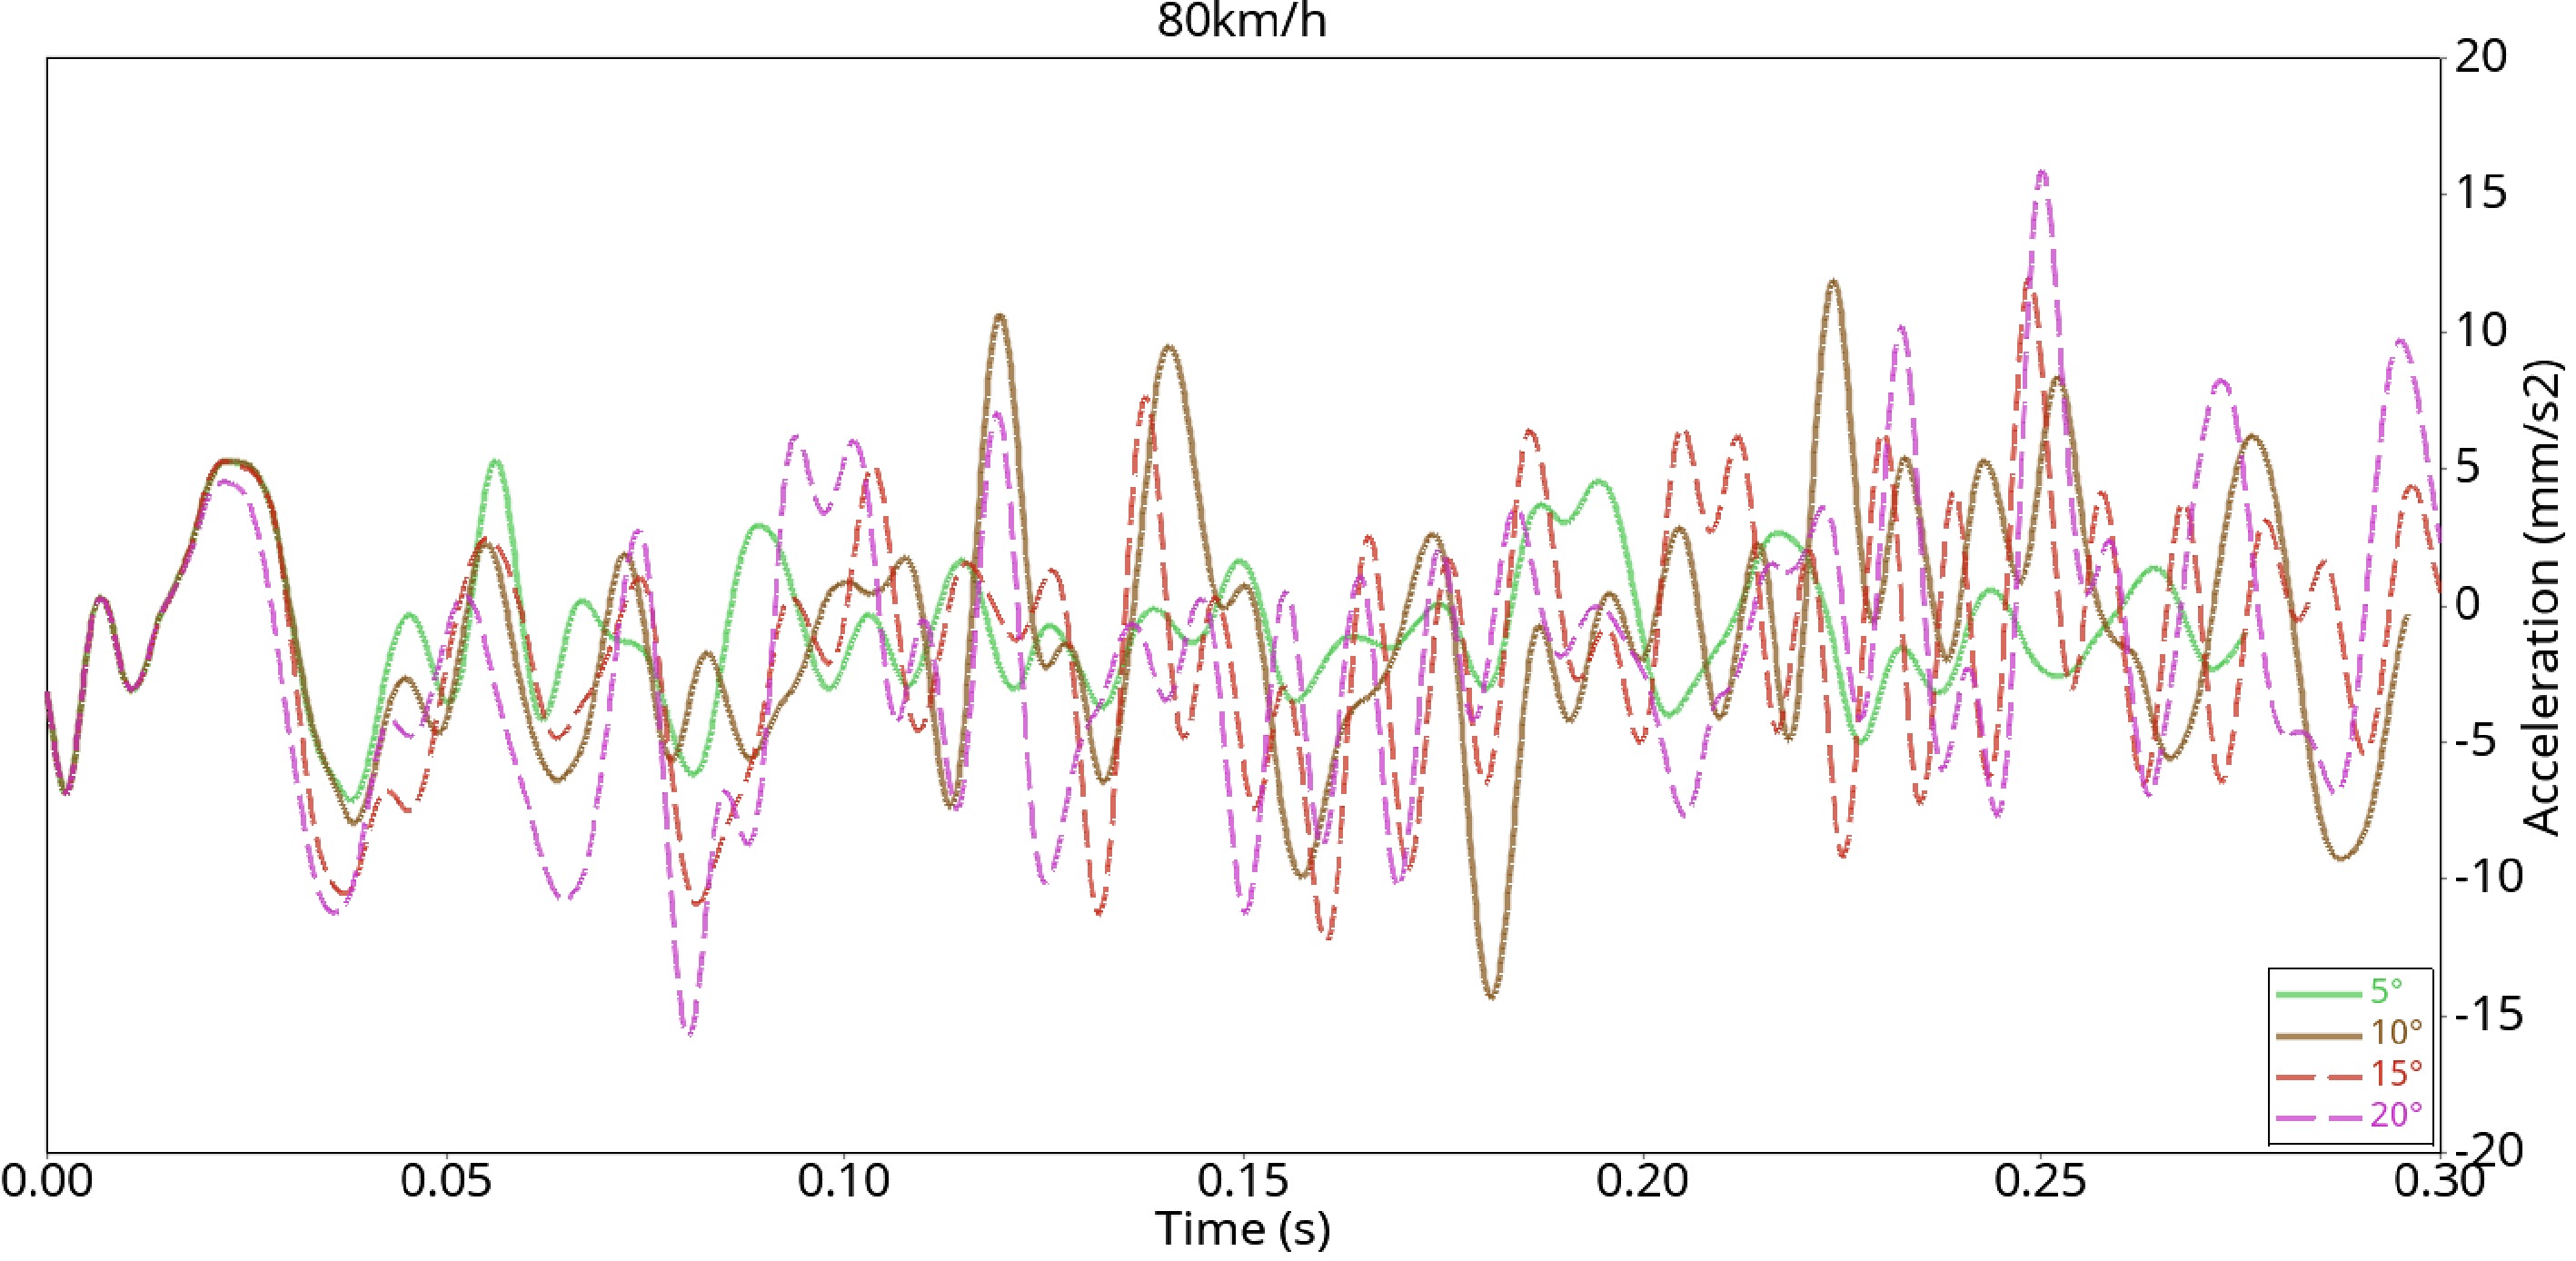
Figure 15.
Acceleration curve (80 km/h).
-
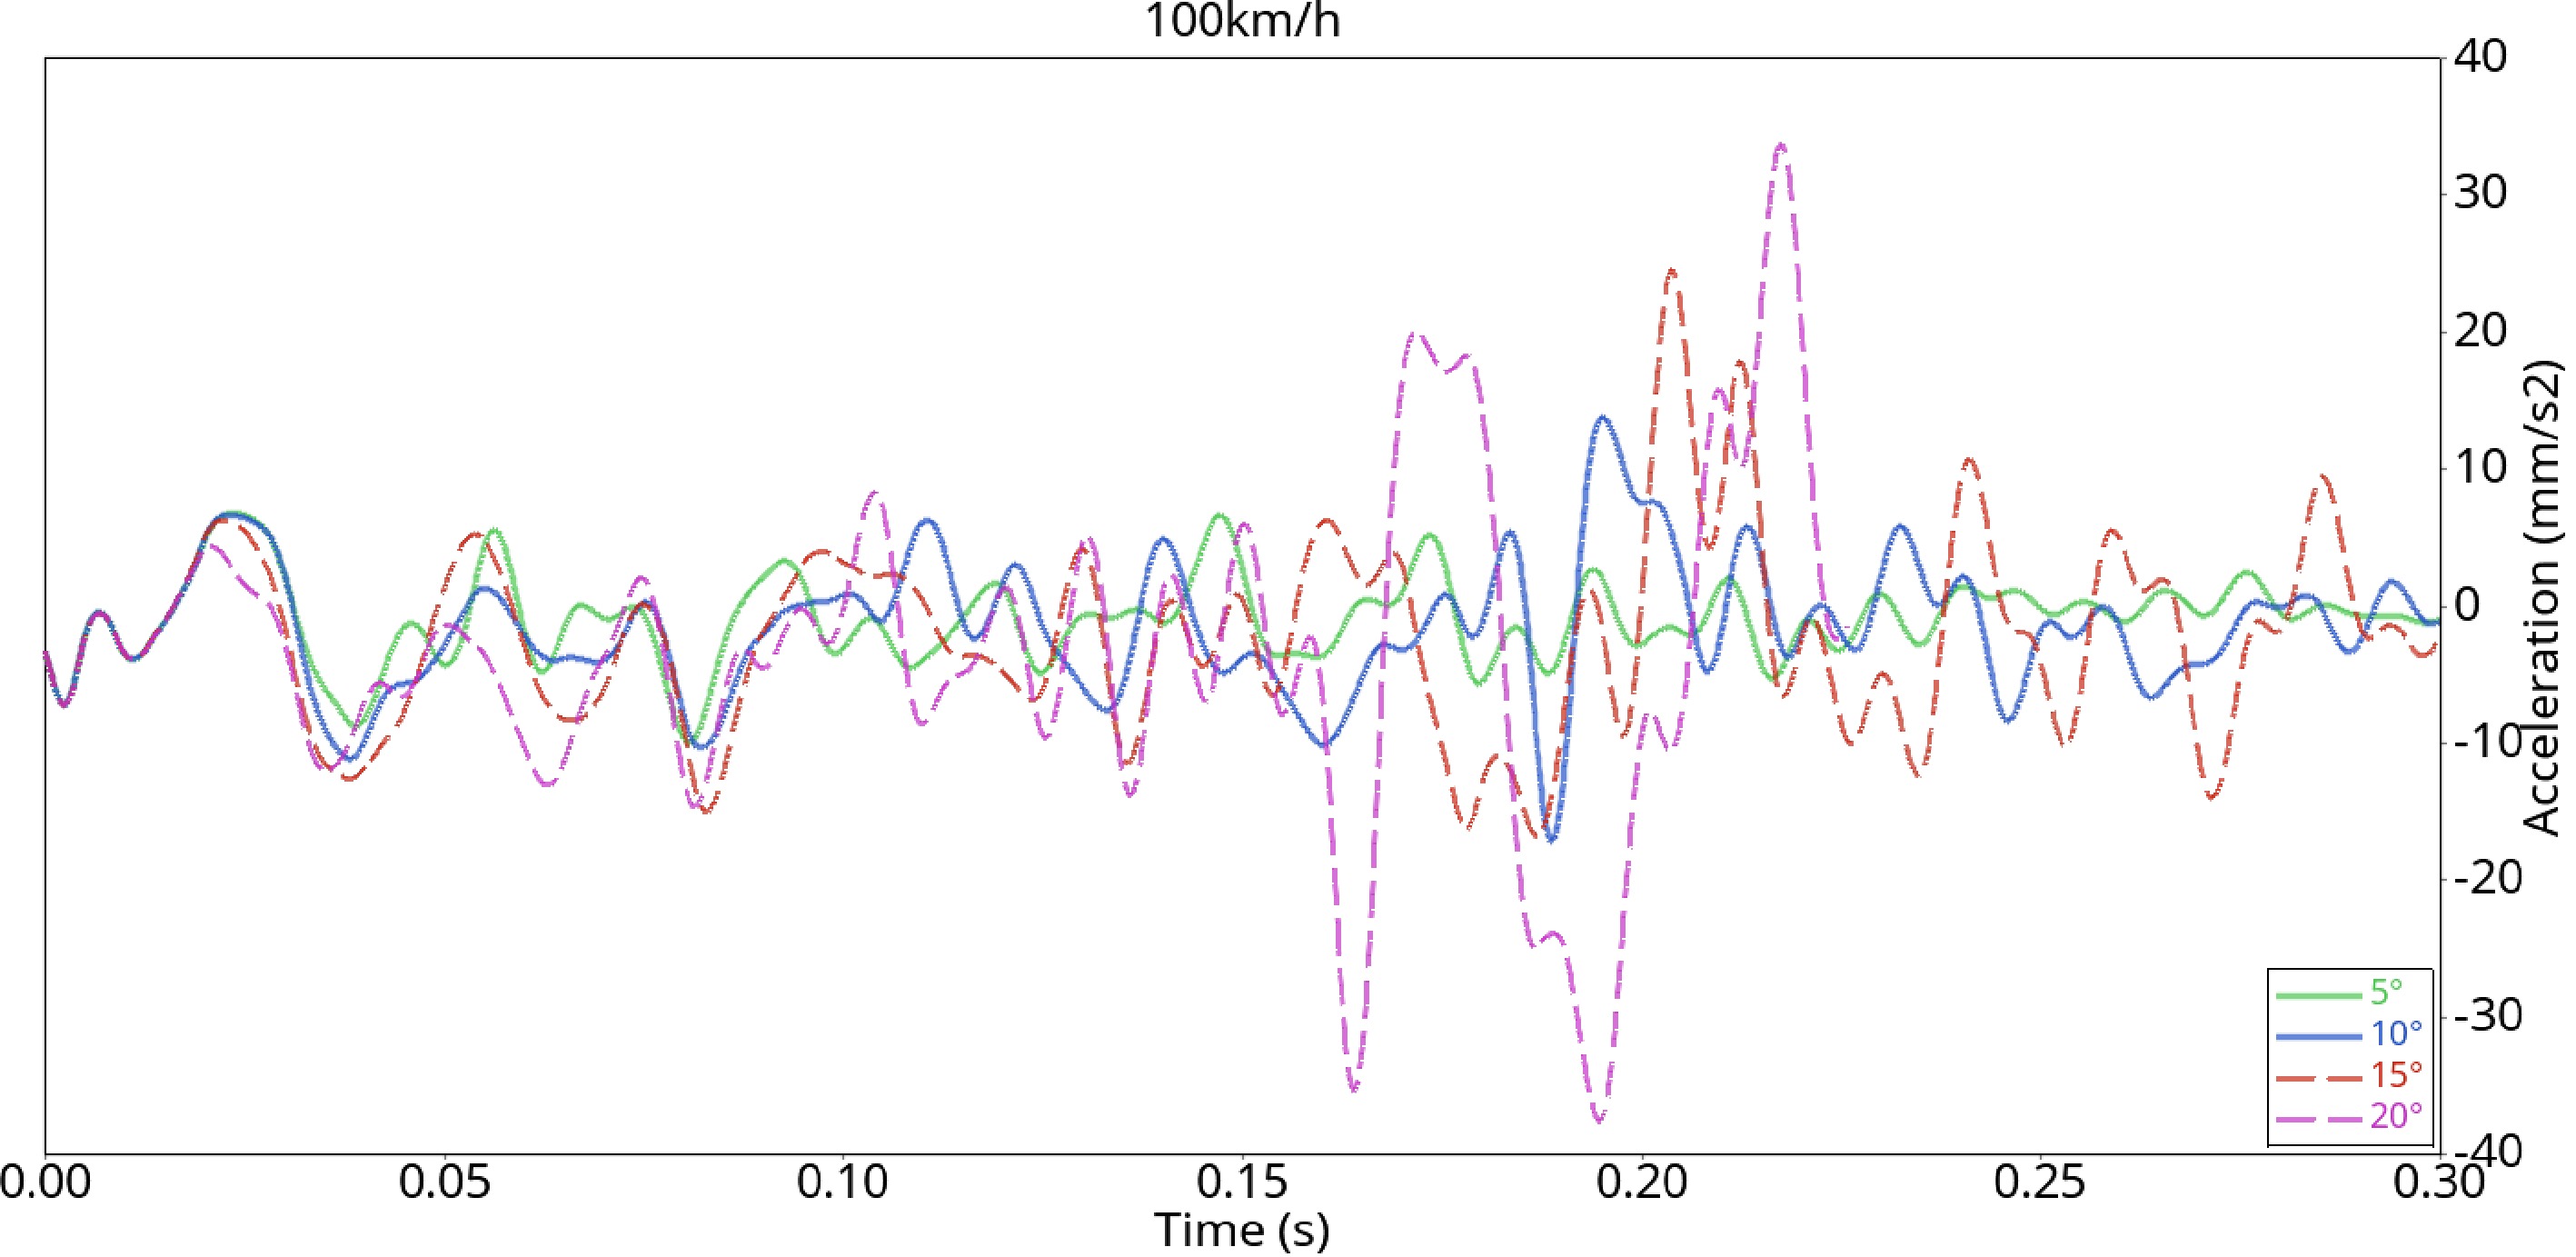
Figure 16.
Acceleration curve (100 km/h).
-
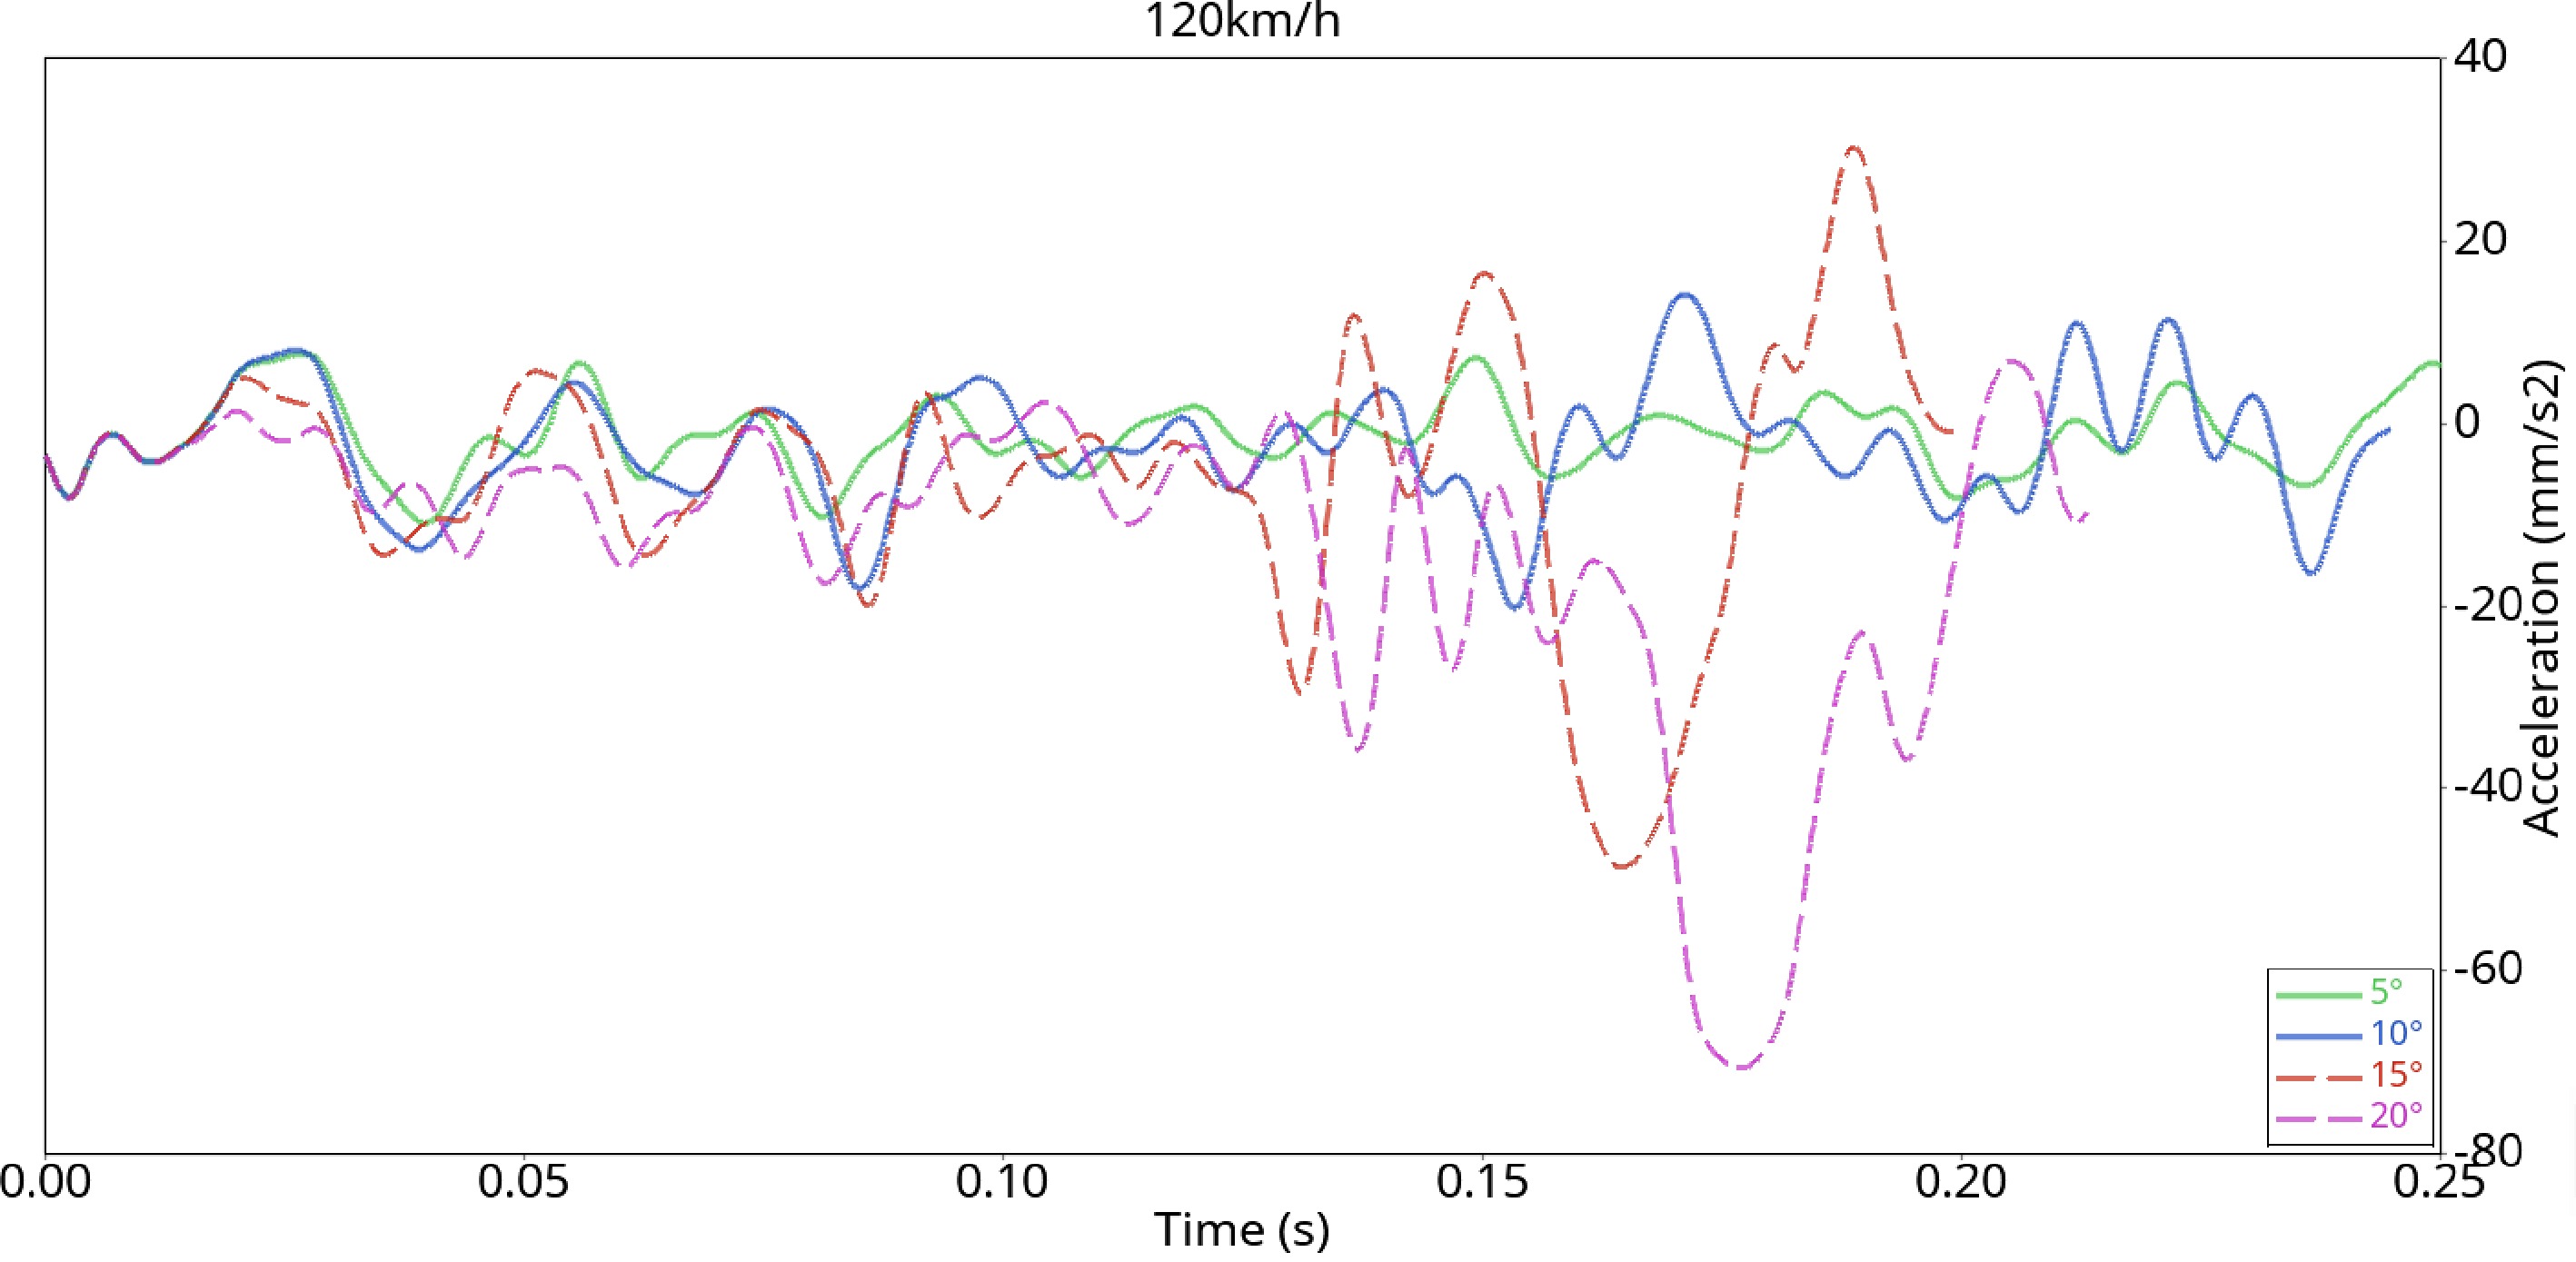
Figure 17.
Acceleration curve (120 km/h).
-
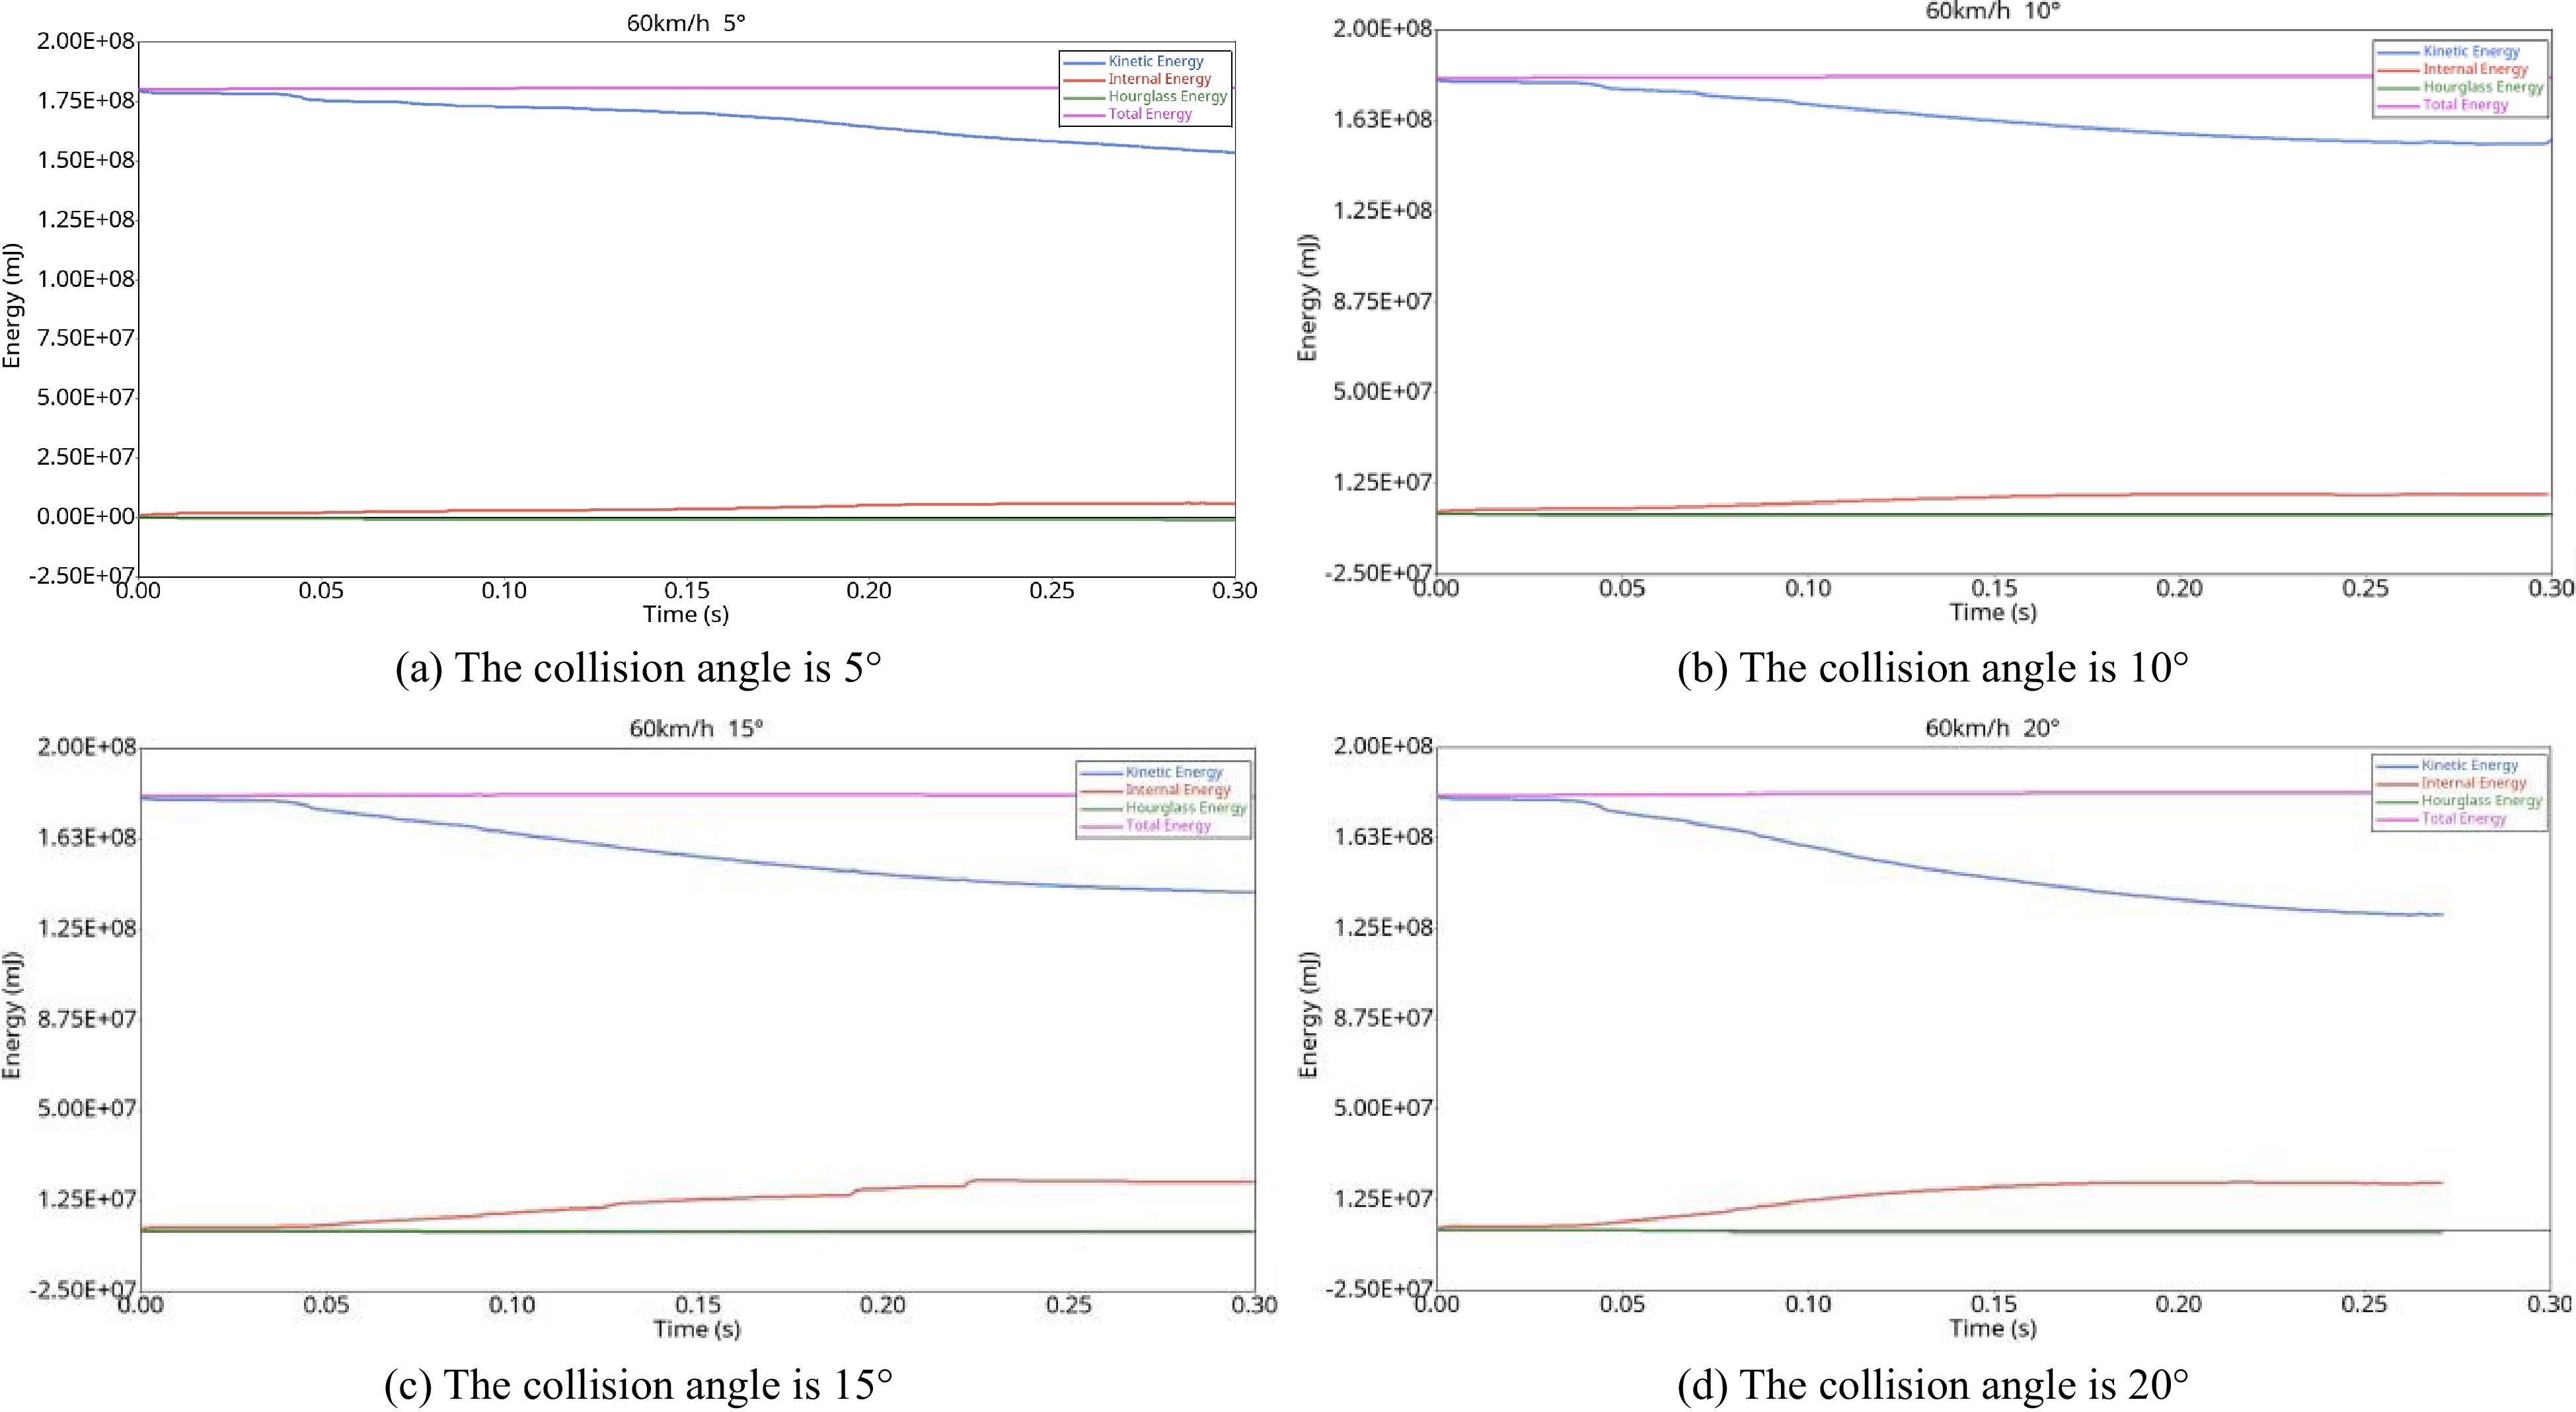
Figure 18.
Energy curves (60 km/h).
-
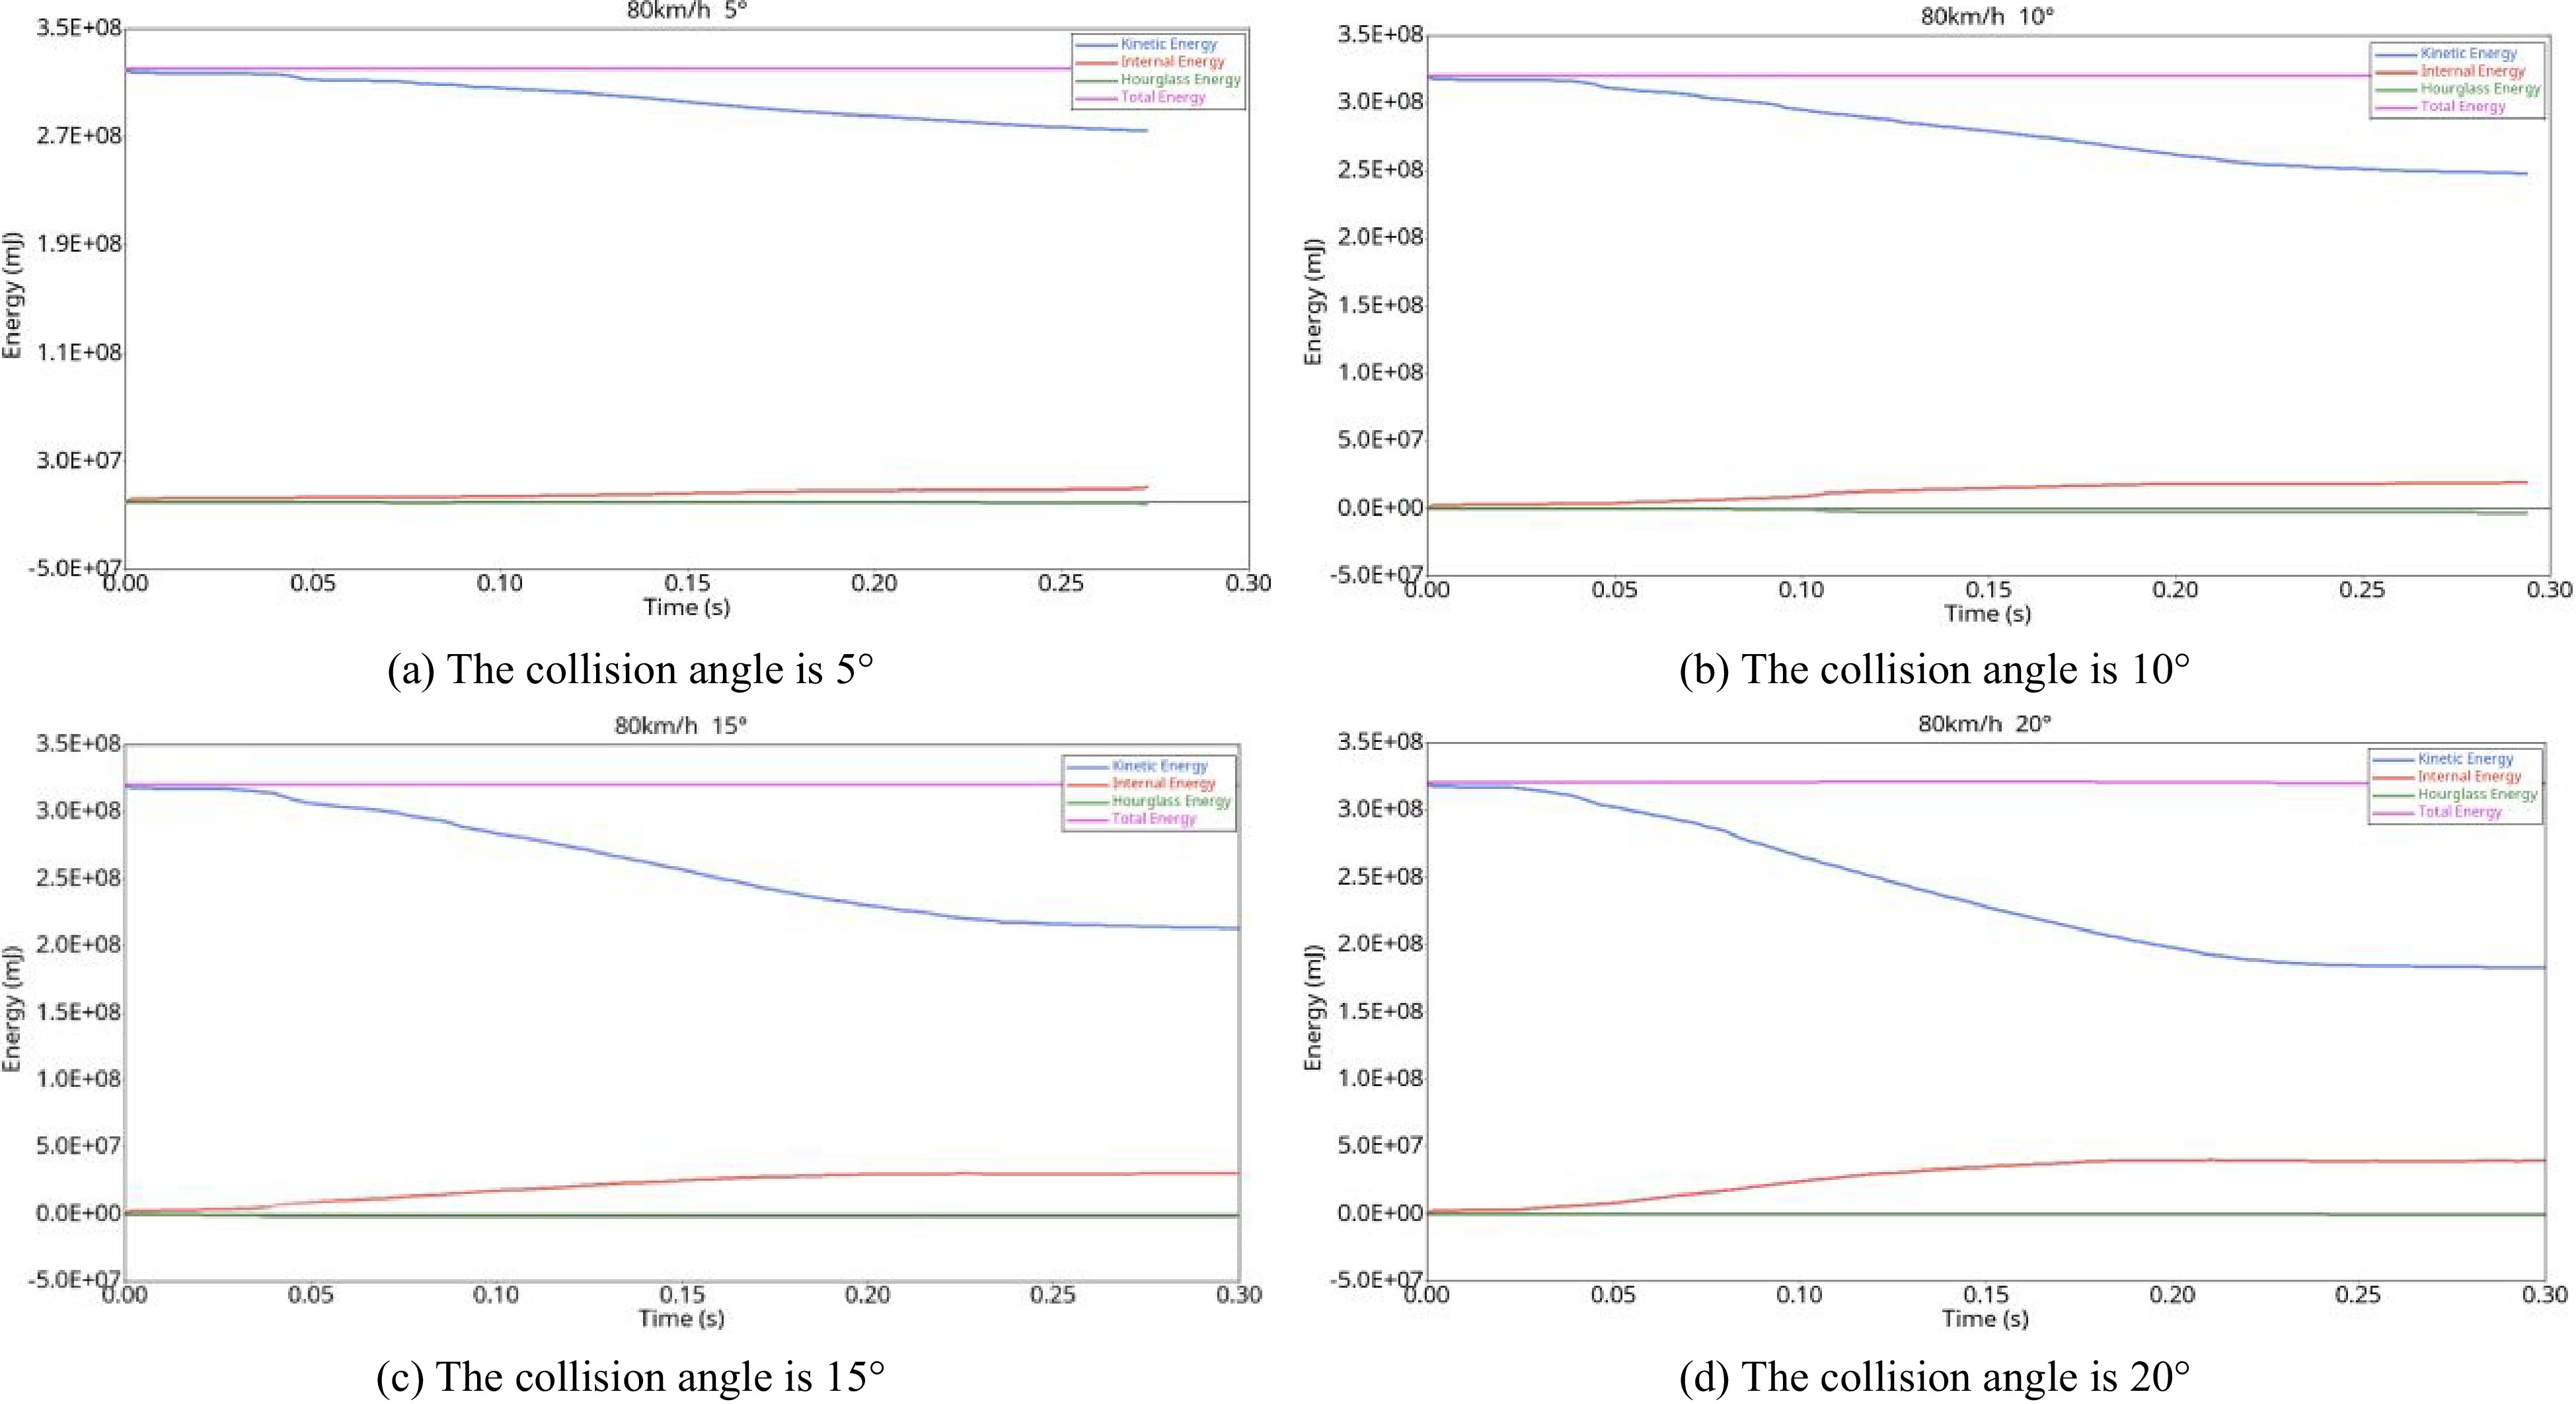
Figure 19.
Energy curve (80 km/h).
-
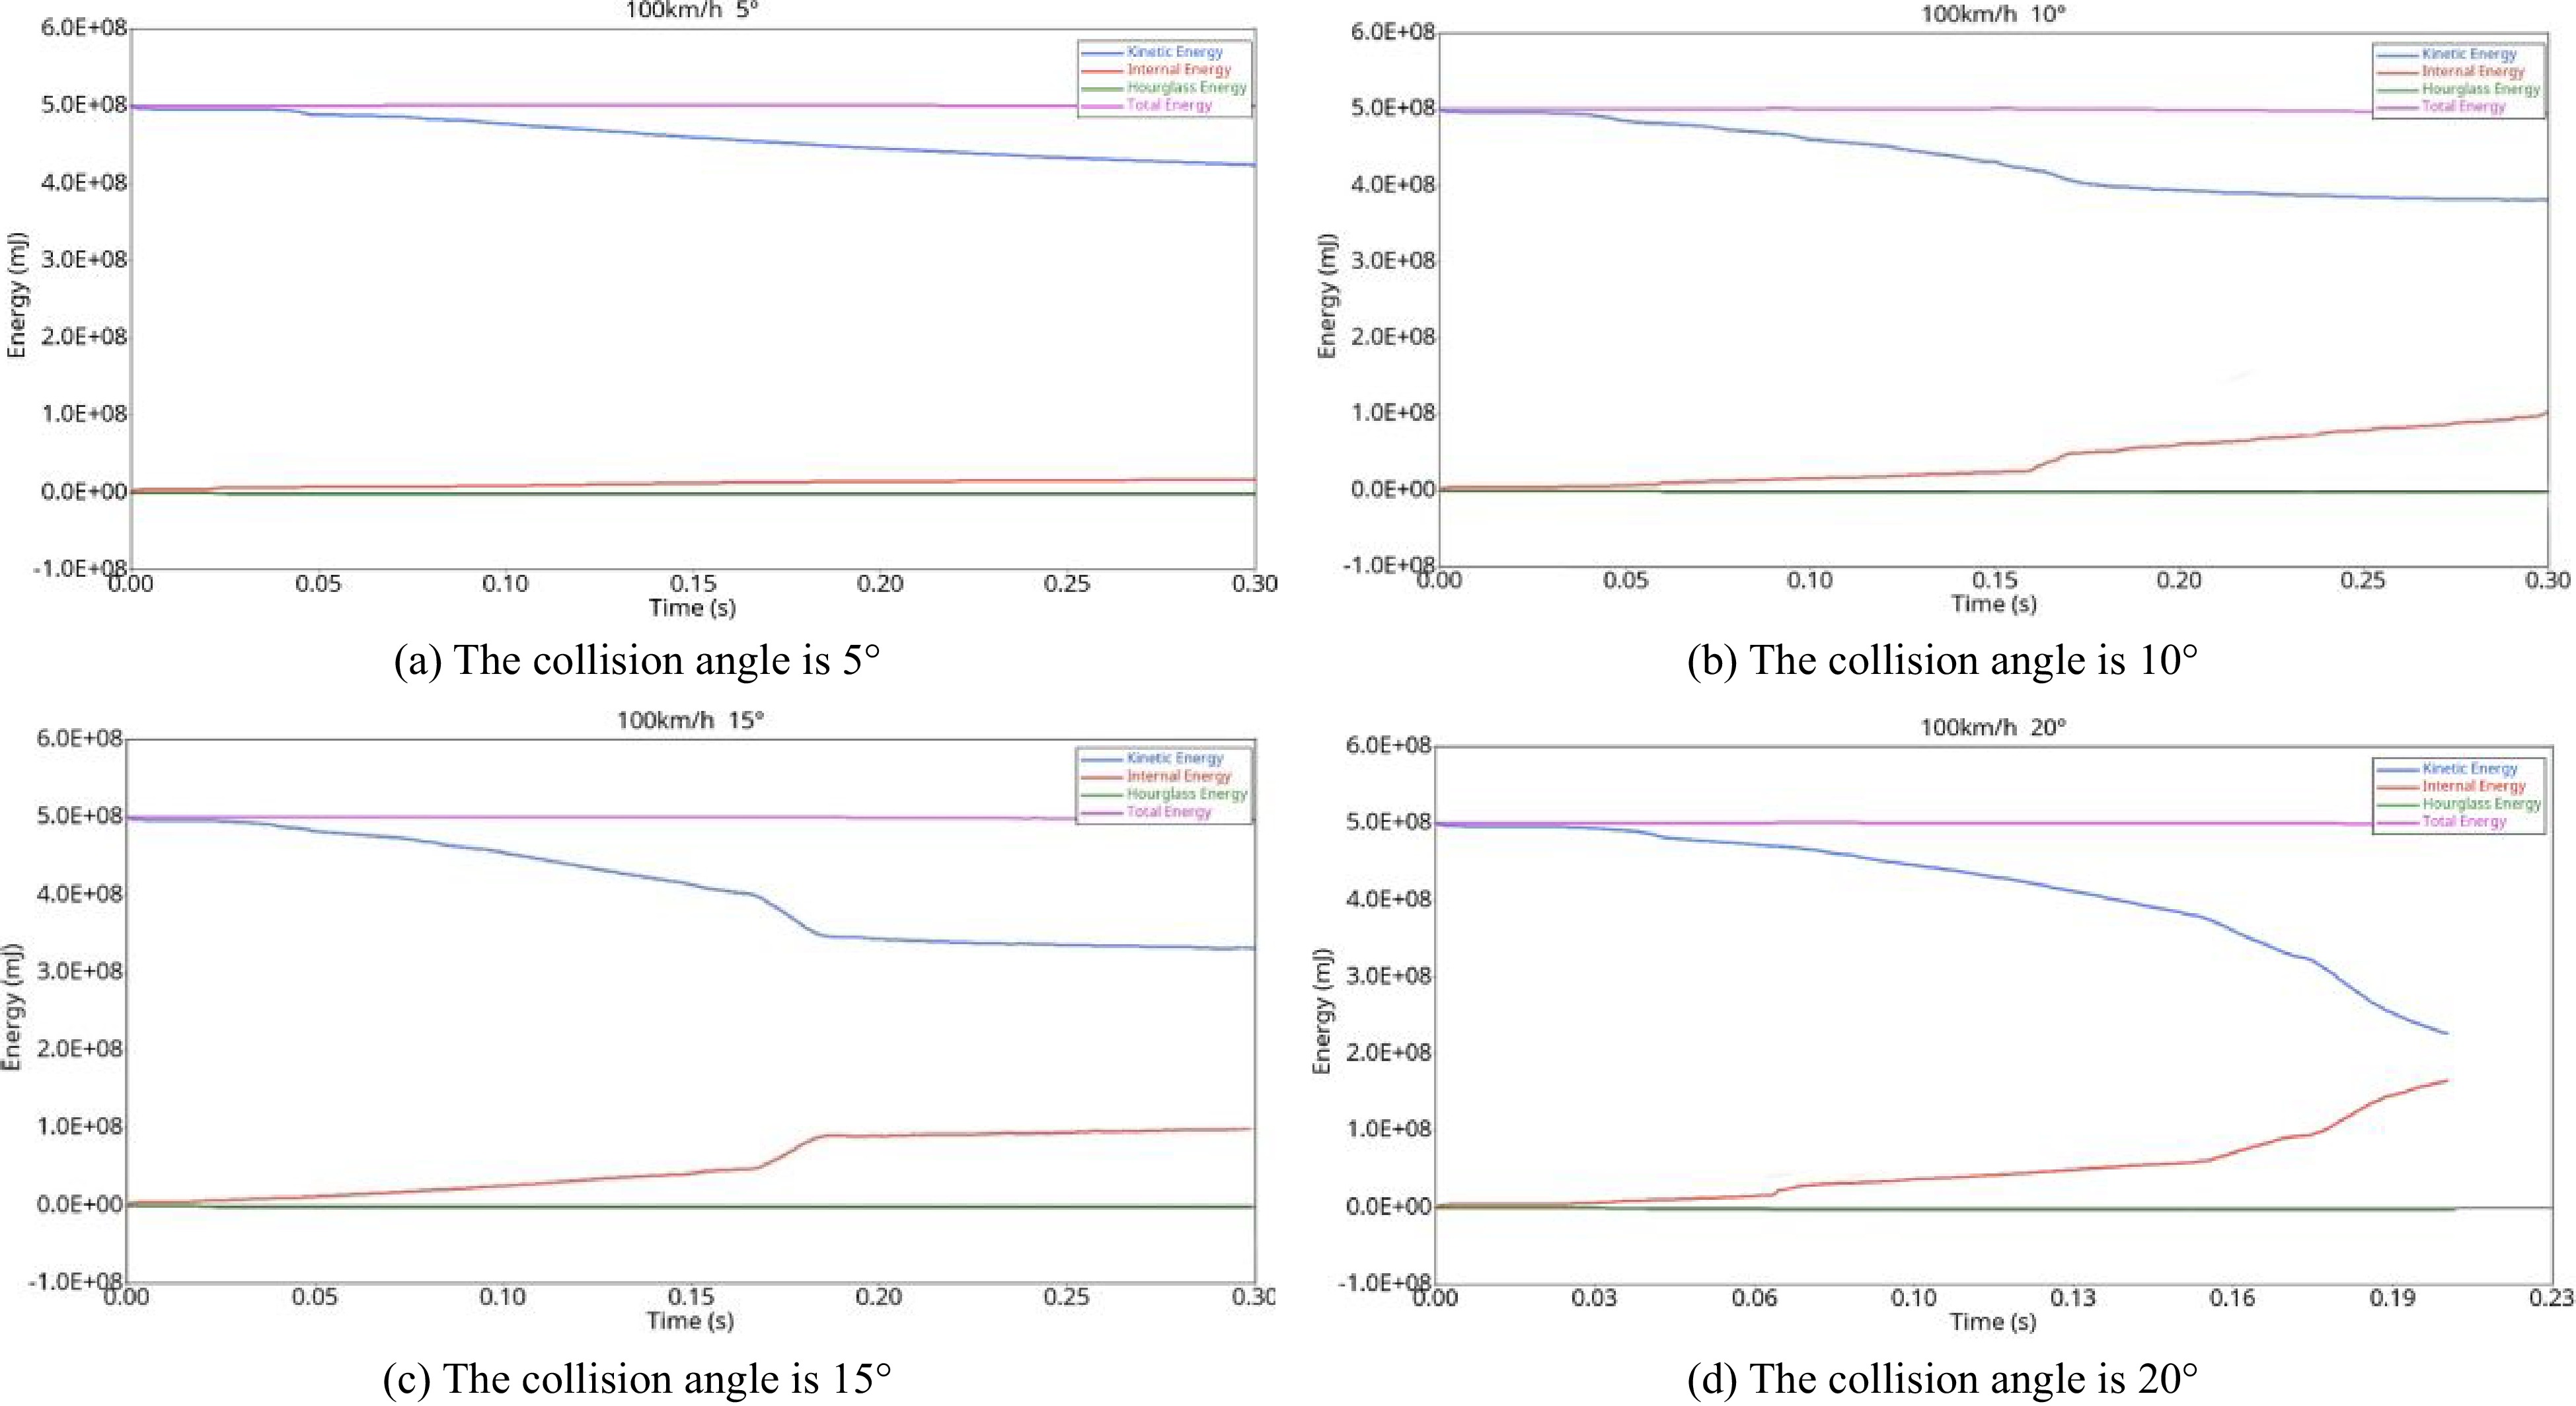
Figure 20.
Energy curves (100 km/h).
-
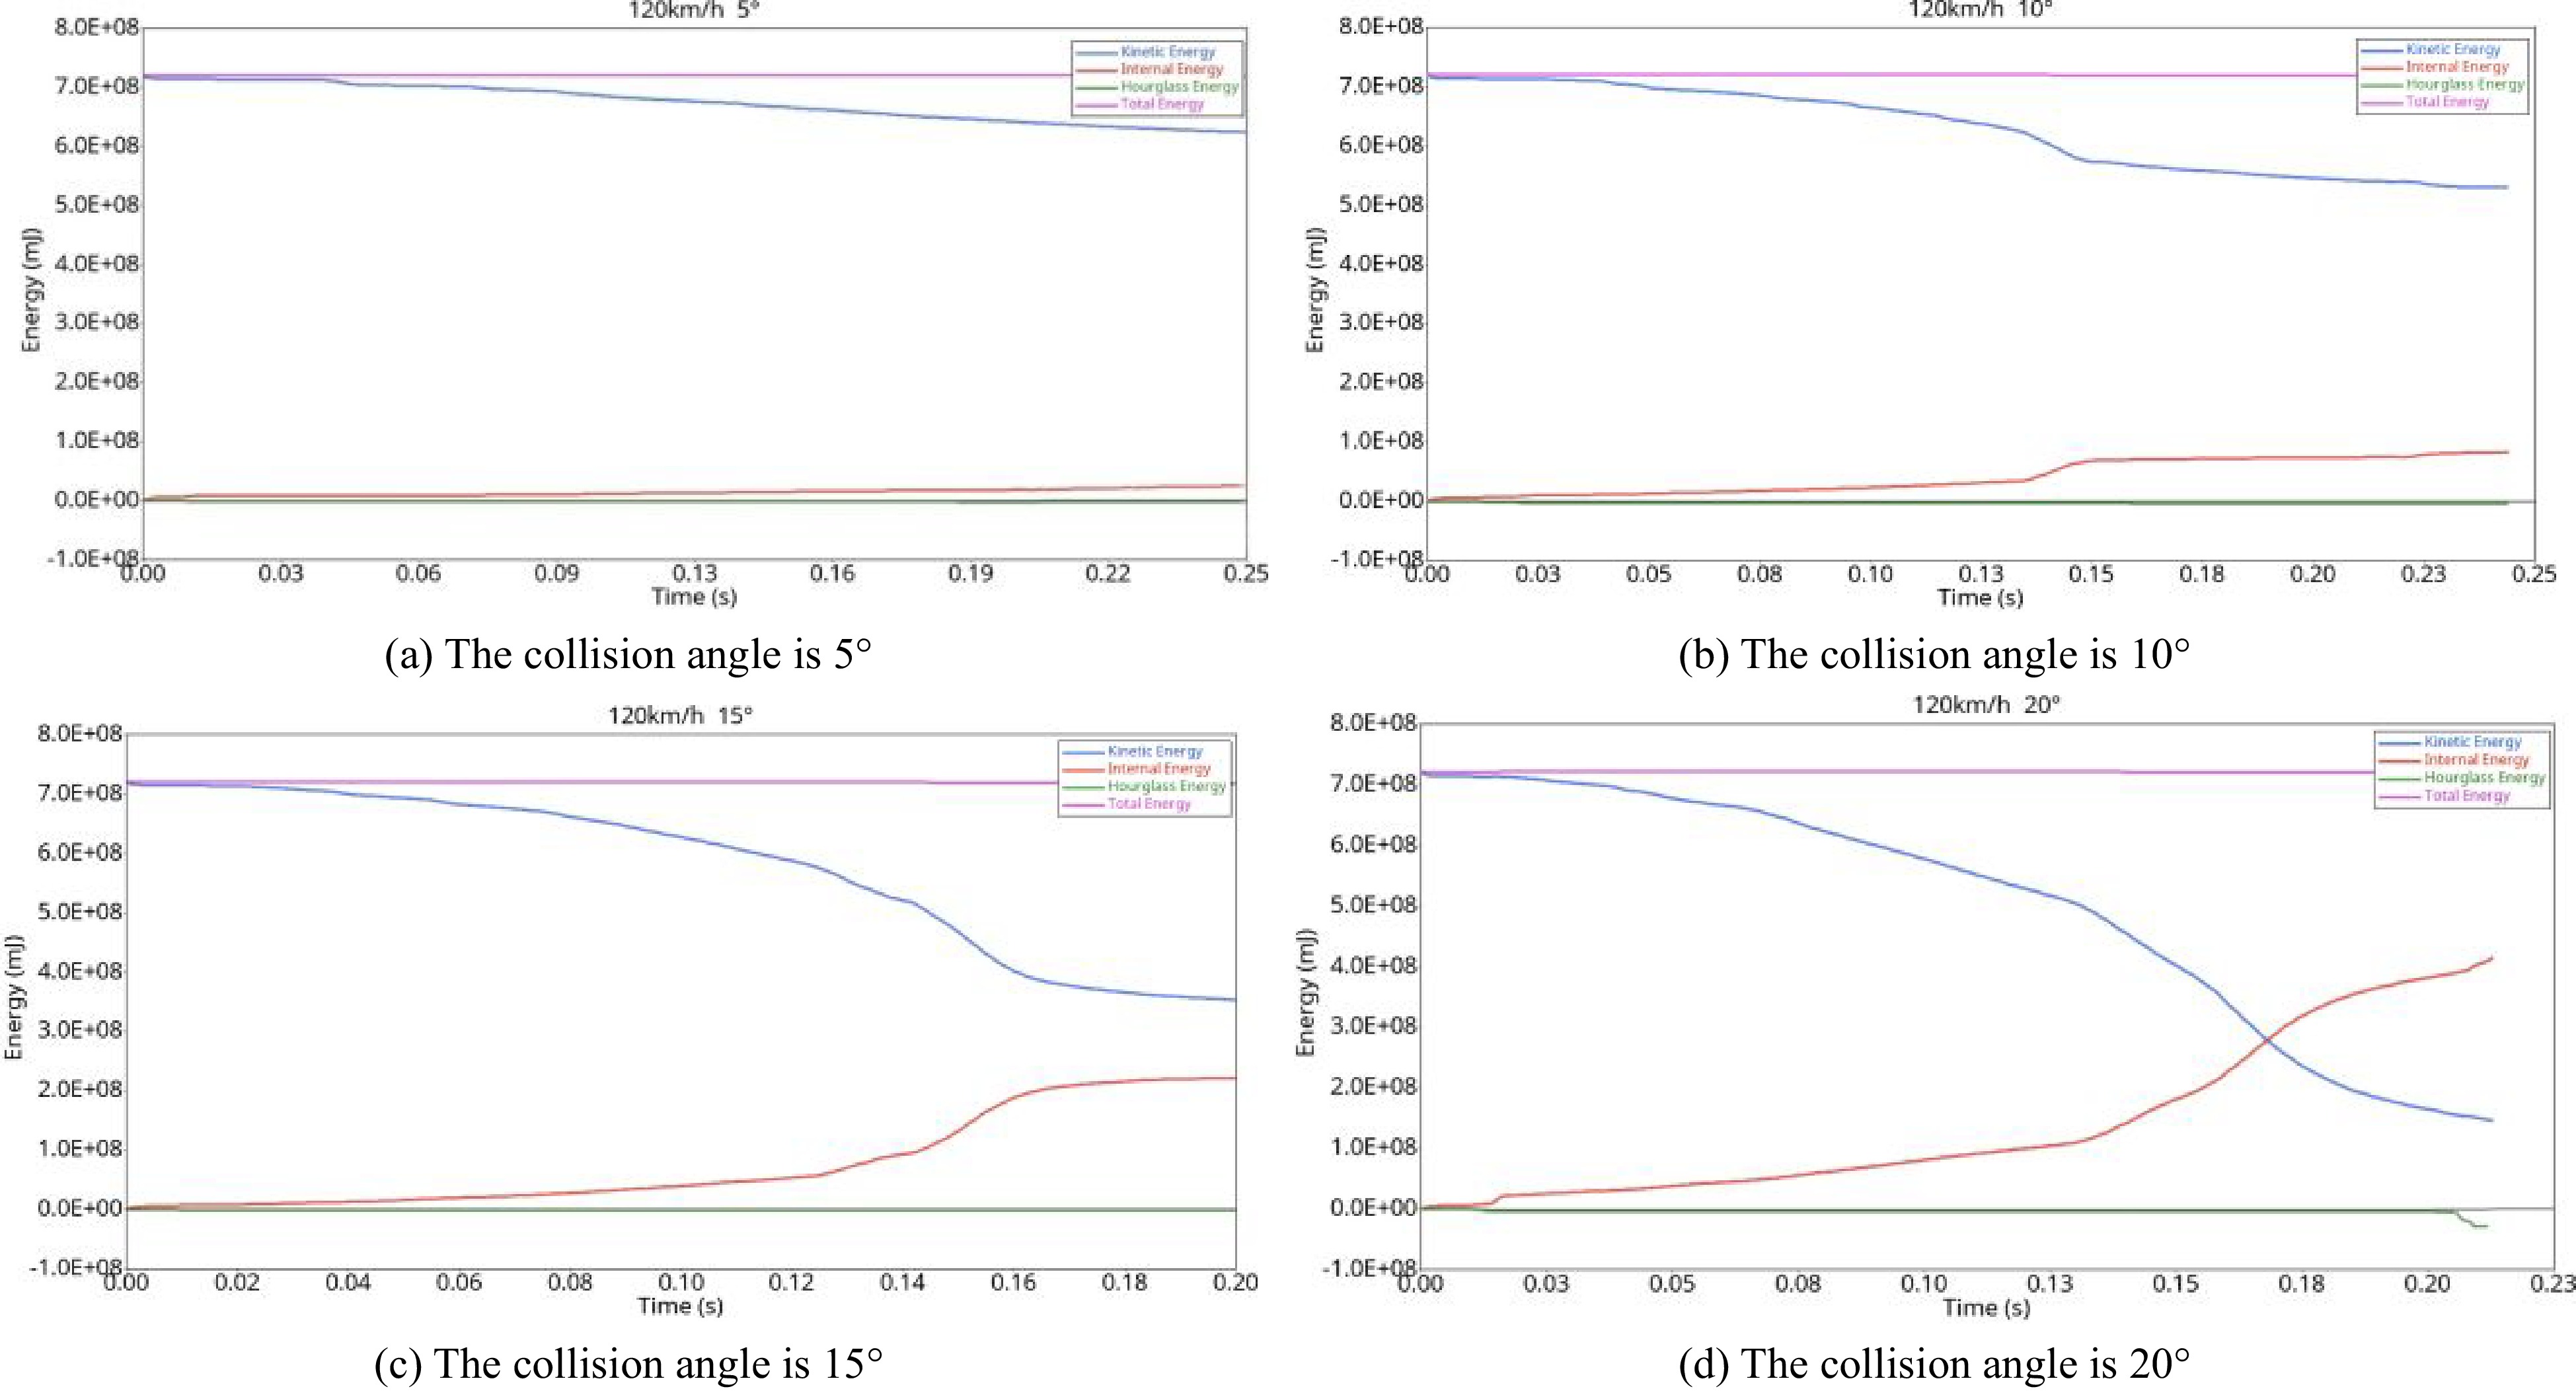
Figure 21.
Energy curve (120 km/h).
-
Density (t/mm3) Modulus of elasticity (MPa) Poisson's ratio Yield strength (MPa) Strain rate parameter C(l/s) Strain rate parameter P Tangent modulus (MPa) 7.89e-09 210,000 0.3 21,000 40 5 735 Table 1.
Guardrail parameters.
-
Speed (km/h) 60 80 100 120 5° 109.1 127.8 152.4 181.3 10° 153.0 228.3 268.9 308.2 15° 245.1 322.6 373.7 544.6 20° 281.3 375.4 482.5 637.1 Table 2.
Maximum lateral displacement of guardrail (mm).
-
Speed (km/h) 60 80 100 120 5° 5 ~ −5 5 ~ −7 7 ~ −10 8 ~ −12 10° 7.5 ~ −8 10 ~ −13 14 ~ −14 15 ~ −21 15° 8 ~ −10 12.5 ~ −12.5 23 ~ −17 30 ~ −50 20° 11 ~ −9 16 ~ −16 35 ~ −38 10 ~ −72 Table 3.
Acceleration range (g).
Figures
(21)
Tables
(3)