-

Figure 1.
The total bacterial count at different incubation time at 37 °C. (a) Fresh donkey milk was incubated at 37 °C with different times of 5, 8, 15, or 22 h for artificial bacterial enrichment, respectively. (b) Samples incubated for 8 and 15 h were consequently treated by HHP at 500 MPa at 20 °C for 10 min. Student's t test was used for the statistical significance.
-
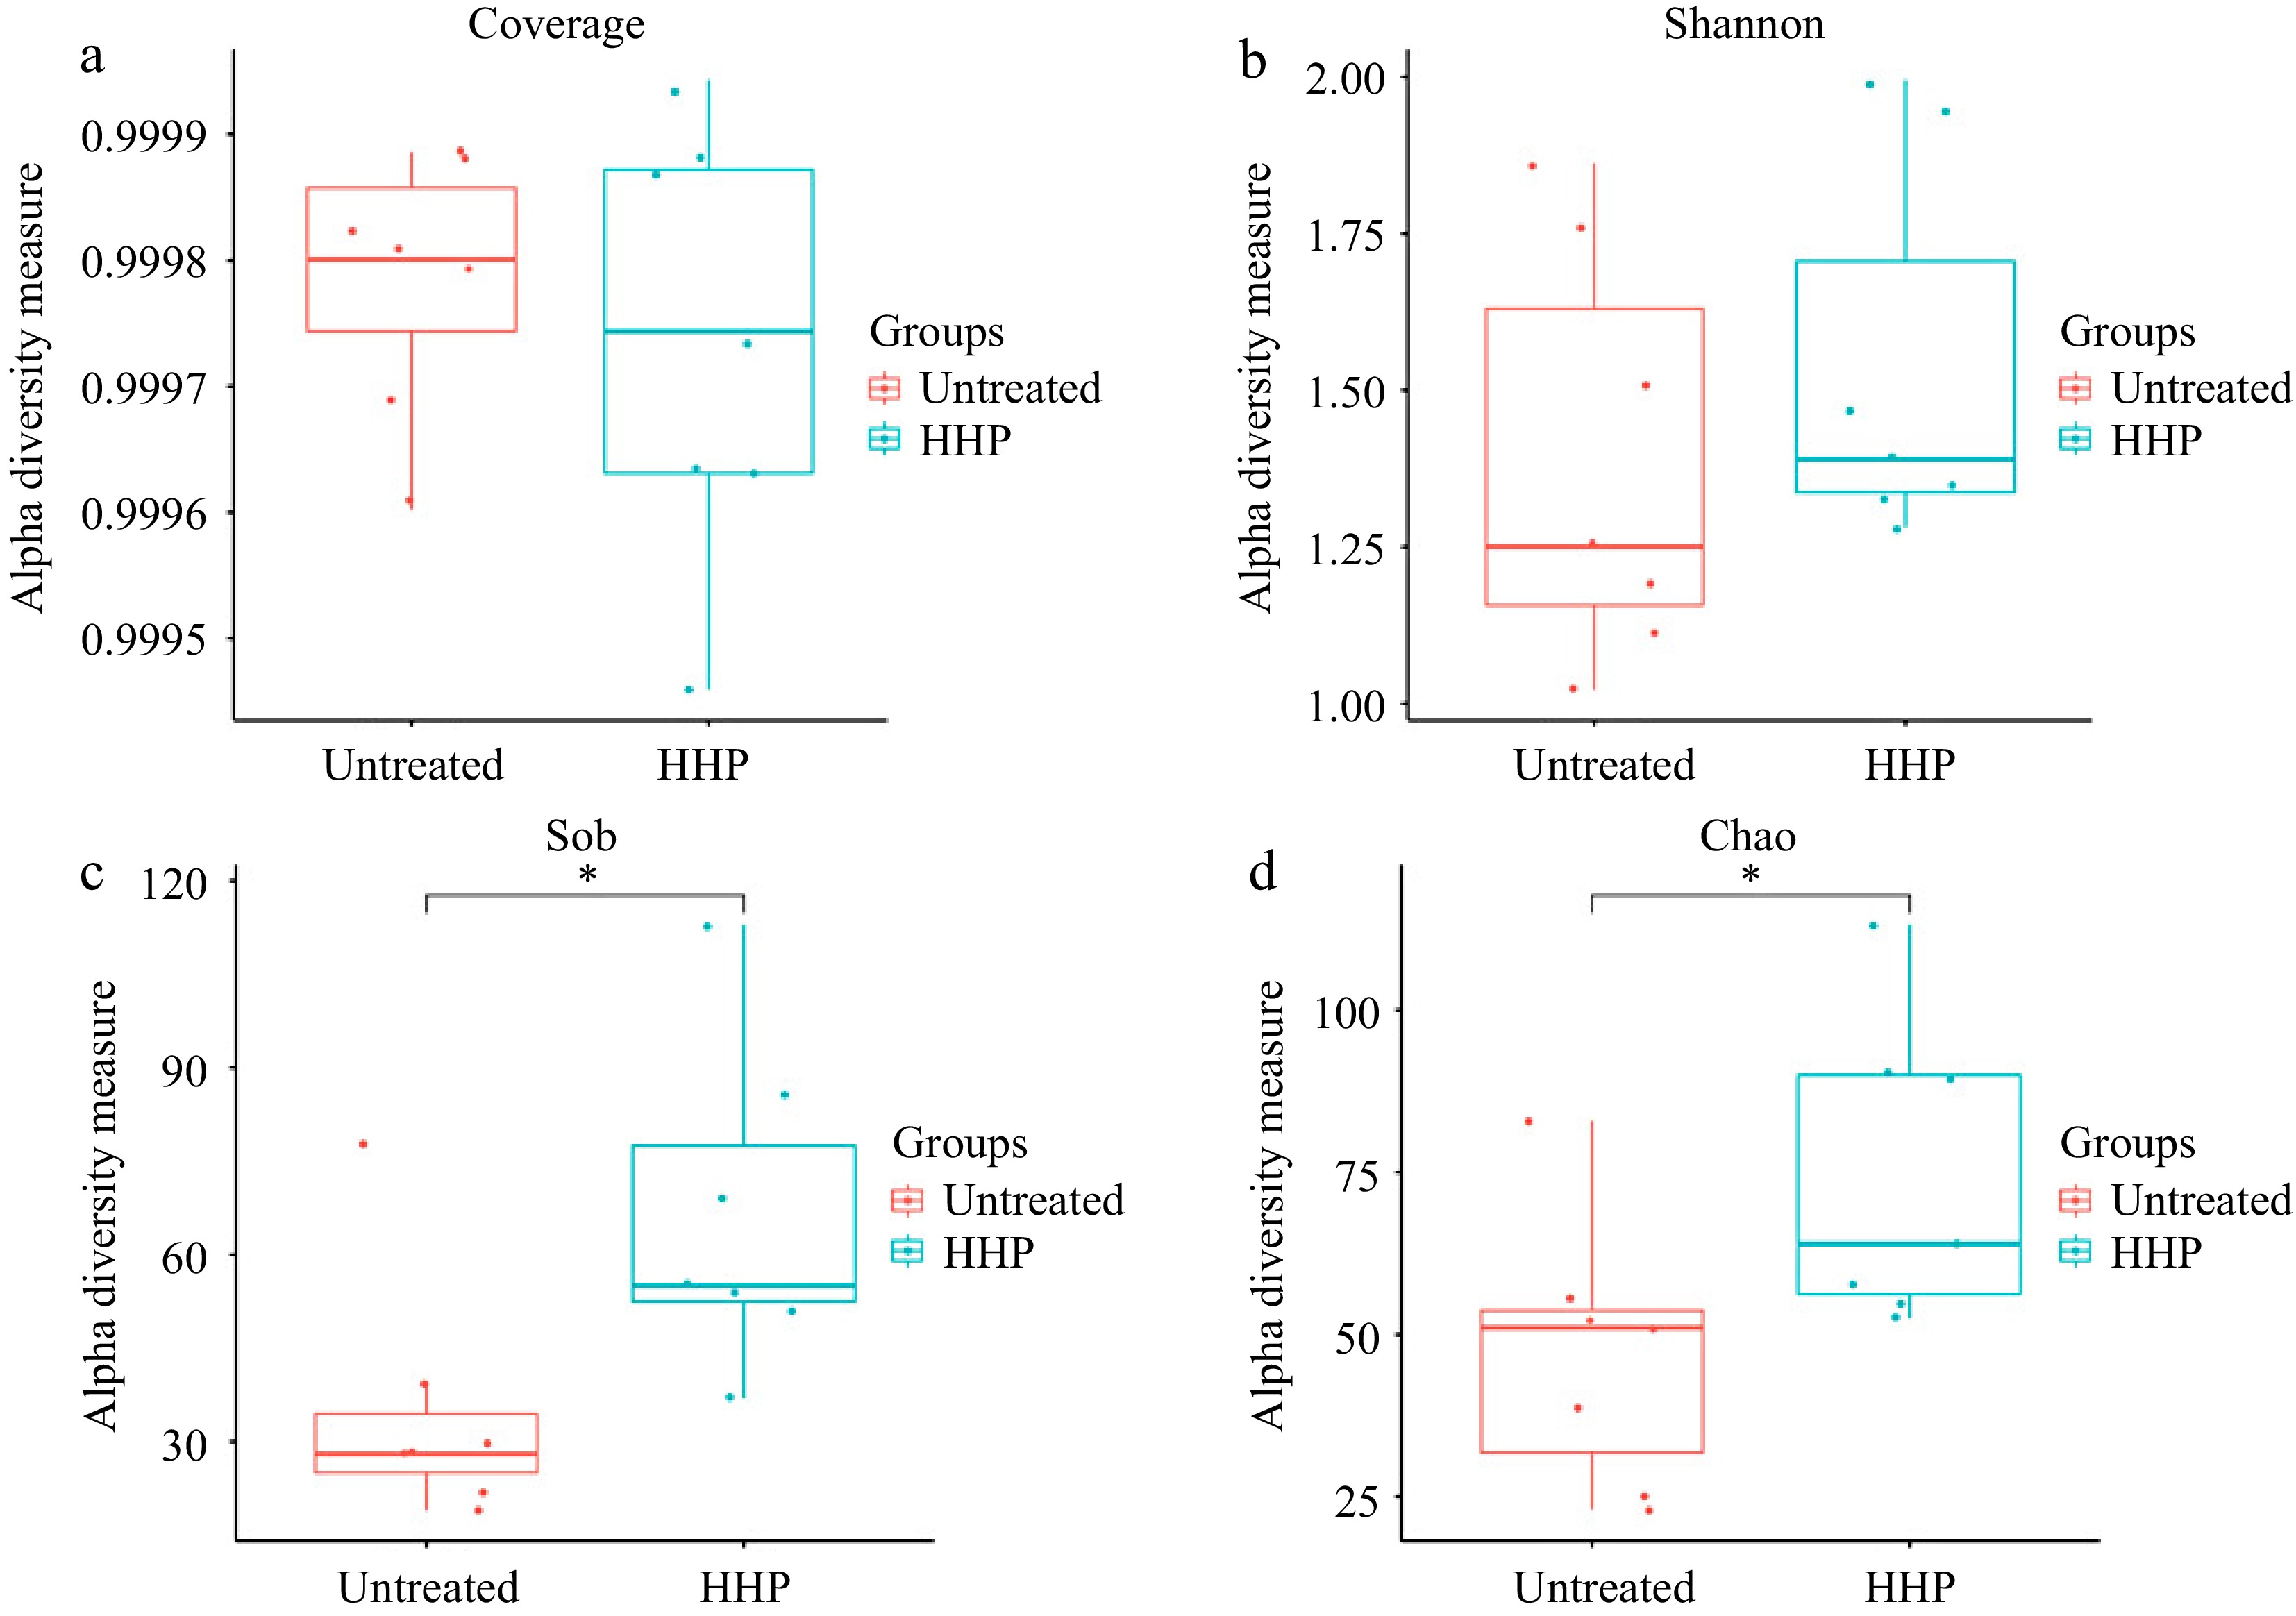
Figure 2.
(a) Alpha Diversity analysis of Coverage index, (b) Shannon index, (c) Sob index and (d) Chao index in untreated and HHP treated (500 MPa at 20 °C for 10 min) donkey milk. Wilcoxon test was used for the statistical significance. * means P < 0.05.
-
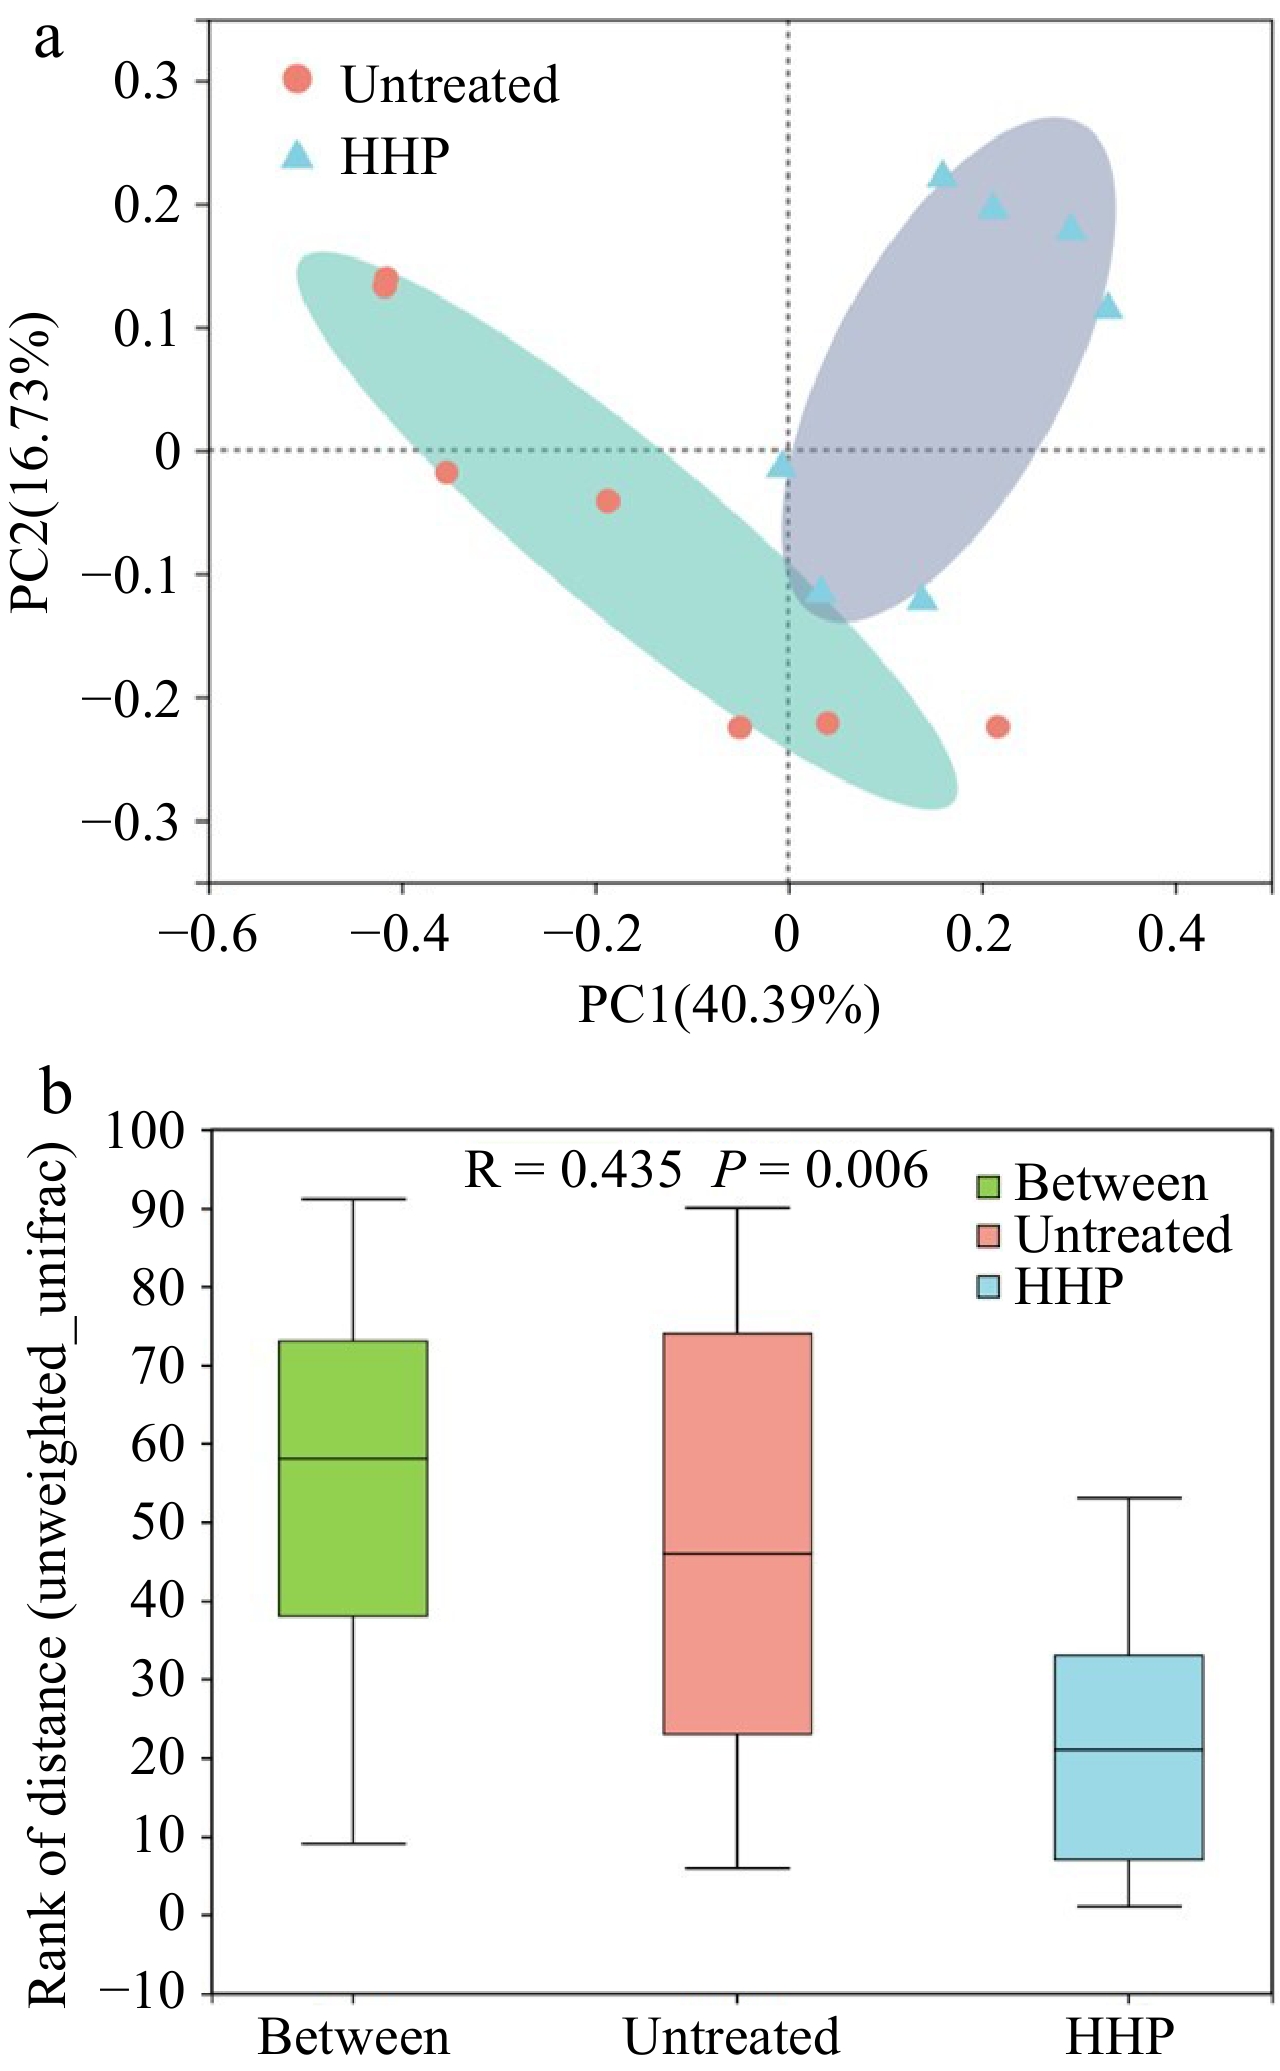
Figure 3.
(a) Principle Coordinate Analysis (PCoA) based on genus level in untreated (red) and HHP treated (blue) donkey milk, using unweighted UniFrac distance for separation. ANOISM analysis was assessed with 999 permutations and showed the difference in the microbial community between untreated and HHP treated donkey milk. (b) The distance was calculated based on genus level.
-

Figure 4.
Relative abundance of operational taxonomic units (OTUs) at (a) family and (b) genus level in untreated and HHP treated donkey milk.
-
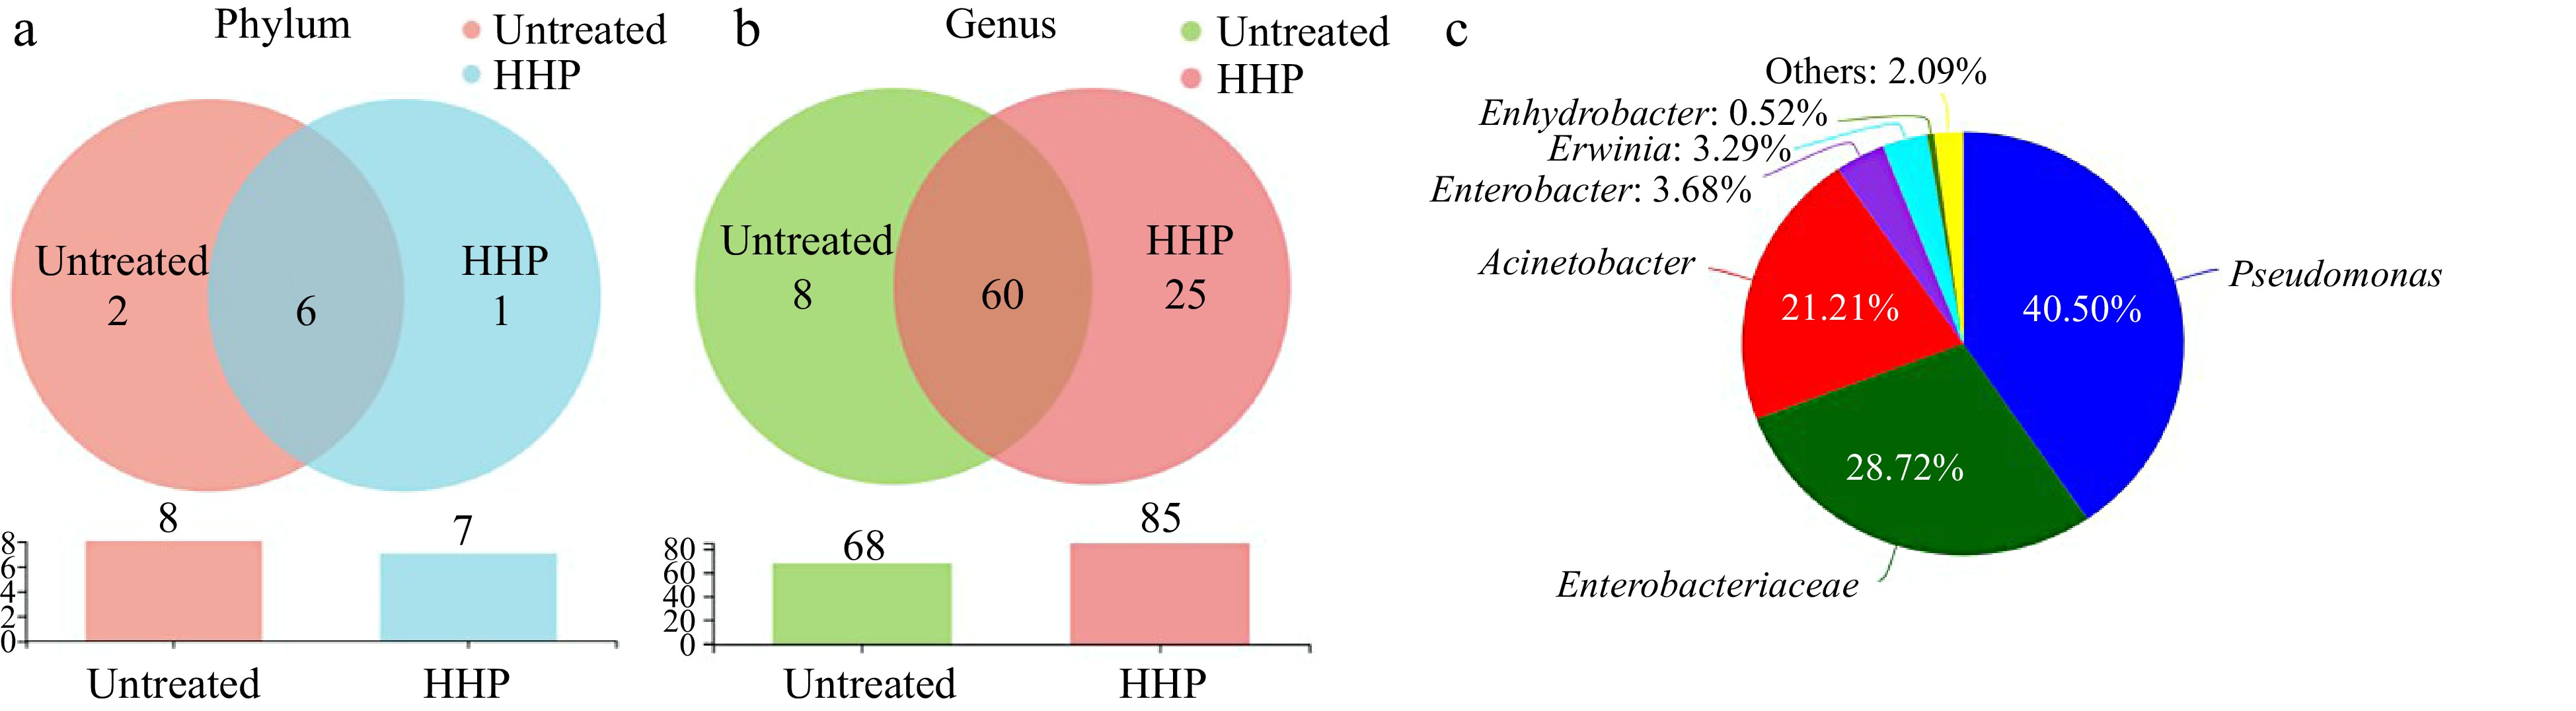
Figure 5.
Venn diagram of operational taxonomic units (OTUs) at (a) phylum and (b) genus level. (c) Genera of microbiota communities shared in two groups (abundance of genera < 0.5% were clustered as others).
-

Figure 6.
(a) Differences of bacterial composition between untreated and HHP treated donkey milk based on LEfSe Analysis. (b) Linear discriminant analysis (LDA) scores calculated for differentially abundant bacteria intwo groups, only LDA score above 2 are shown.
-
Untreated donkey milk HHP treated donkey milk G− genera 98.47% G− genera 96.09% Pseudomonas 42.82% Pseudomonas 37.90% Enterobacteriaceae 26.20% Enterobacteriaceae 31.04% Acinetobacter 23.54% Acinetobacter 18.72% Erwinia 2.86% Enterobacter 3.69% Enterobacter 2.69% Erwinia 3.69% Enhydrobacter 0.34% Enhydrobacter 0.70% Chryseobacterium 0.02% Chryseobacterium 0.24% Christensenellaceae R-7 group 0.11% G+ genera 0.88% G+ genera 1.5% Rothia 0.41% Kocuria 0.50% Kocuria 0.18% Rothia 0.48% Macrococcus 0.13% Rhizobiaceae 0.32% Bacillus 0.12% Microbacterium 0.11% Rhizobiaceae 0.02% Macrococcus 0.05% Microbacterium 0.02% Bacillus 0.04% Table 1.
Percentages of Gram-positive and Gram-negative genera in the untreated and HHP treated donkey milk.
Figures
(6)
Tables
(1)