-
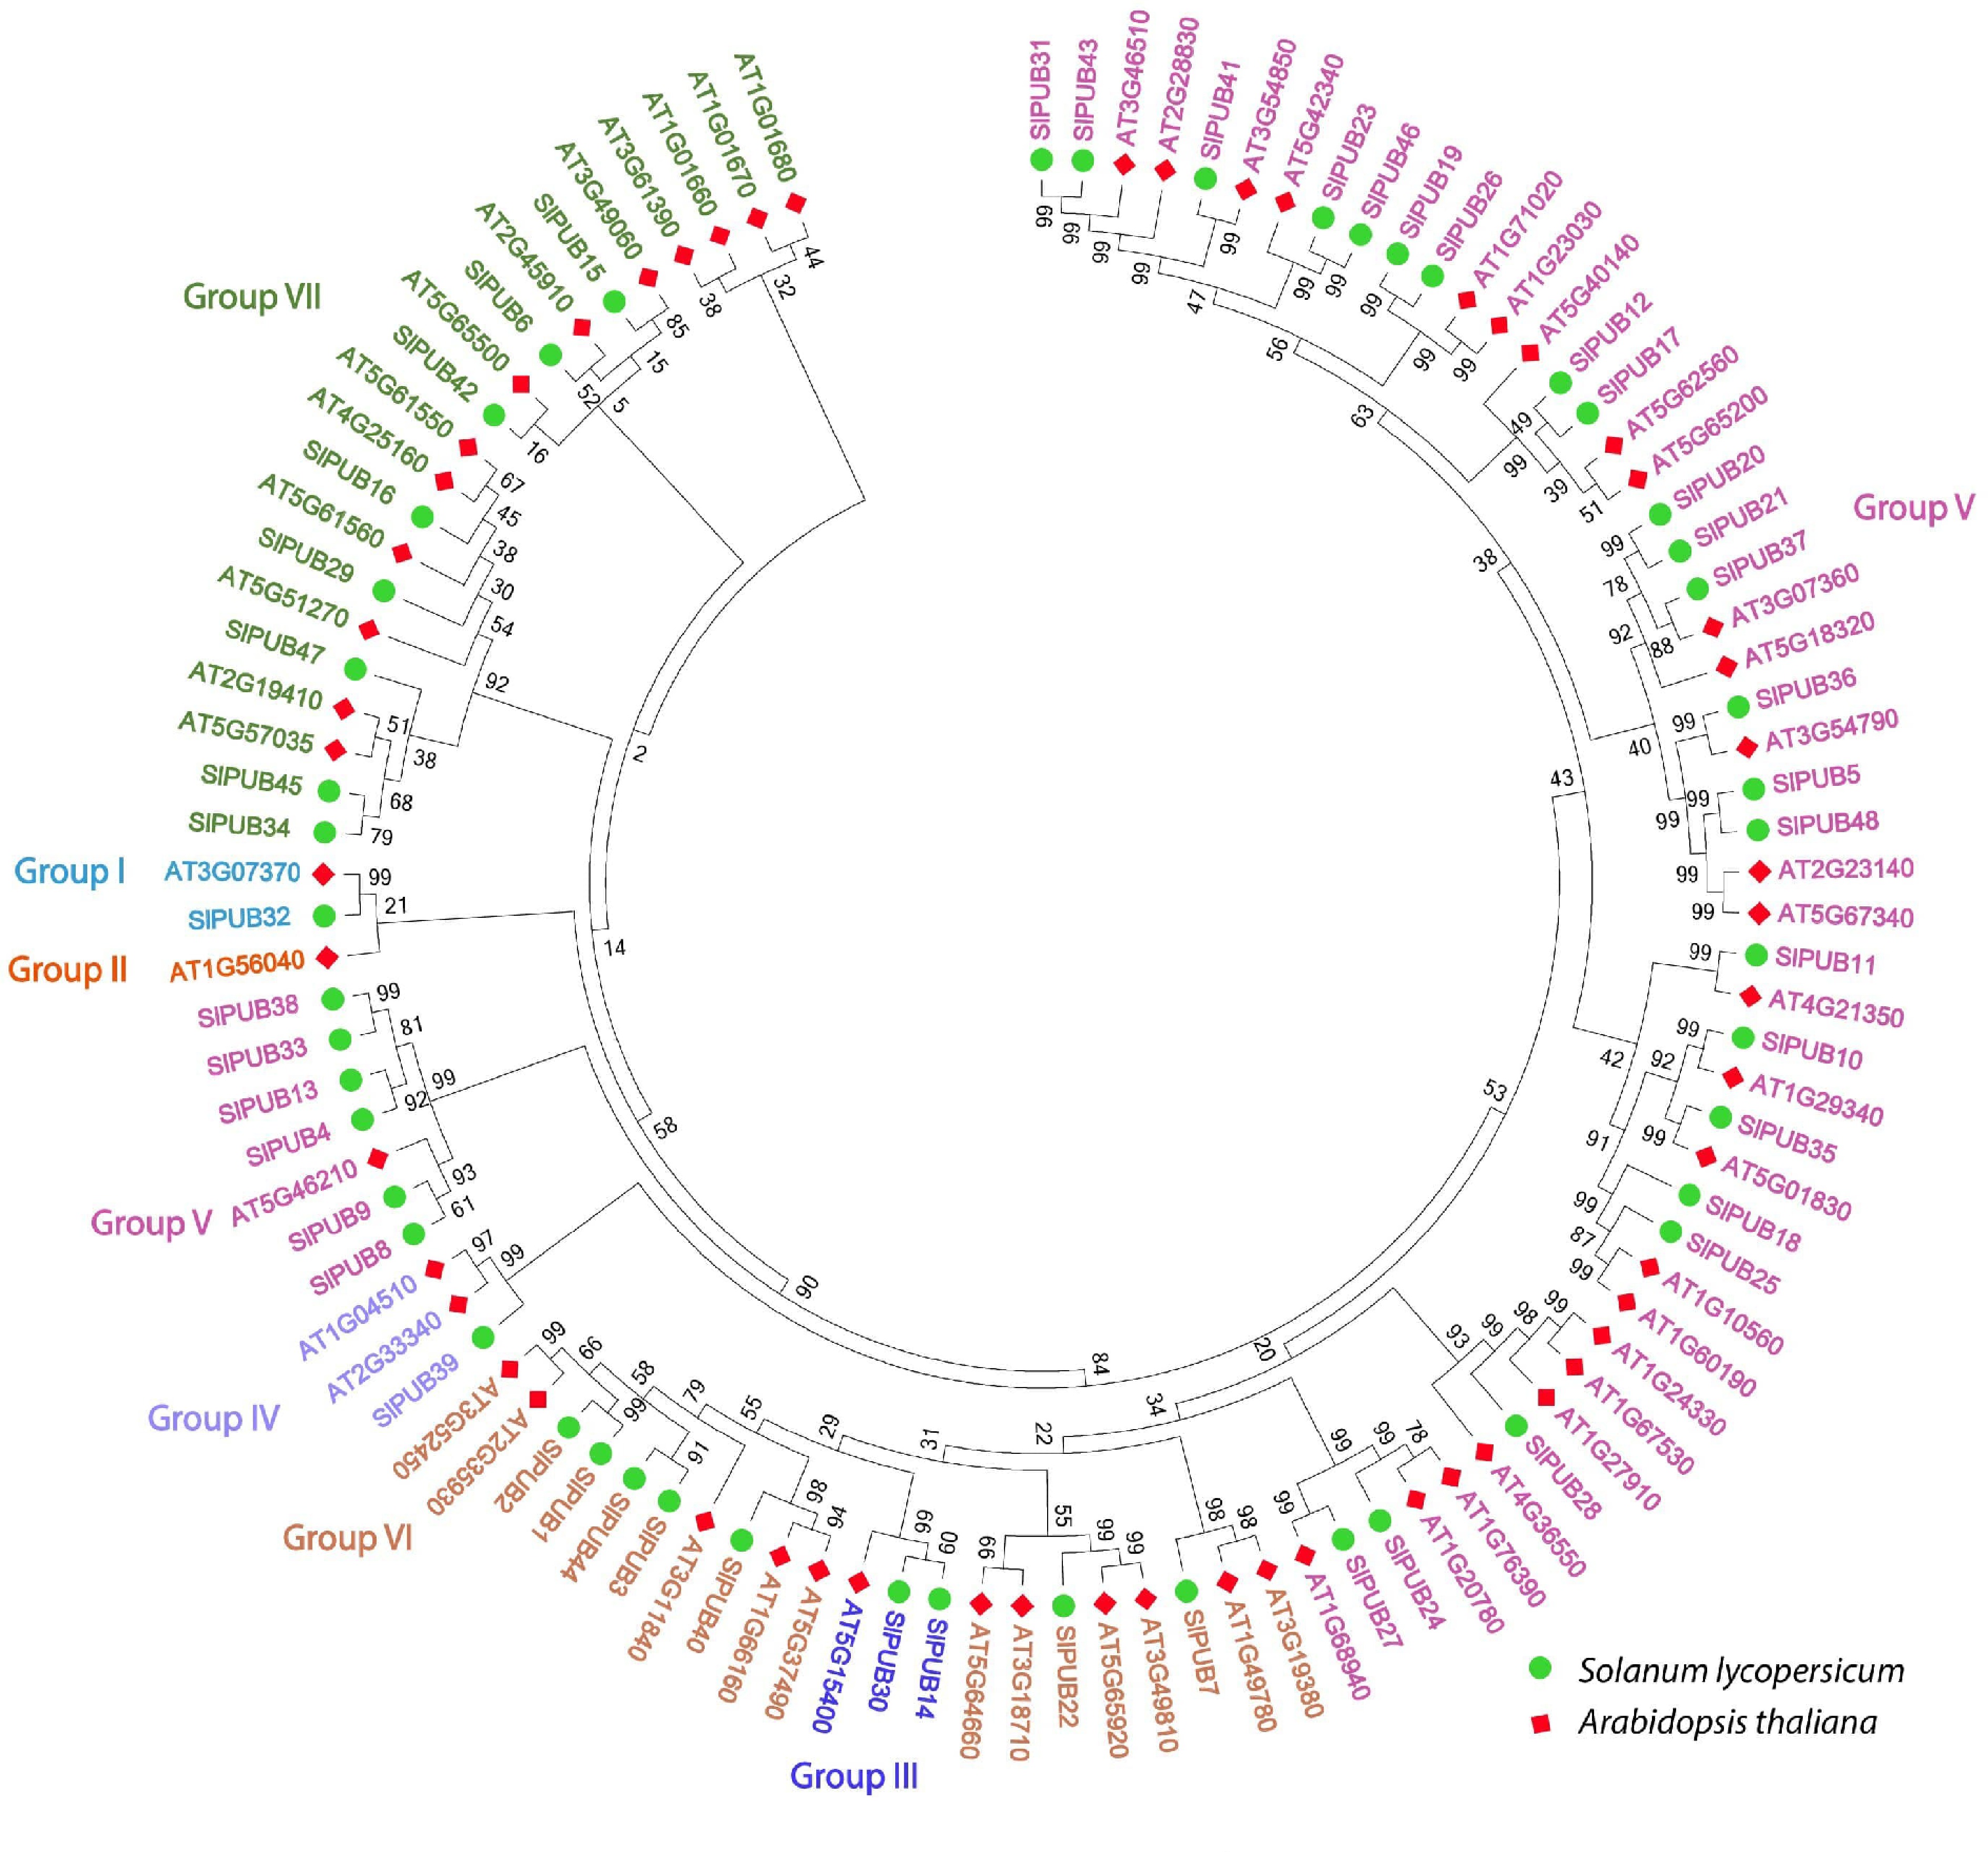
Figure 1.
Phylogenetic relationships of the PUB genes between tomato and Arabidopsis. The seven different subgroups of PUBs are indicated in different colors.
-
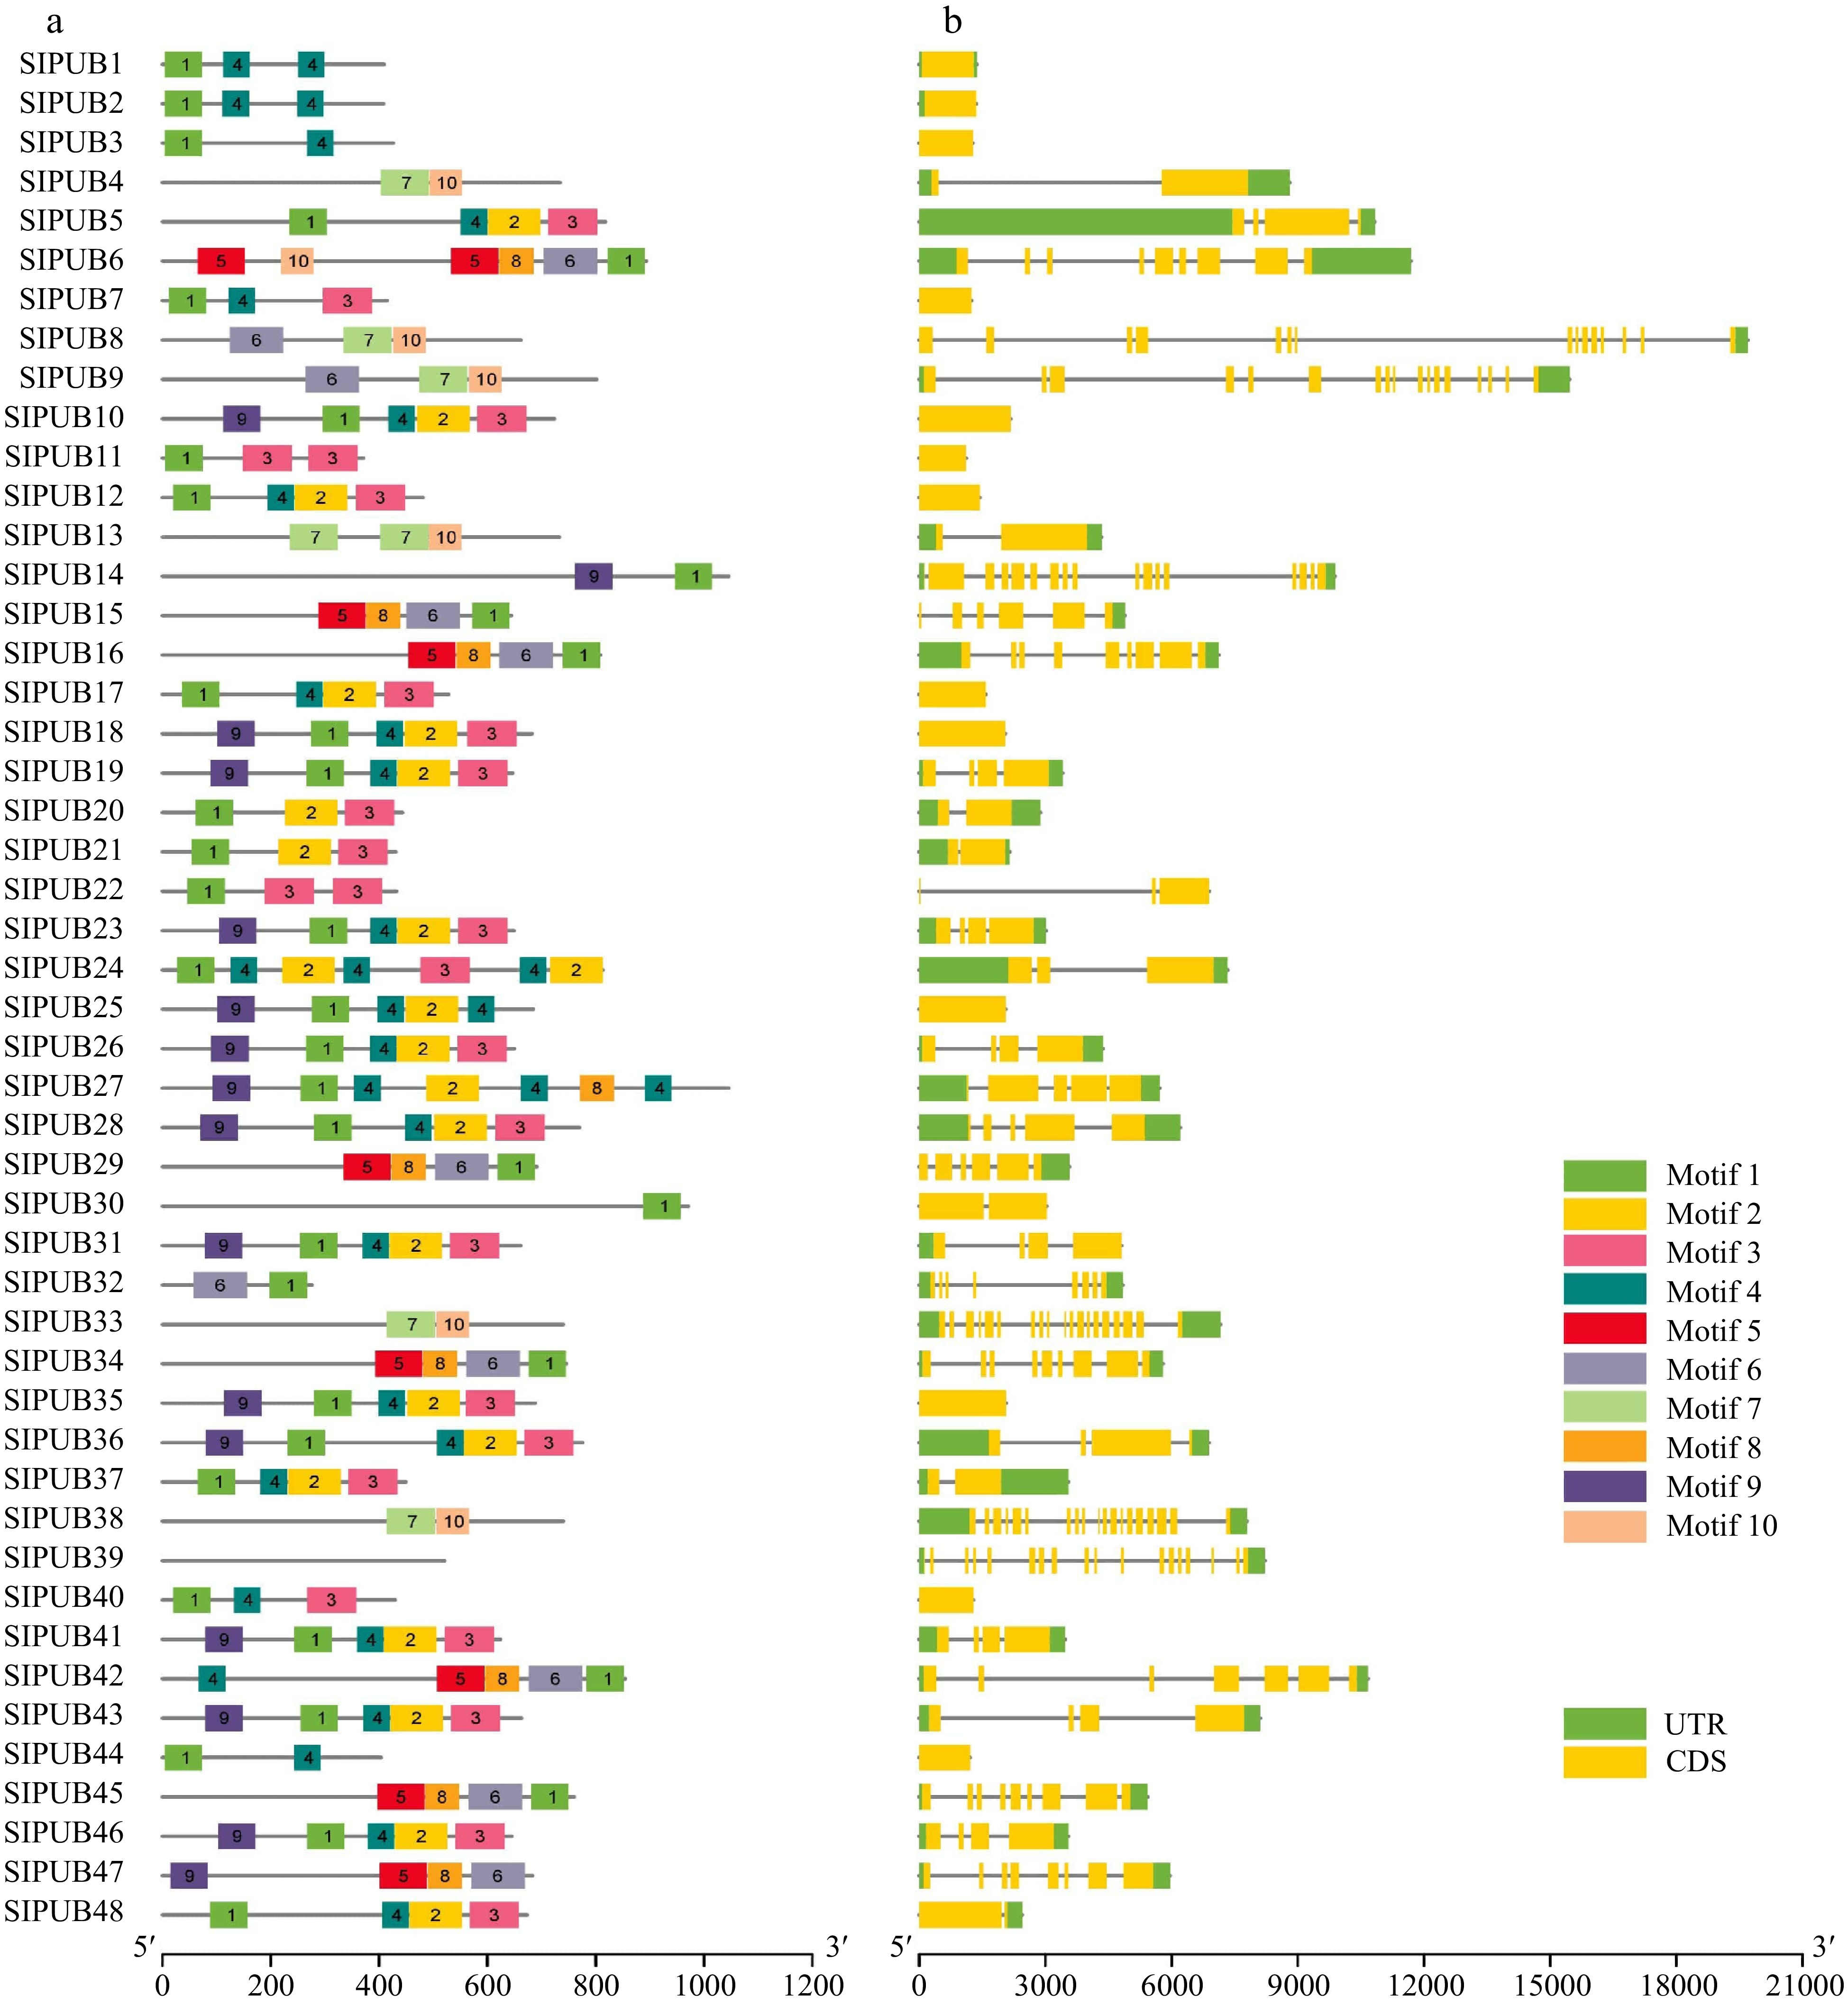
Figure 2.
(a) Motif structures and (b) gene structures of PUBs in tomato. The different motifs (Motif 1 − Motif 10) are displayed in different colors. The gene structures of PUBs are based on the coding sequences (CDS) and untranslated region (UTR) which are shown in yellow and green.
-
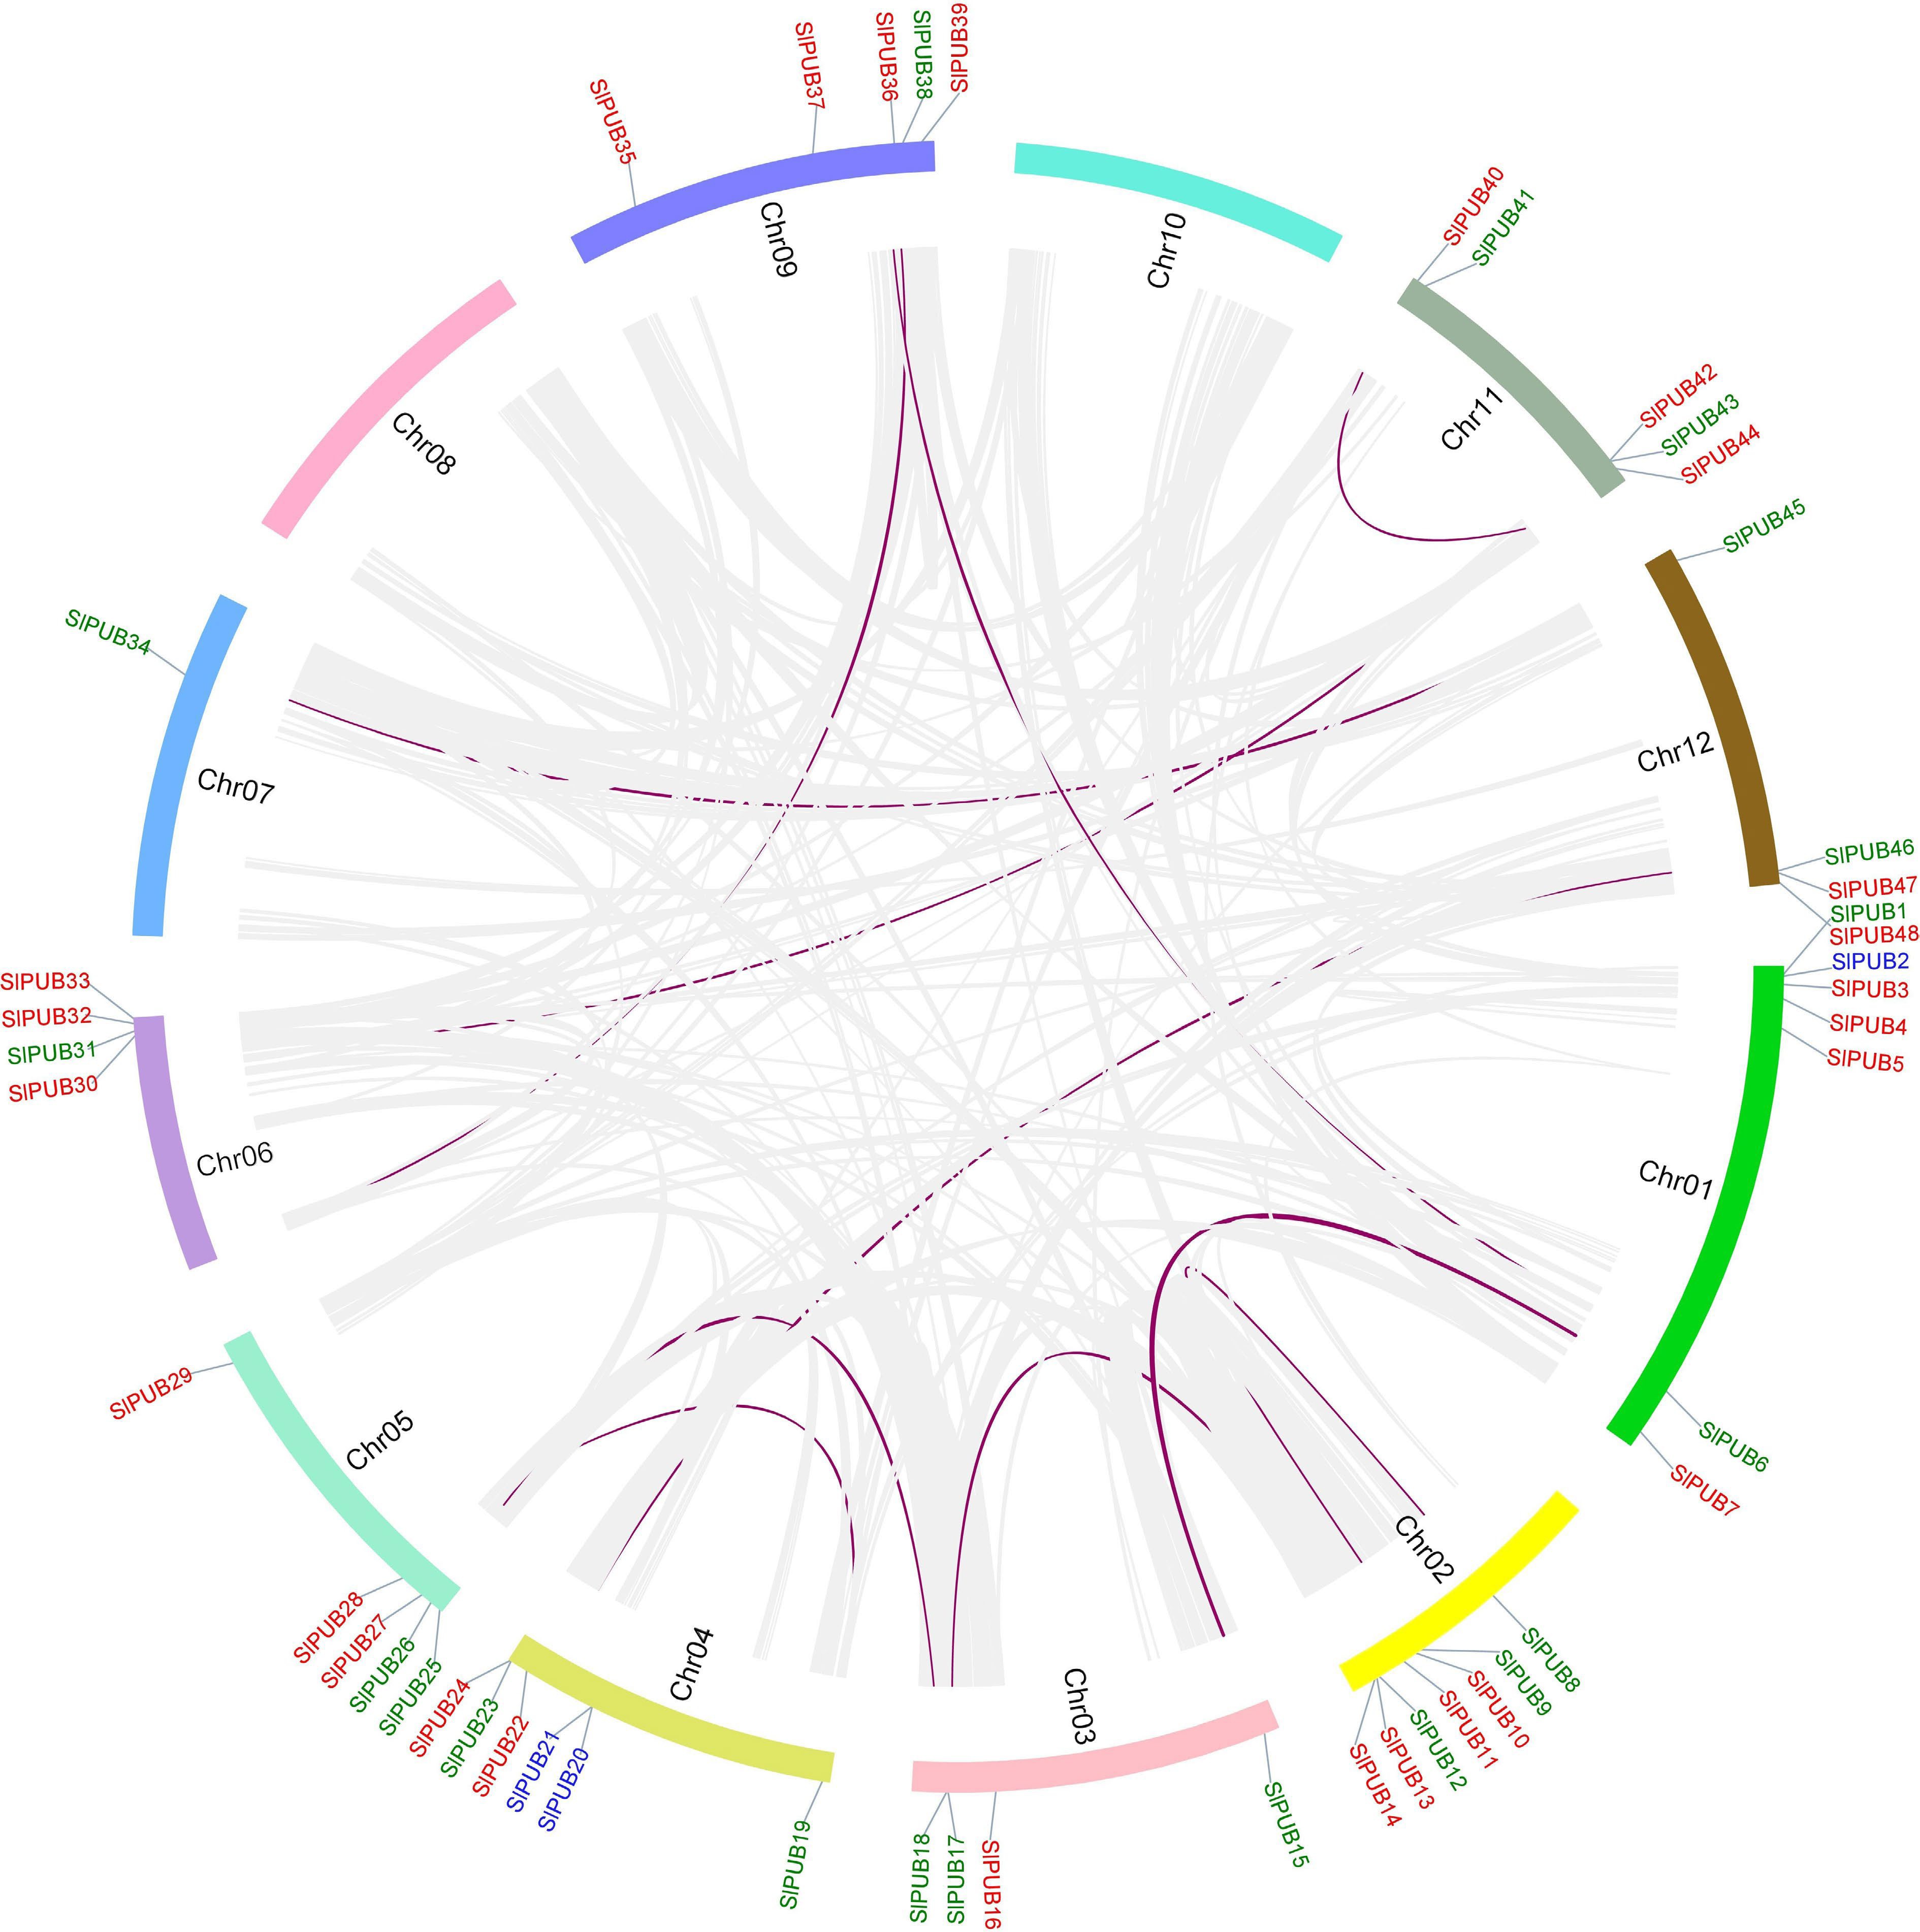
Figure 3.
Chromosomal locations of the PUB genes in the tomato genome from Chr1-Chr12. The collinear genes are presented inside the circle in purple. The different types of duplication such as dispersed, segmental, and tandem are marked in red, green, and blue.
-
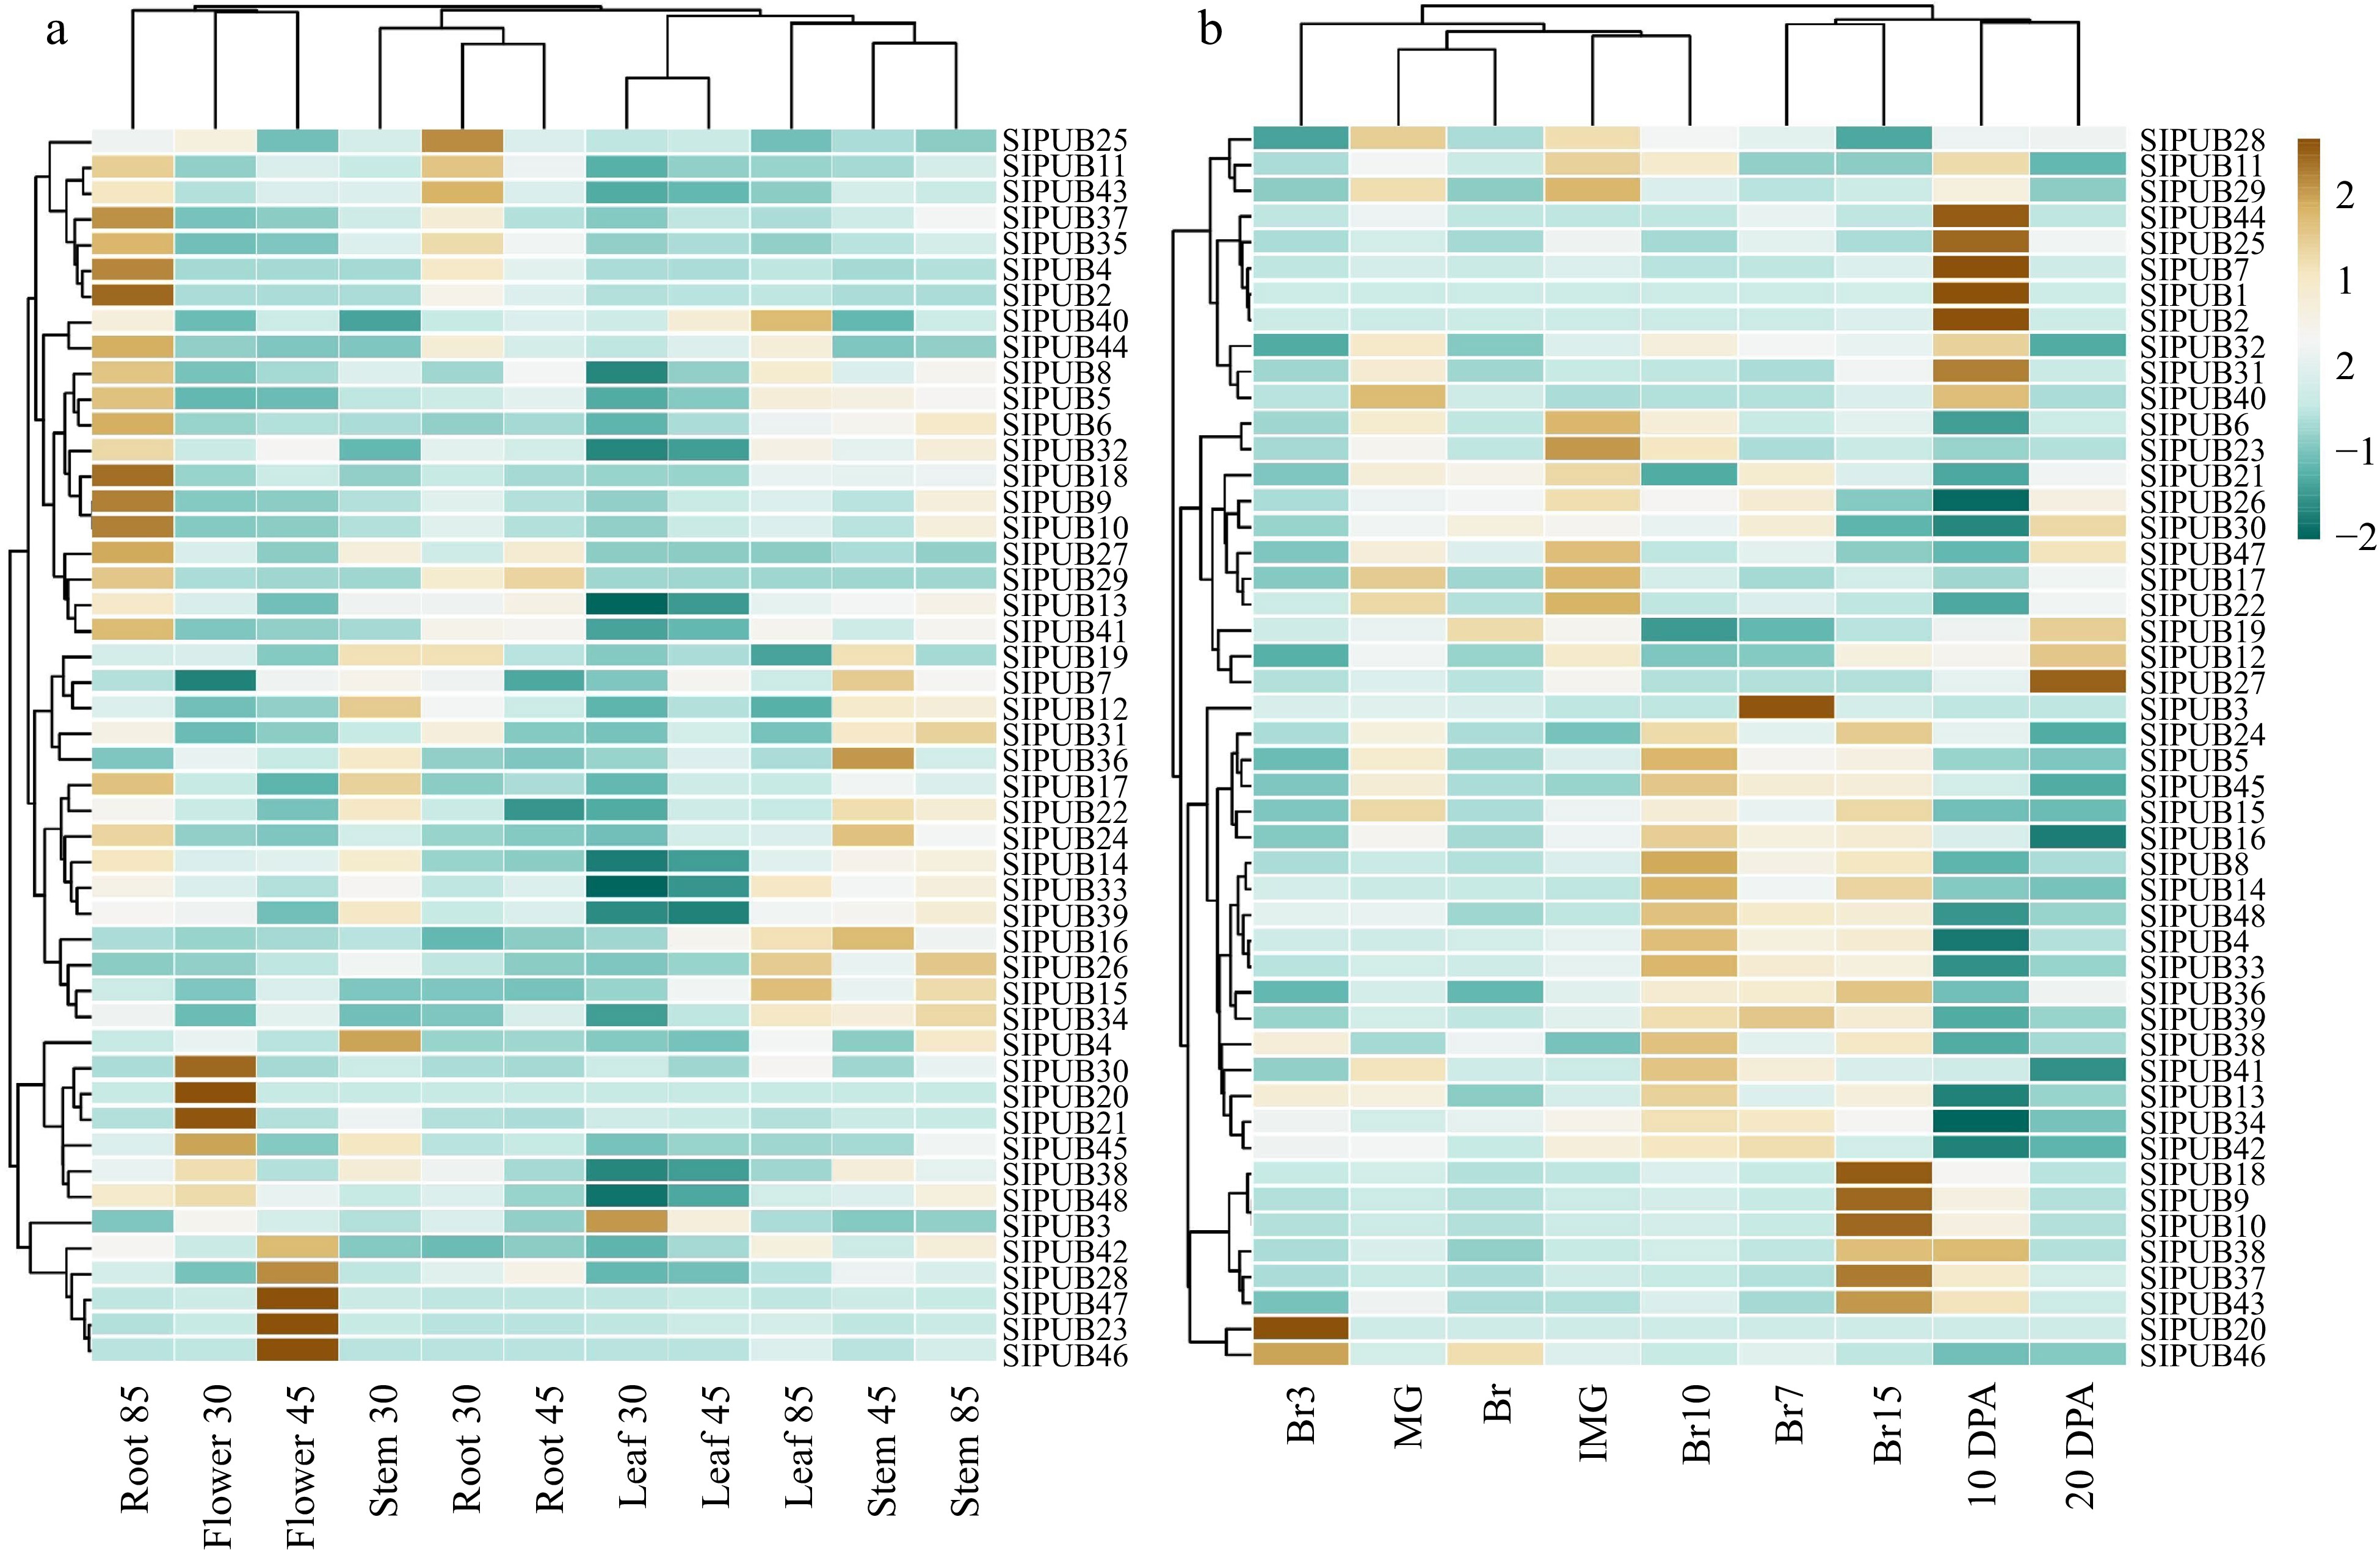
Figure 4.
Expression profiling of the 48 differentially expressed genes in multiple tissues based on RPKM values, including (a) Solanum lycopersicum cv. Heinz and (b) the wild relative Solanum pimpinellifolium. The brown bars represent up-regulated genes and dark blue bars represent down regulation.
-
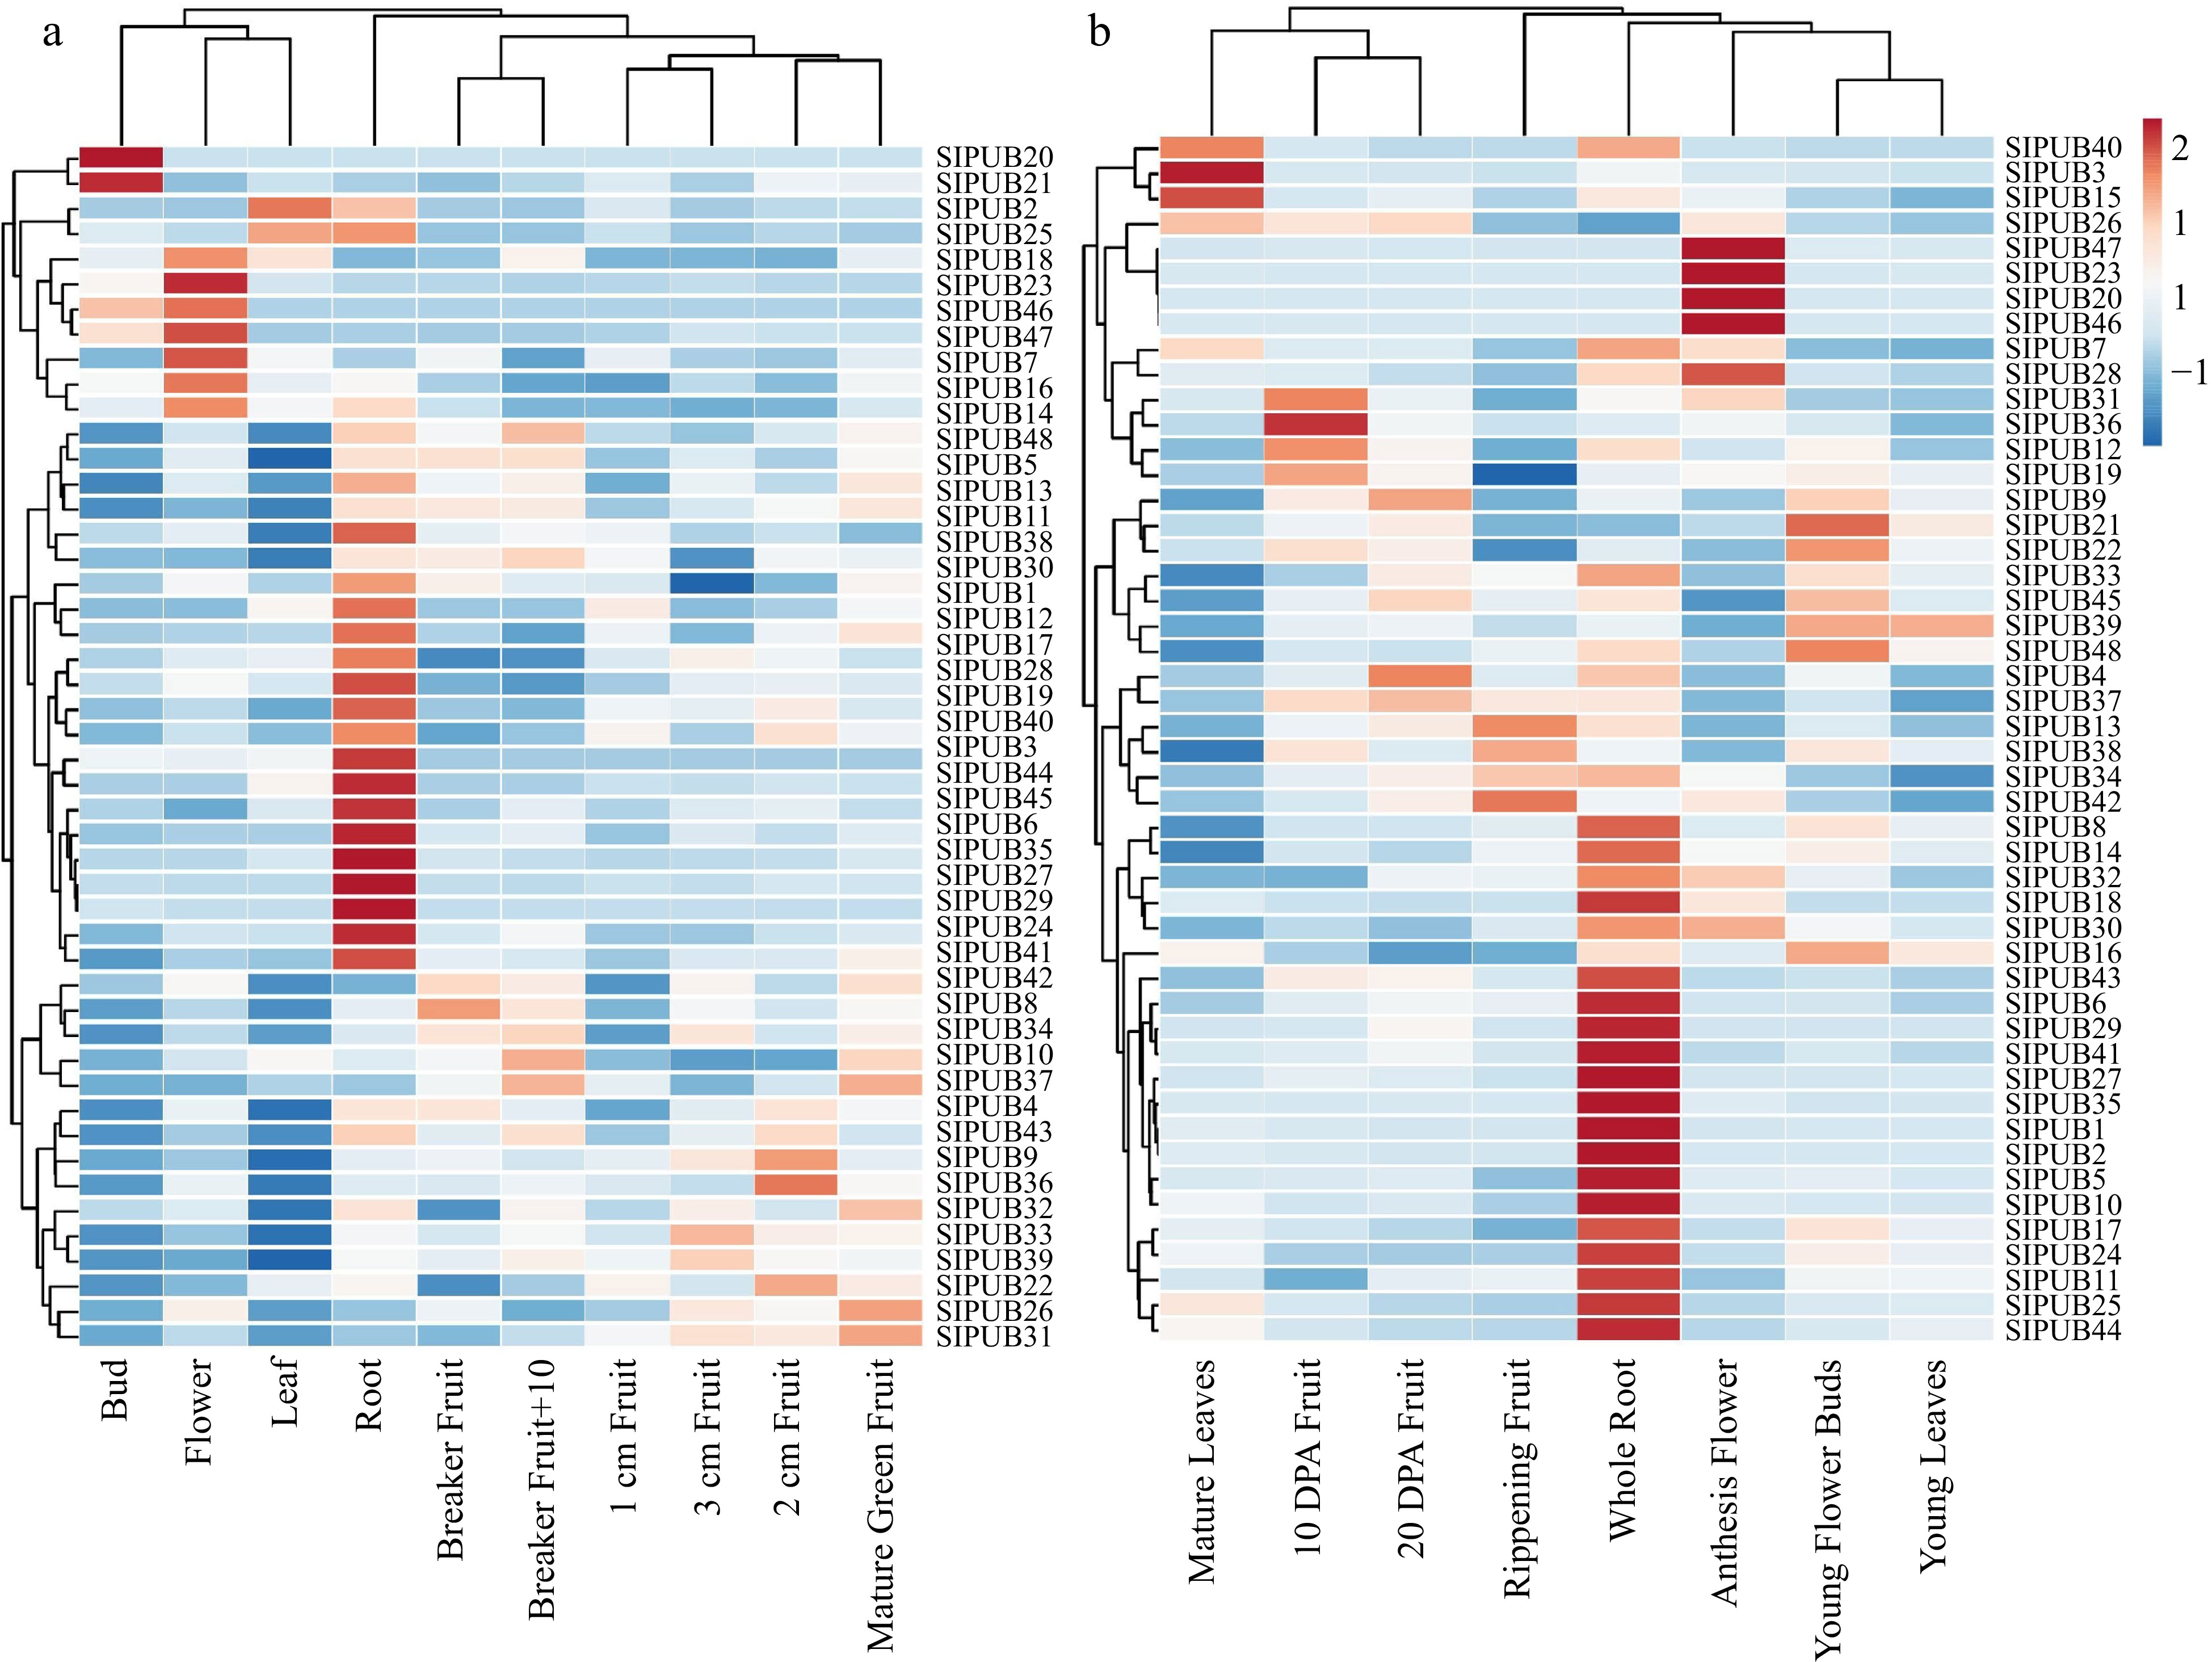
Figure 5.
Expression profiling of the 48 differentially expressed PUB genes from MT data based on RPKM values, including (a) different developmental stages and (b) different organs. Red bars represent up-regulated genes and blue bars represent down-regulation.
-
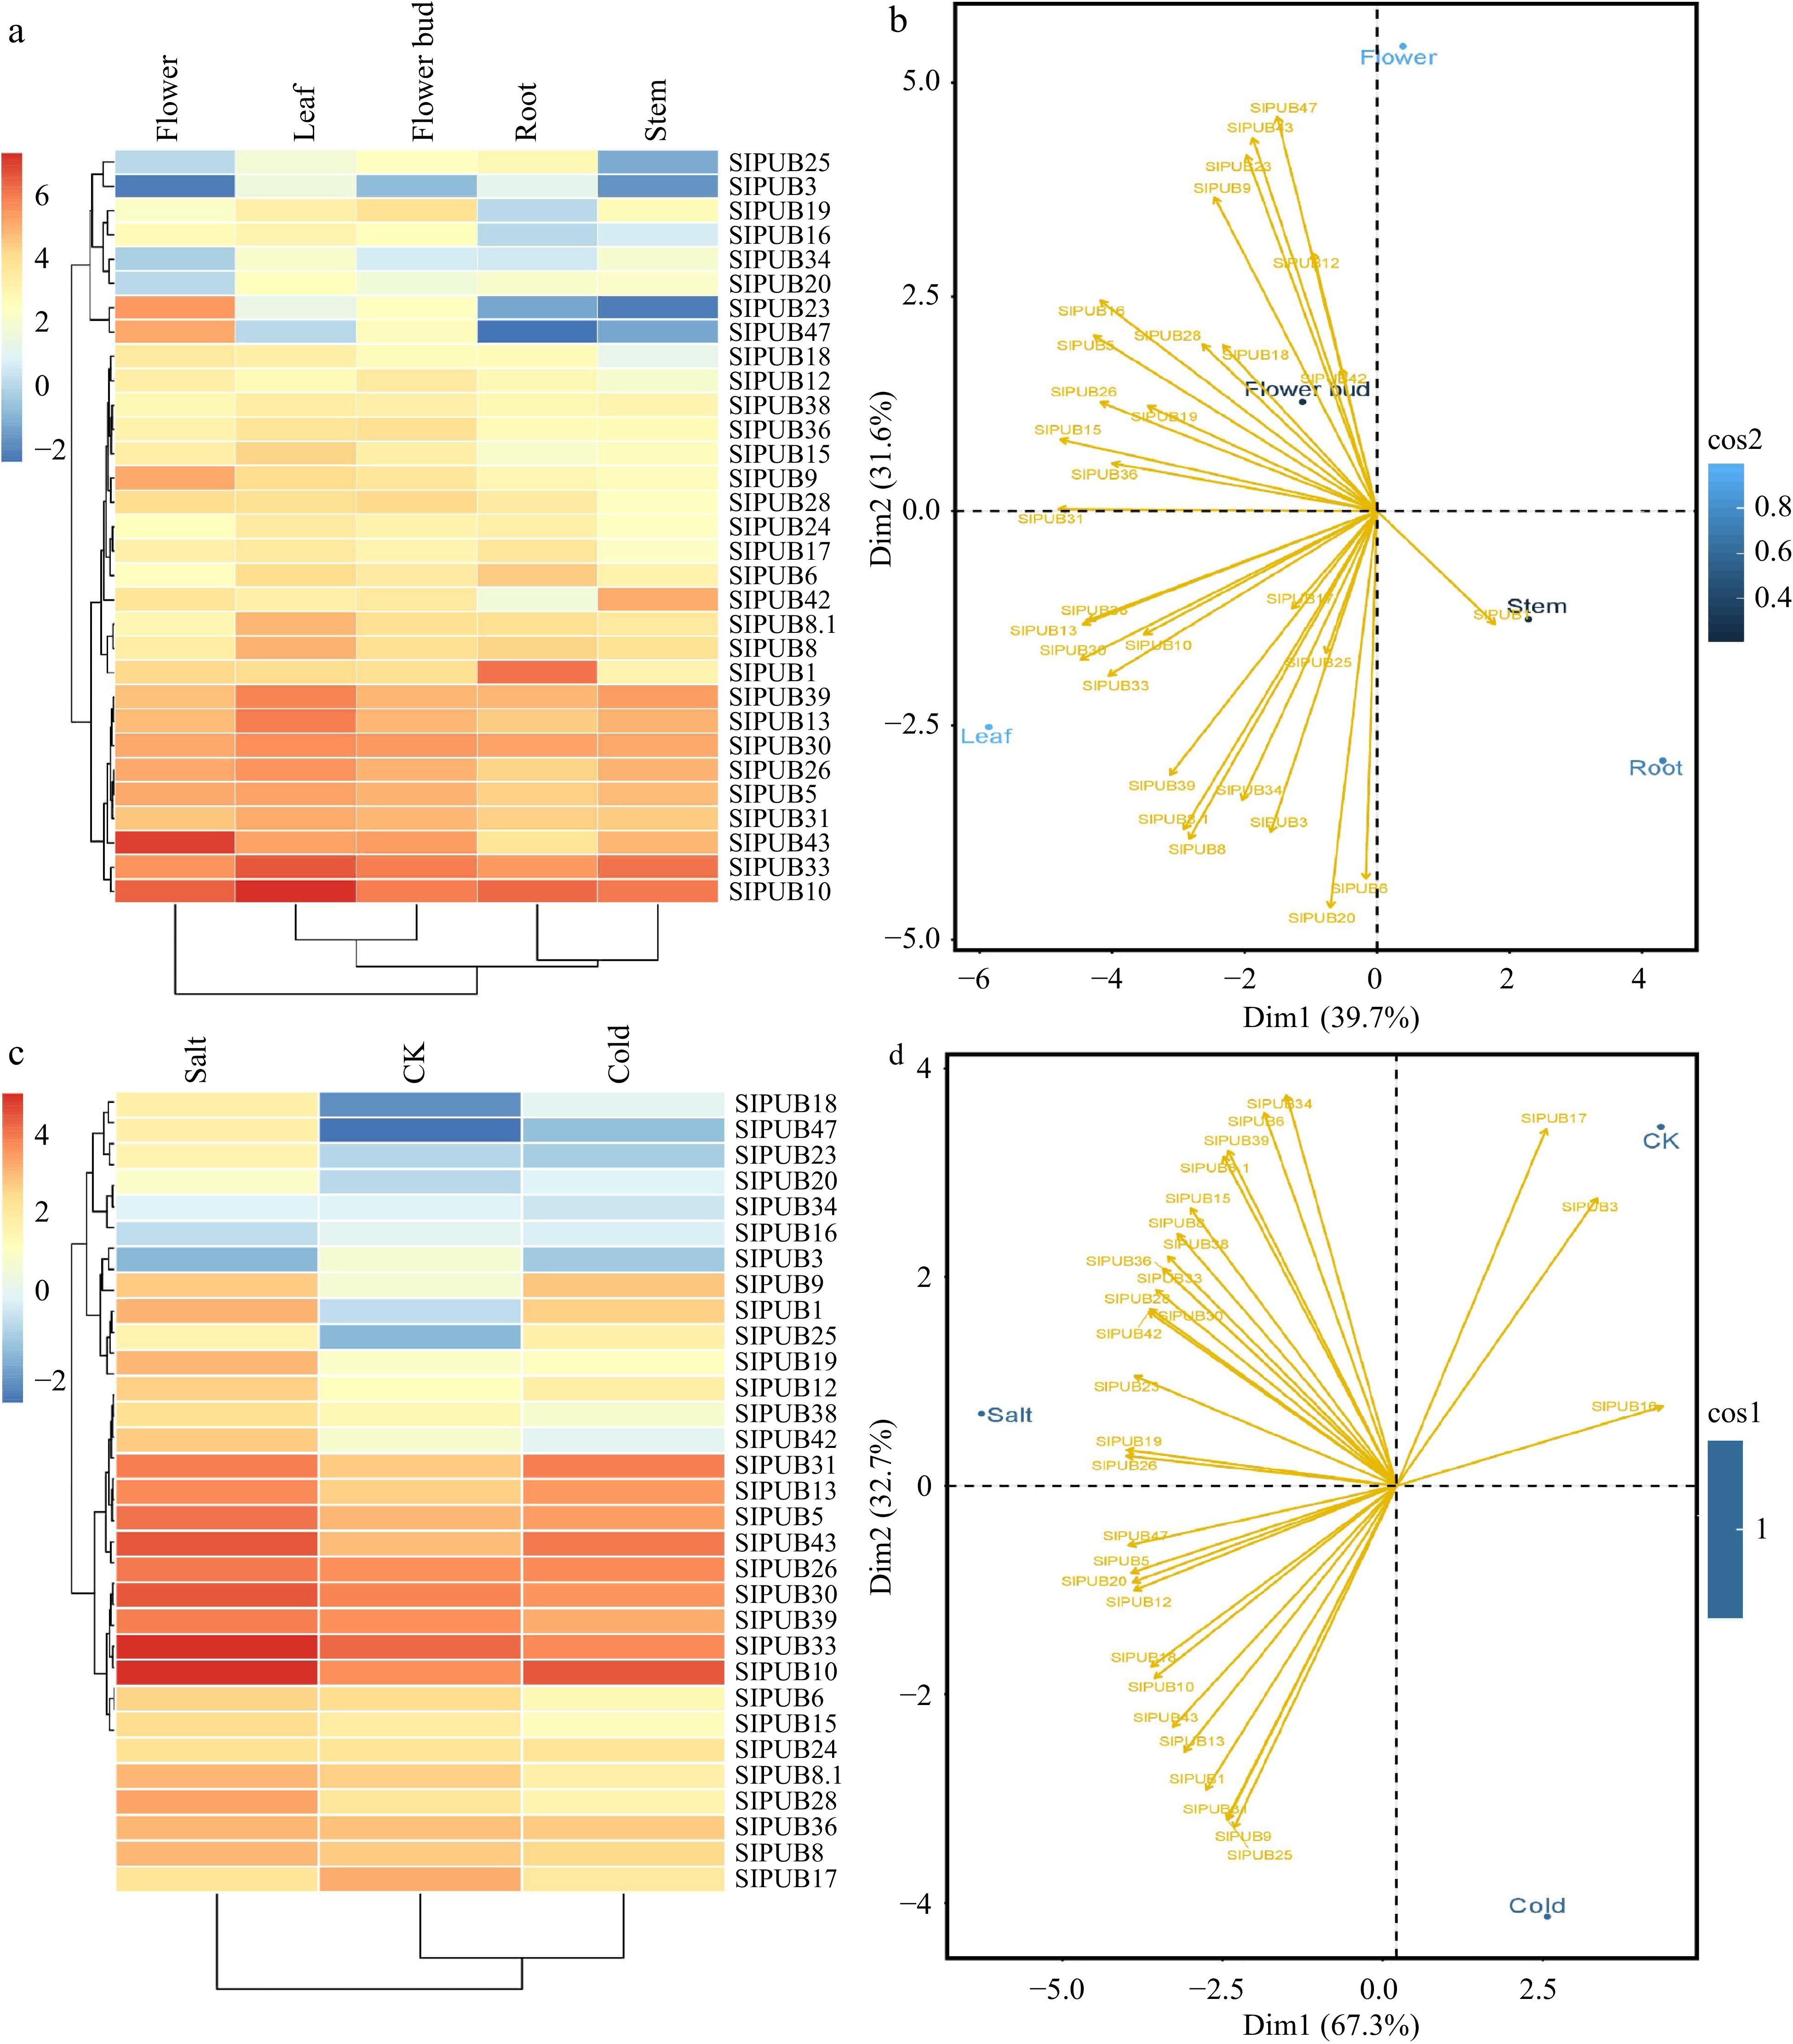
Figure 6.
Relative expressions of SlPUBs (a) and (c) in five different tissues including root, stem, leaf, flower, and flower bud, and two stress conditions i.e., salt (200 mM) and cold stress (4 °C). The principal component analysis for (b) different tissues and (d) stress conditions.
-
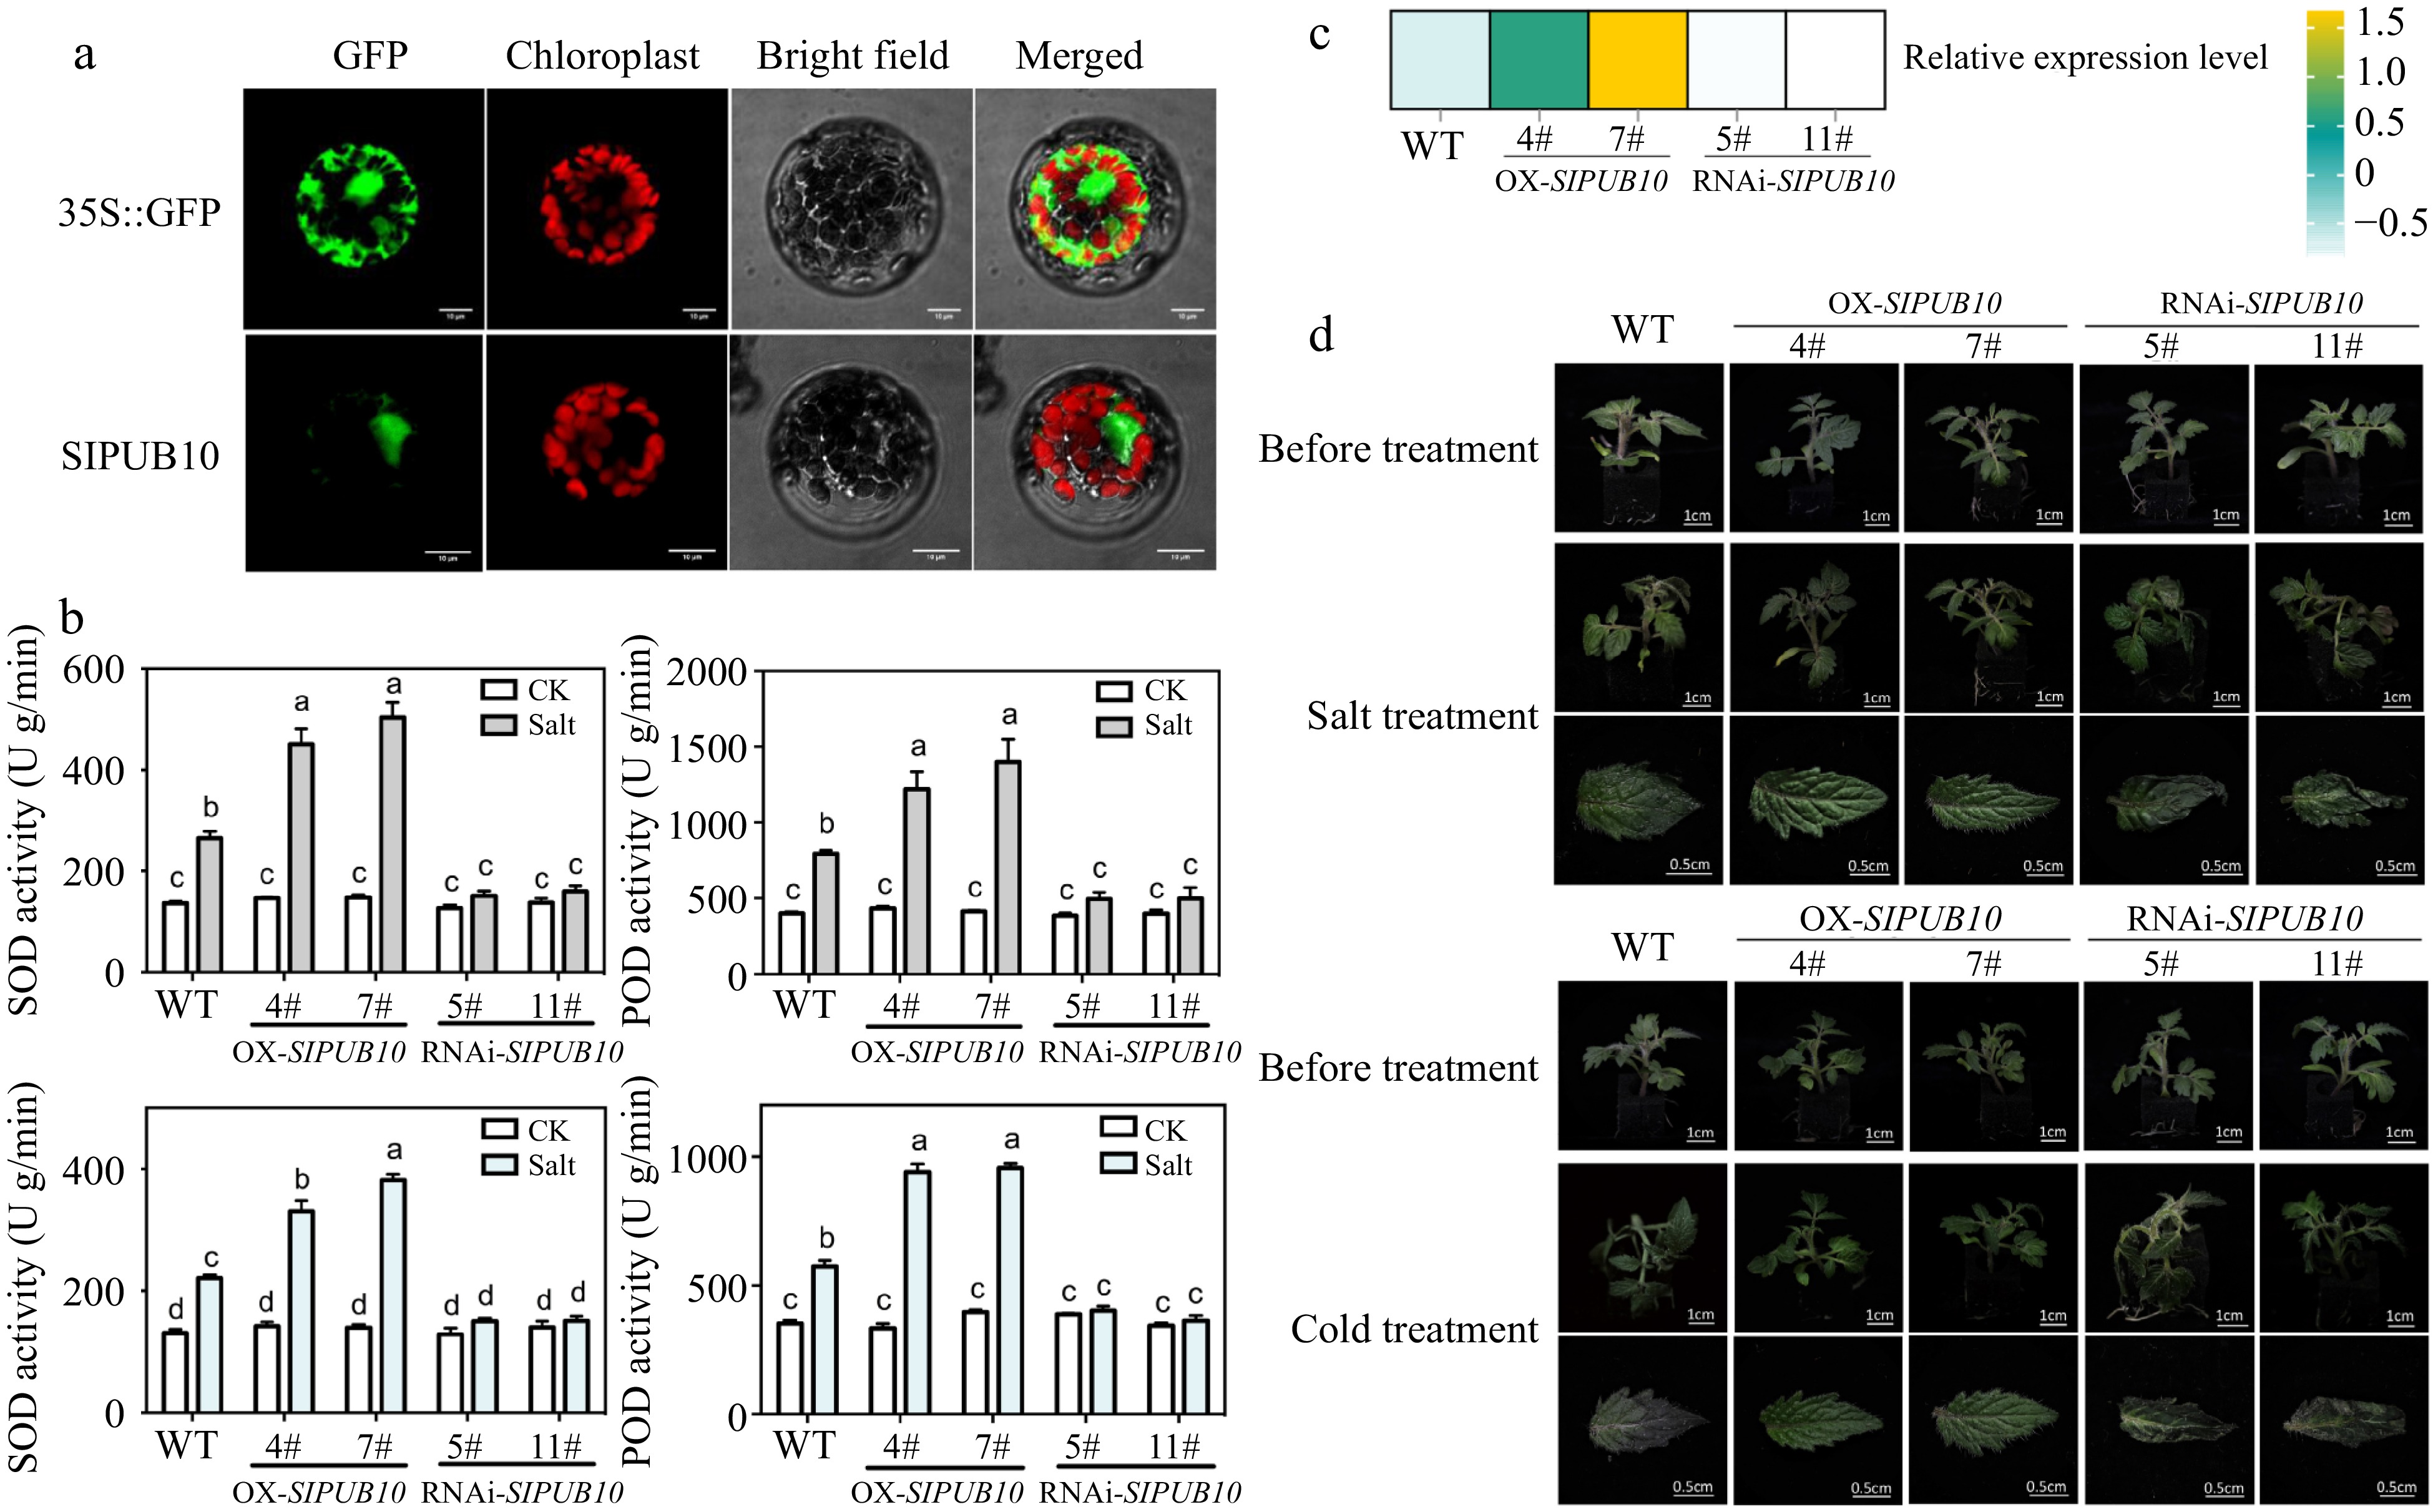
Figure 7.
Gene function verification of SlPUB10. (a) The proteins’ subcellular locazation in Arabidopsis protoplasts. (b) The activity of SOD and POD in leaves of wild-type (WT) and transgenic tomato lines after salt (200 mM NaCl) and cold treatment (4 °C) for 4 h. The P values indicate the results from pairwise comparisons of one-way ANOVA tests. Different letters represent a significant difference at P < 0.05. (c) The relative expression level of SlPUB10 in transgenic lines. (d) Phenotypes of WT and transgenic lines after 48 h of salt (200 mM NaCl) and cold treatment (4 °C).
-
Gene 1 Gene 2 Ks Ka Ka/Ks Selection pressure Gene duplications SlPUB3 SlPUB4 0.74 0.59 0.80 Dispersed Purifying SlPUB5 SlPUB7 0.68 0.62 0.92 Dispersed Purifying SlPUB10 SlPUB11 0.65 0.59 0.90 Dispersed Purifying SlPUB13 SlPUB14 0.80 0.59 0.73 Dispersed Purifying SlPUB16 SlPUB22 0.58 0.61 1.06 Dispersed Positive SlPUB24 SlPUB27 0.70 0.68 0.98 Dispersed Purifying SlPUB28 SlPUB29 0.88 0.63 0.71 Dispersed Purifying SlPUB30 SlPUB32 0.44 0.45 1.03 Dispersed Positive SlPUB33 SlPUB35 0.88 0.62 0.70 Dispersed Purifying SlPUB36 SlPUB37 0.46 0.67 1.45 Dispersed Positive SlPUB39 SlPUB40 0.78 0.65 0.83 Dispersed Purifying SlPUB42 SlPUB44 0.72 0.53 0.73 Dispersed Purifying SlPUB47 SlPUB48 0.75 0.61 0.82 Dispersed Purifying SlPUB20 SlPUB21 0.22 0.11 0.52 Tandem Purifying SlPUB1 SlPUB6 0.63 0.46 0.74 WGD or Segmental Purifying SlPUB8 SlPUB9 0.65 0.05 0.07 WGD or Segmental Purifying SlPUB12 SlPUB15 0.74 0.61 0.82 WGD or Segmental Purifying SlPUB17 SlPUB18 0.76 0.65 0.86 WGD or Segmental Purifying SlPUB19 SlPUB23 1.08 0.55 0.51 WGD or Segmental Purifying SlPUB25 SlPUB26 0.76 0.66 0.87 WGD or Segmental Purifying SlPUB31 SlPUB34 0.77 0.62 0.80 WGD or Segmental Purifying SlPUB38 SlPUB41 0.79 0.61 0.77 WGD or Segmental Purifying SlPUB43 SlPUB45 0.80 0.64 0.80 WGD or Segmental Purifying Table 1.
Gene duplications of PUB genes in tomato with outlier Ka/Ks values.
Figures
(7)
Tables
(1)