-
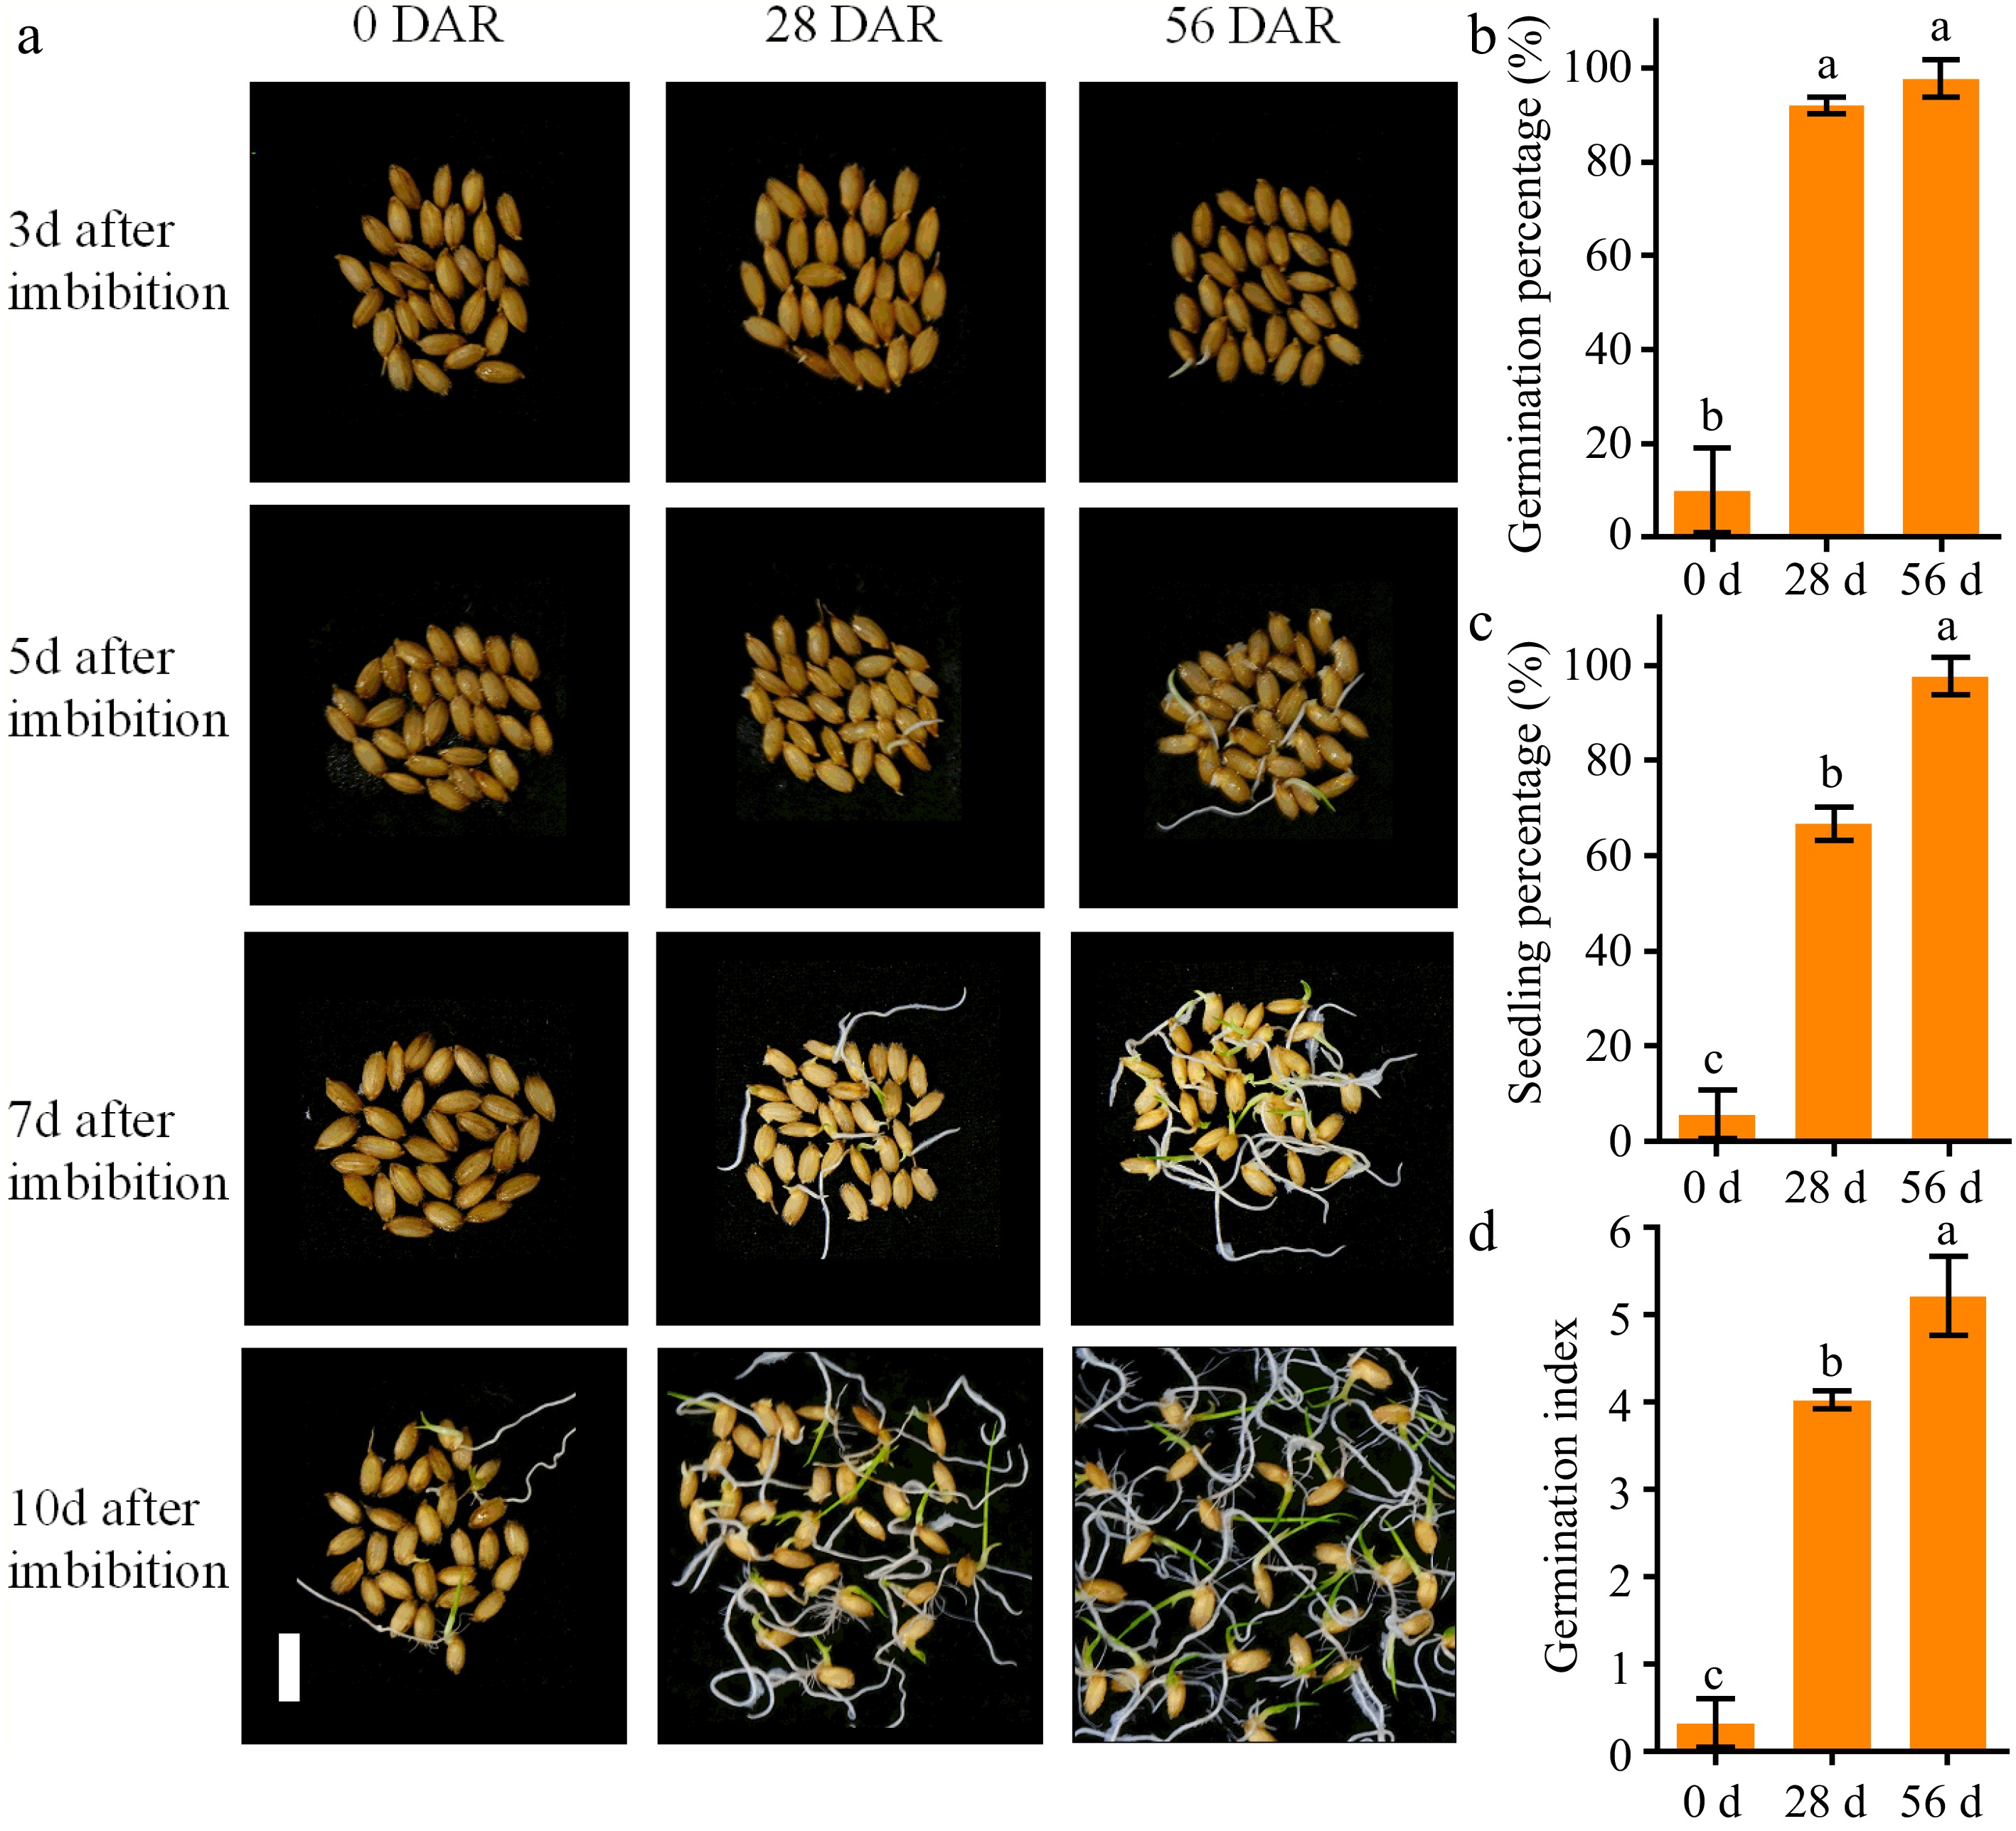
Figure 1.
Changes in seed germination and seedling emergence in Nipponbare seeds at 0, 28, and 56 DAR. (a) Phenotypic graphics of seed germination at 3, 5, 7 and 10 d of imbibition in NPB seeds at 0, 28 and 56 DAR. (b) Comparison of germination percentage, (c) seedling percentage and (d) germination index at 10 d of imbibition in NPB seeds at 0, 28, and 56 DAR. NPB represents Nipponbare. DAR represents day after-ripening. Bars = 1 cm. Each column presents the means ± standard deviations of three biological replicates. Different lower case letters above columns indicate statistical differences at P < 0.05.
-
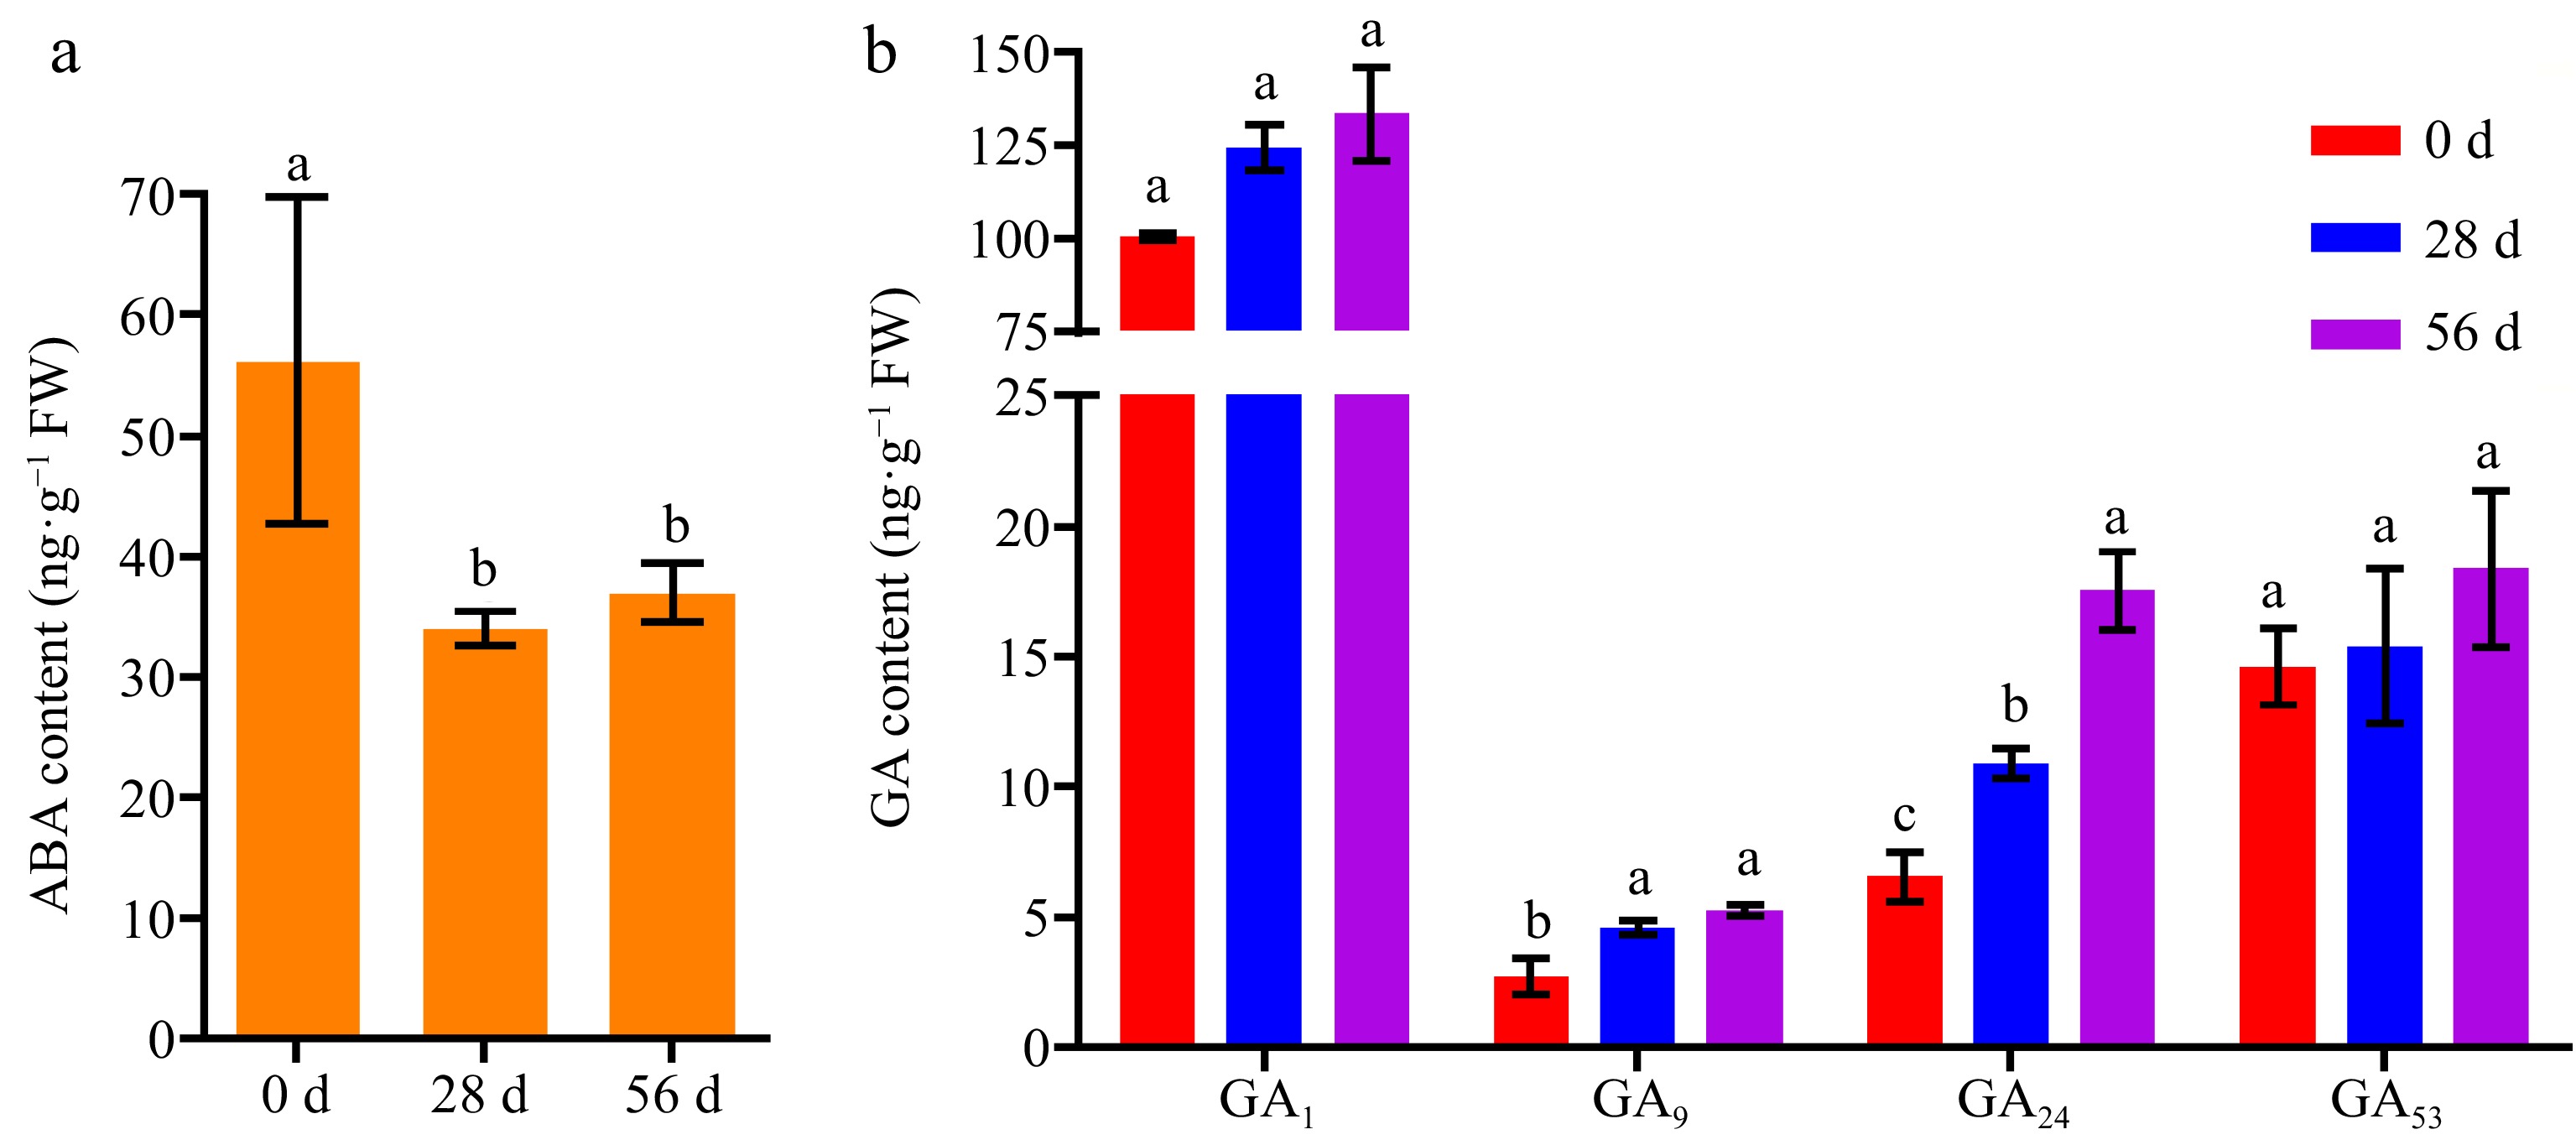
Figure 2.
Contents of ABA and GAs in Nipponbare seeds at 0, 28, and 56 DAR. (a) Content of ABA in Nipponbare seeds at 0, 28, and 56 DAR. (b) Content of GAs in NPB seeds at 0, 28, and 56 DAR. NPB represents Nipponbare. Different lower case letters above columns indicate statistical differences at P < 0.05.
-
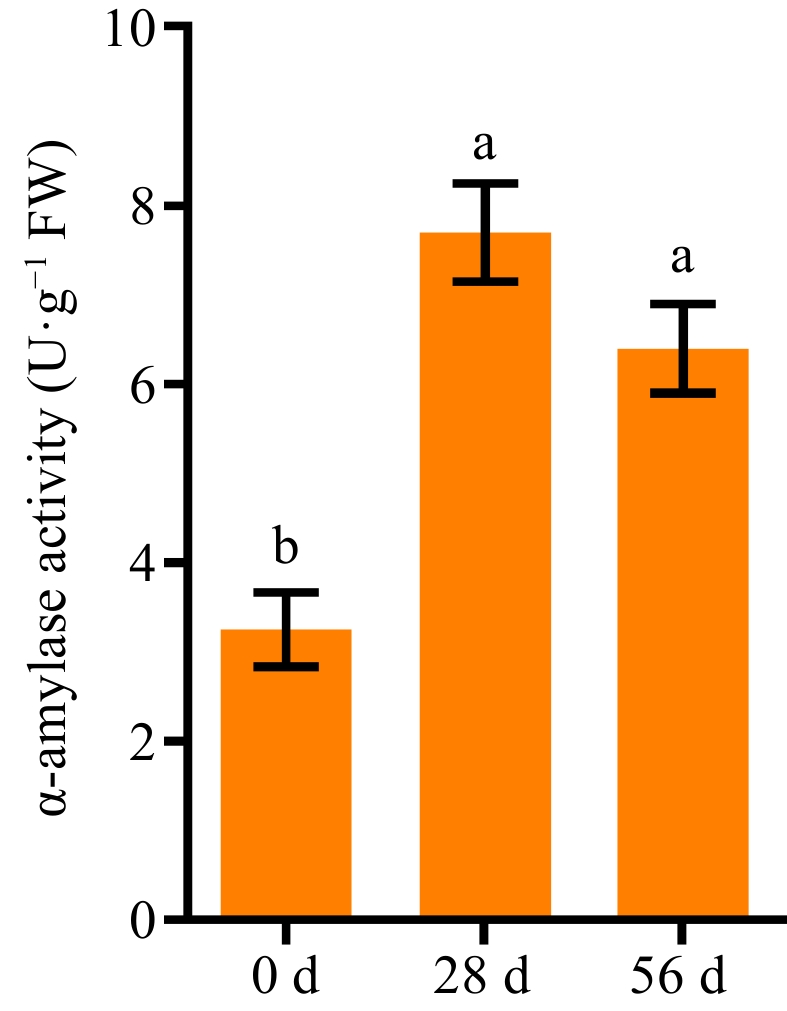
Figure 3.
The activity of α-amylase in Nipponbare seeds at 0, 28, and 56 DAR. Each column presents the means ± standard deviations of three biological replicates. Different lower case letters above columns indicate statistical differences at P < 0.05.
-
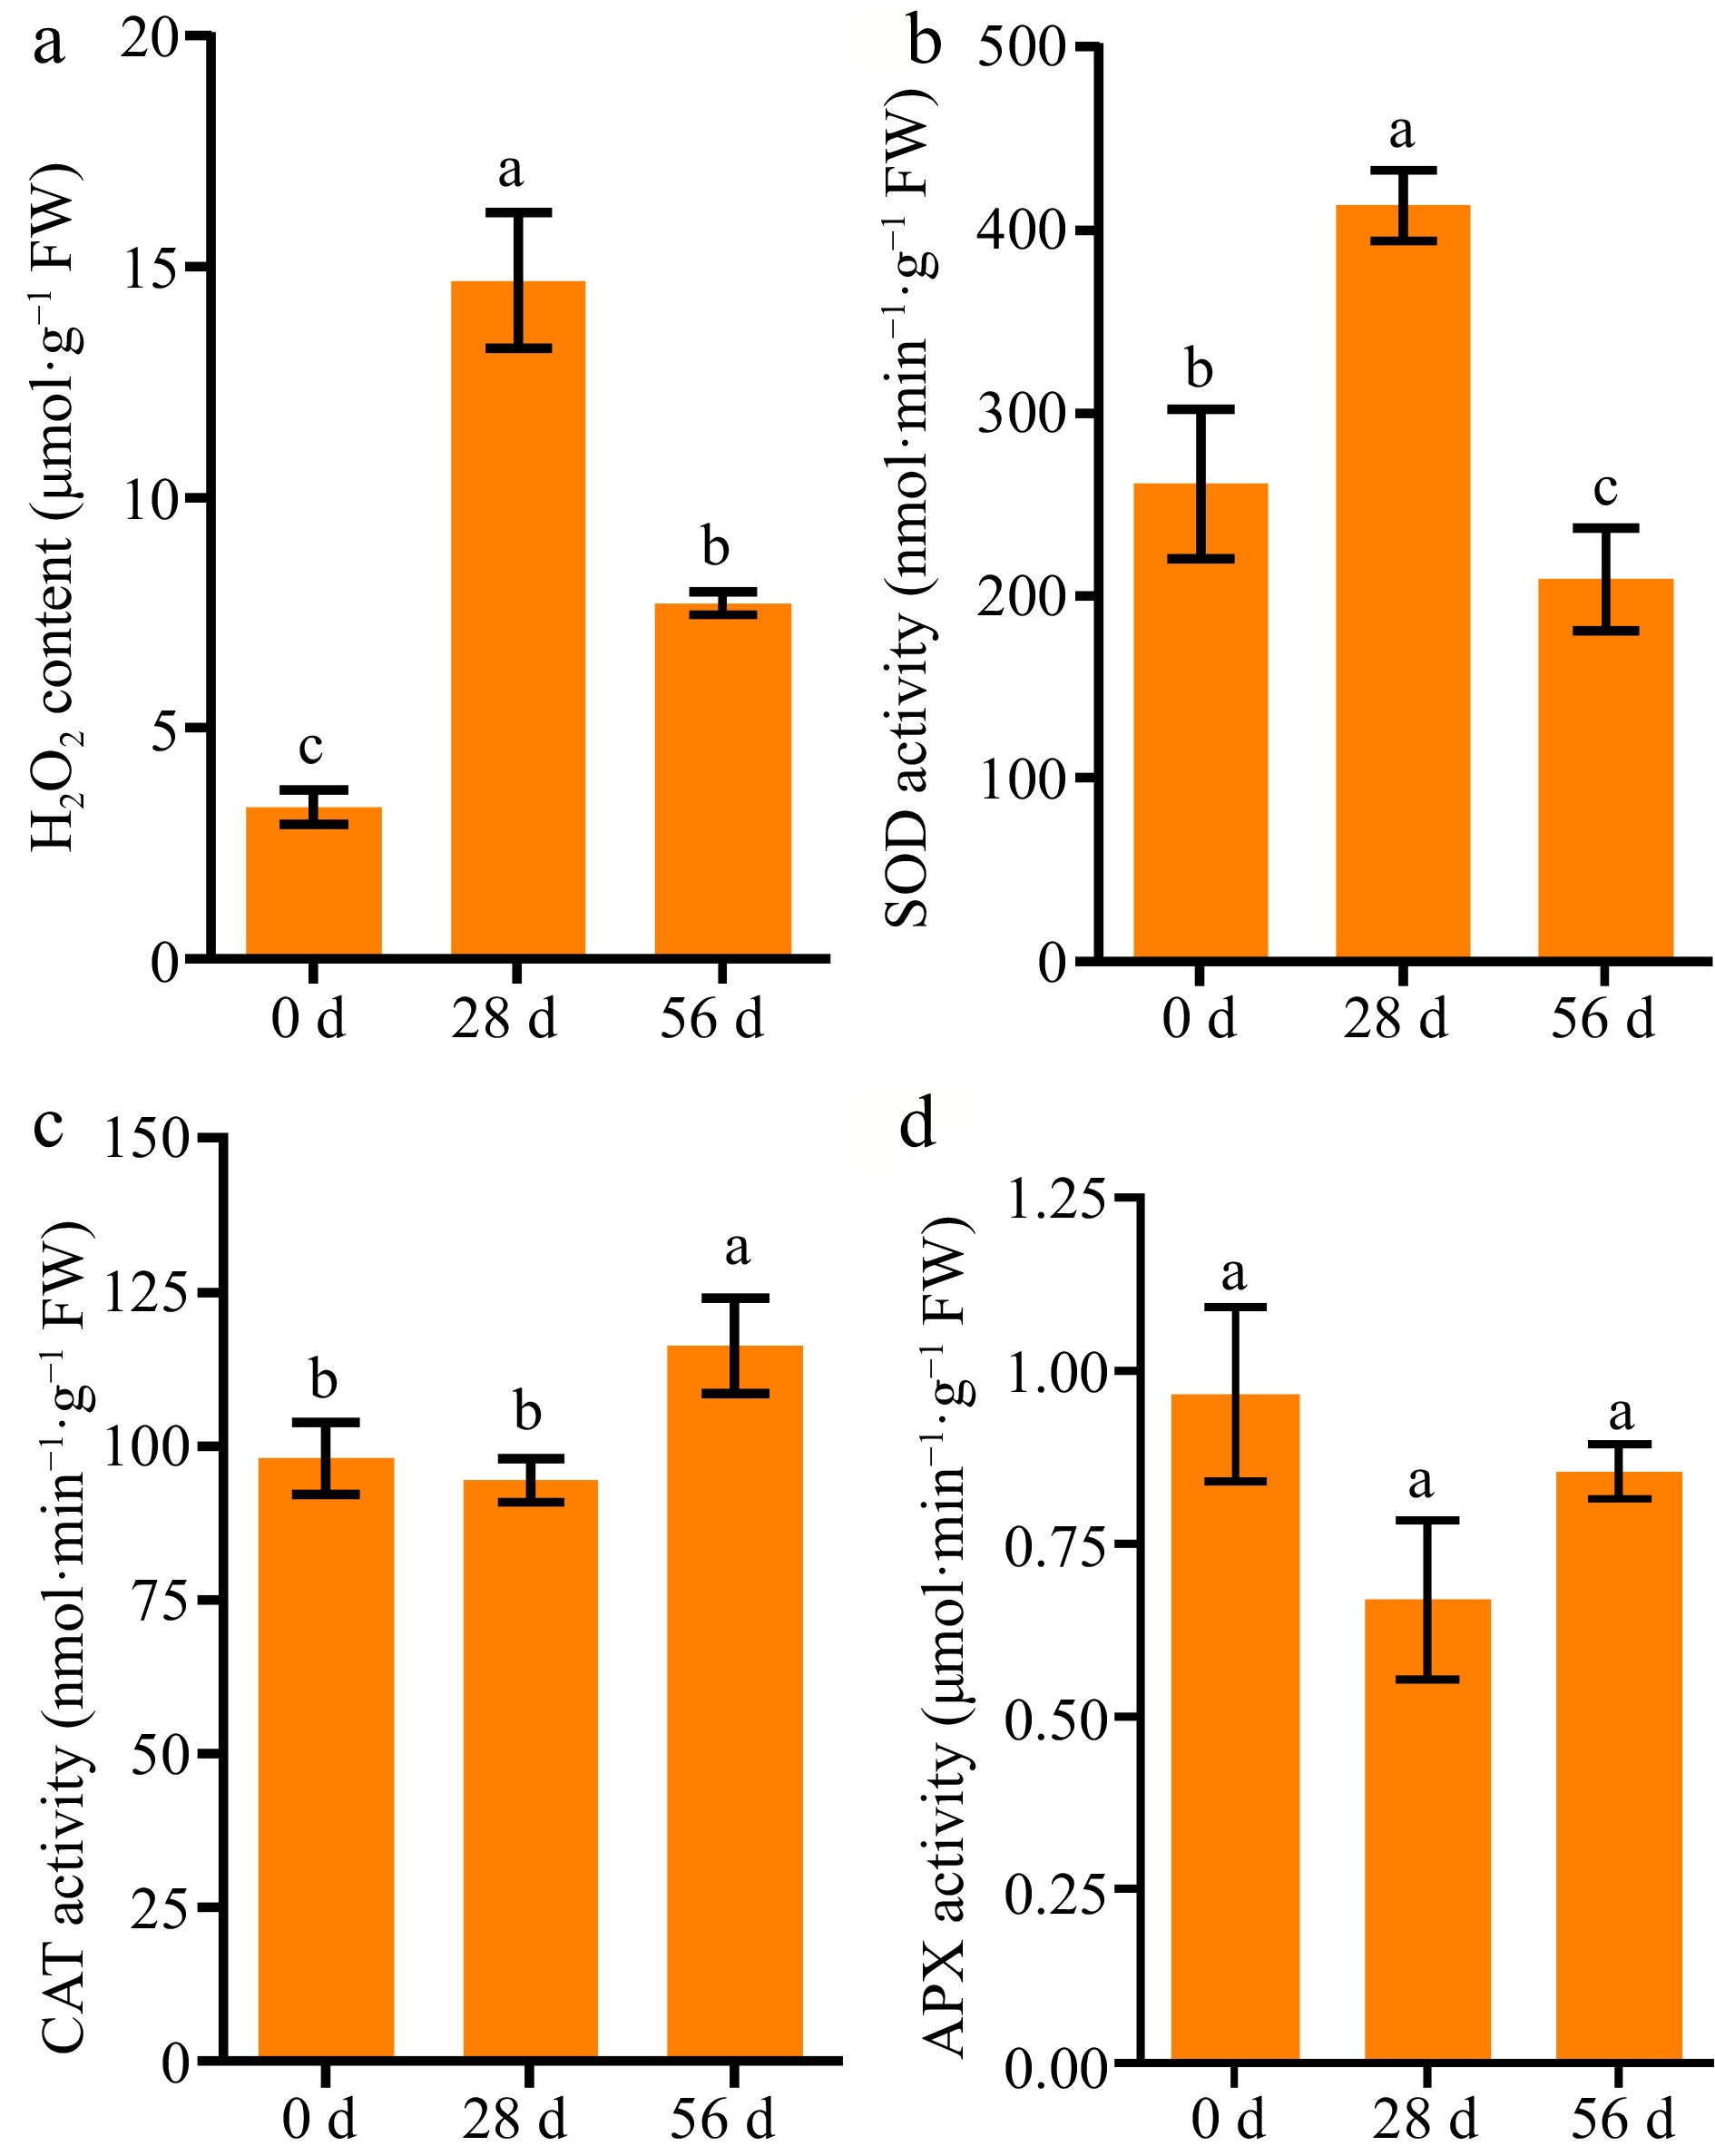
Figure 4.
Comparison of H2O2 level and antioxidant enzyme activities in Nipponbare seeds at 0, 28, and 56 DAR. (a) H2O2 level, (b) SOD, (c) CAT, and (d) APX activities in NPB seeds at 0, 28, and 56 DAR. NPB represents Nipponbare. Each column presents the means ± standard deviations of three biological replicates. Different lower case letters above columns indicate statistical differences at P < 0.05.
-
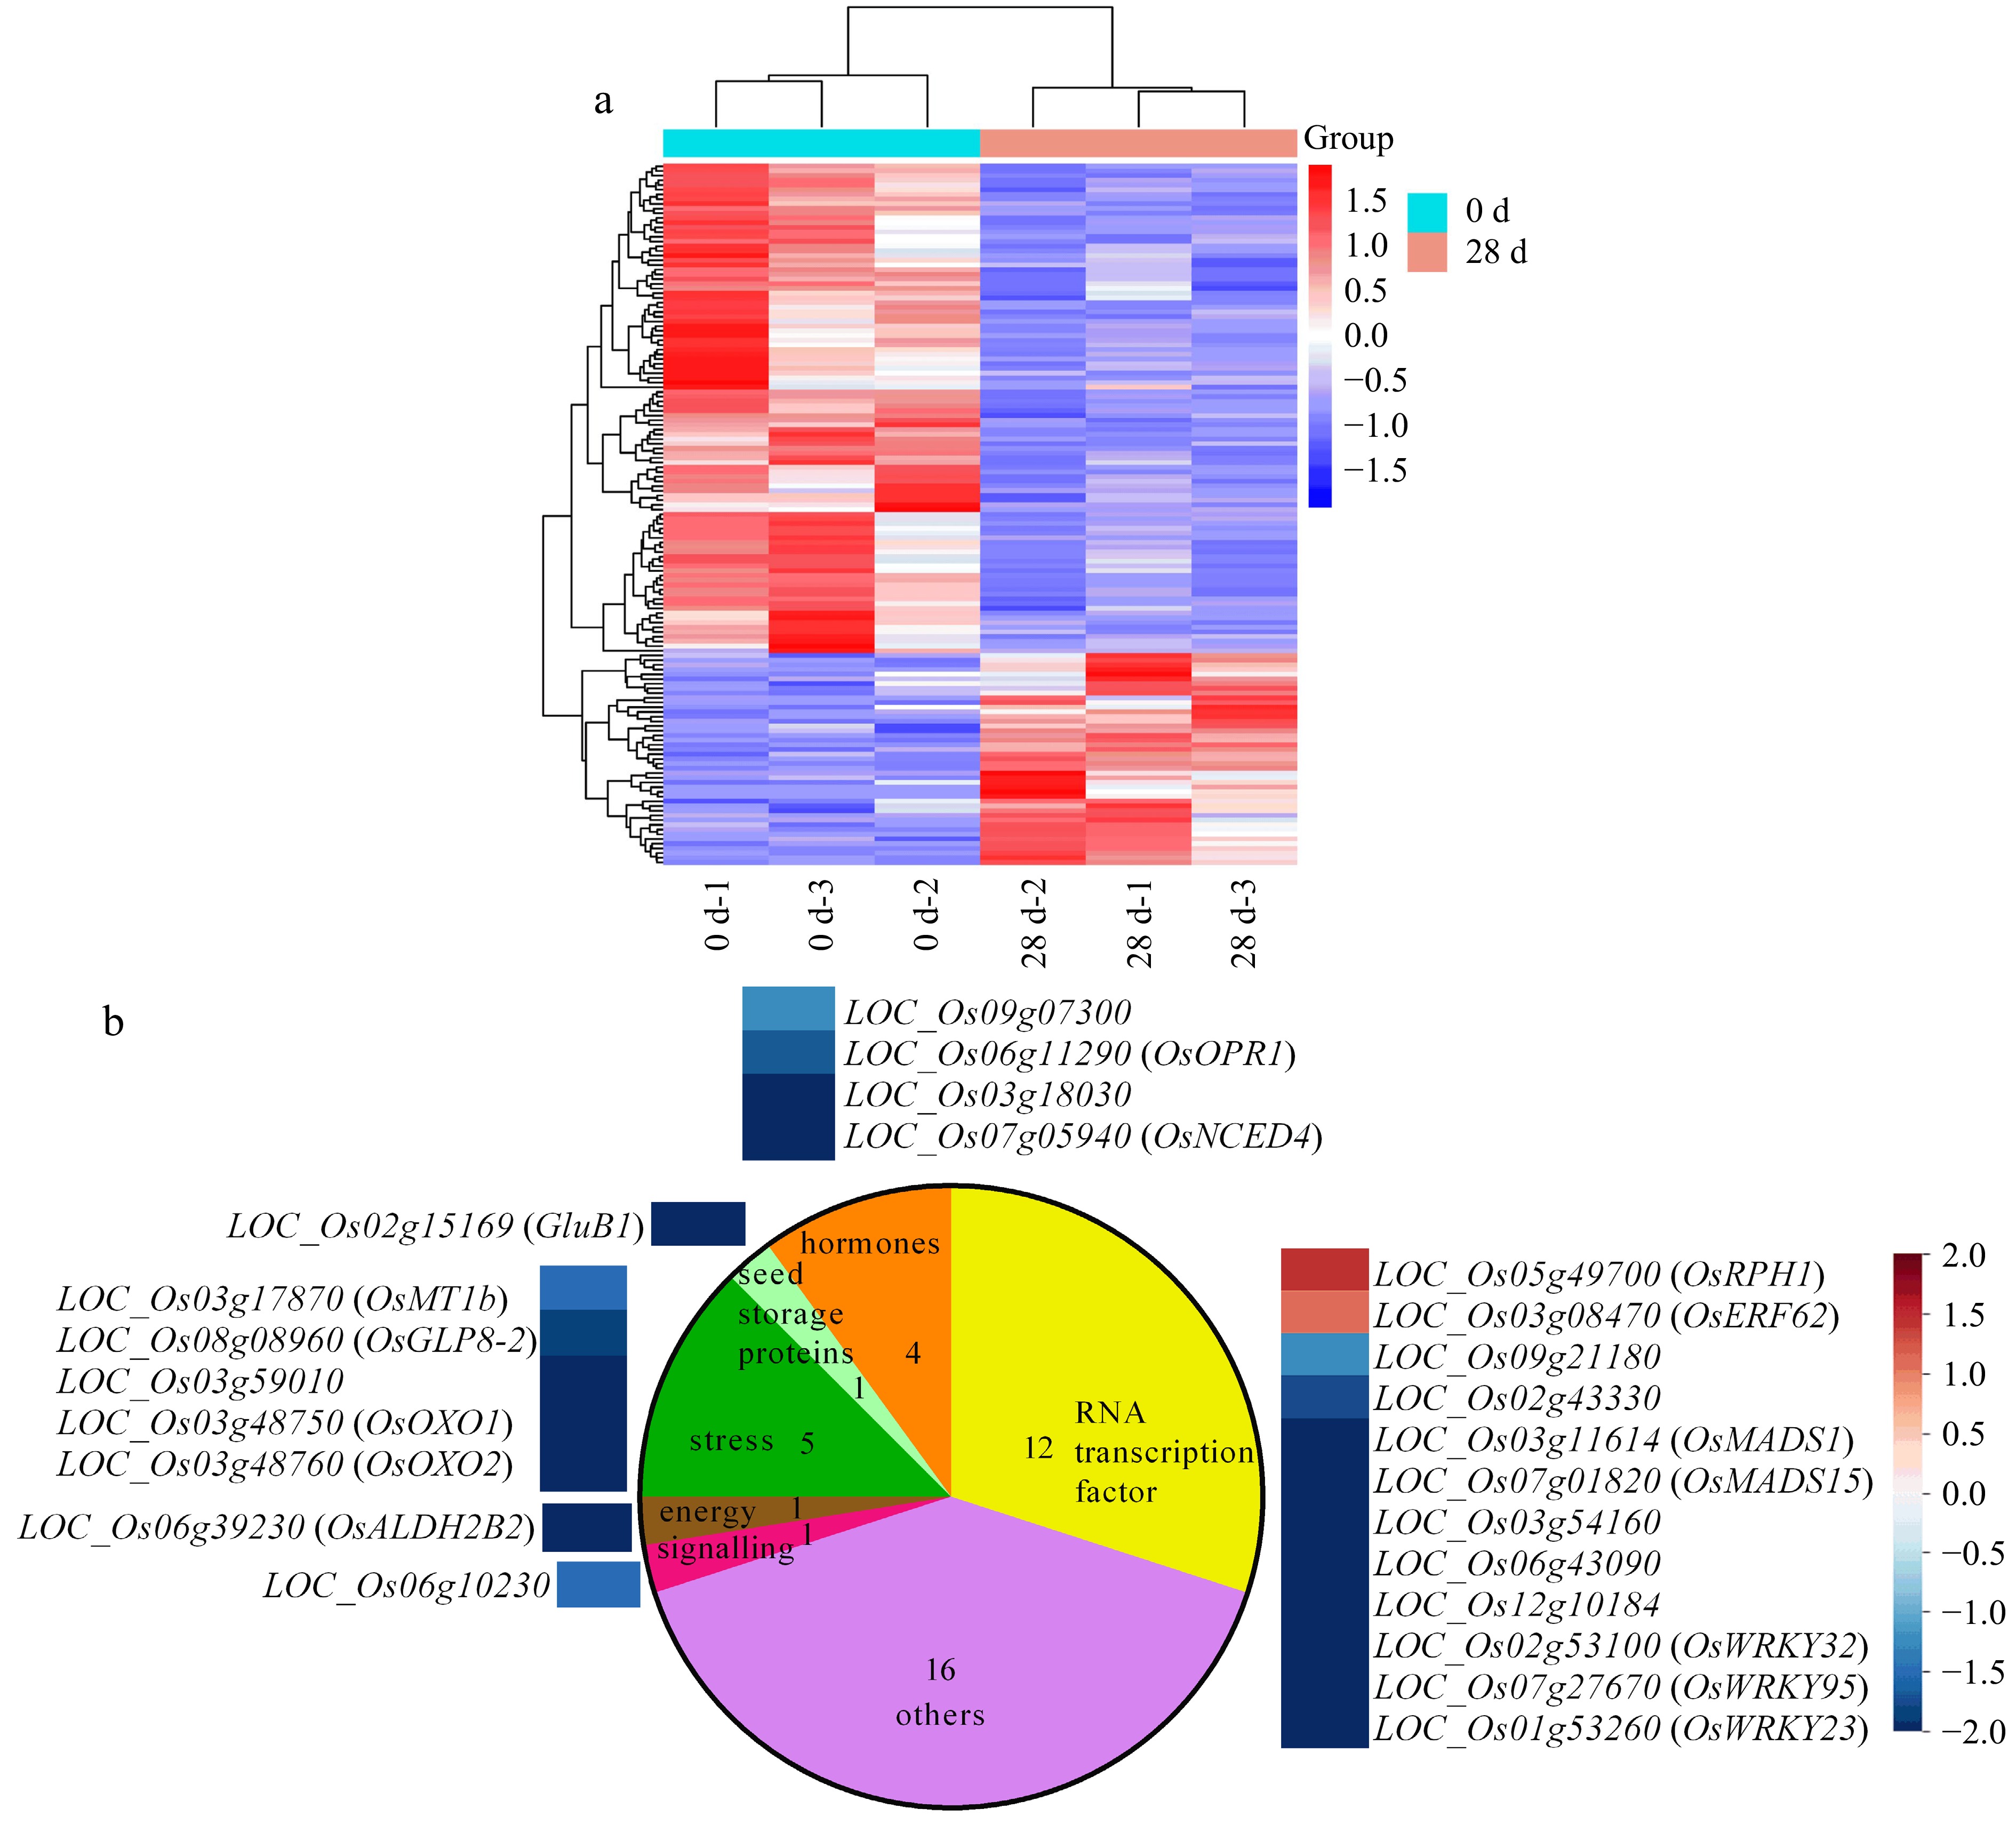
Figure 5.
Identification and analysis of differential transcripts between 0 and 28 DAR Nipponbare dry seeds via RNA-seq. (a) Hierarchical clustering of the DTs between 0 and 28 DAR NPB seeds; scale bar shows fold changes, while the red and the blue colors indicate up-regulation and down-regulation, respectively. (b) Enriched pathways of seed molecular networks, elucidated via Mapman software, including hormones, seed storage proteins, stress, energy, signaling, and RNA transcription factor. Red: up-regulation; blue: down-regulation.
-
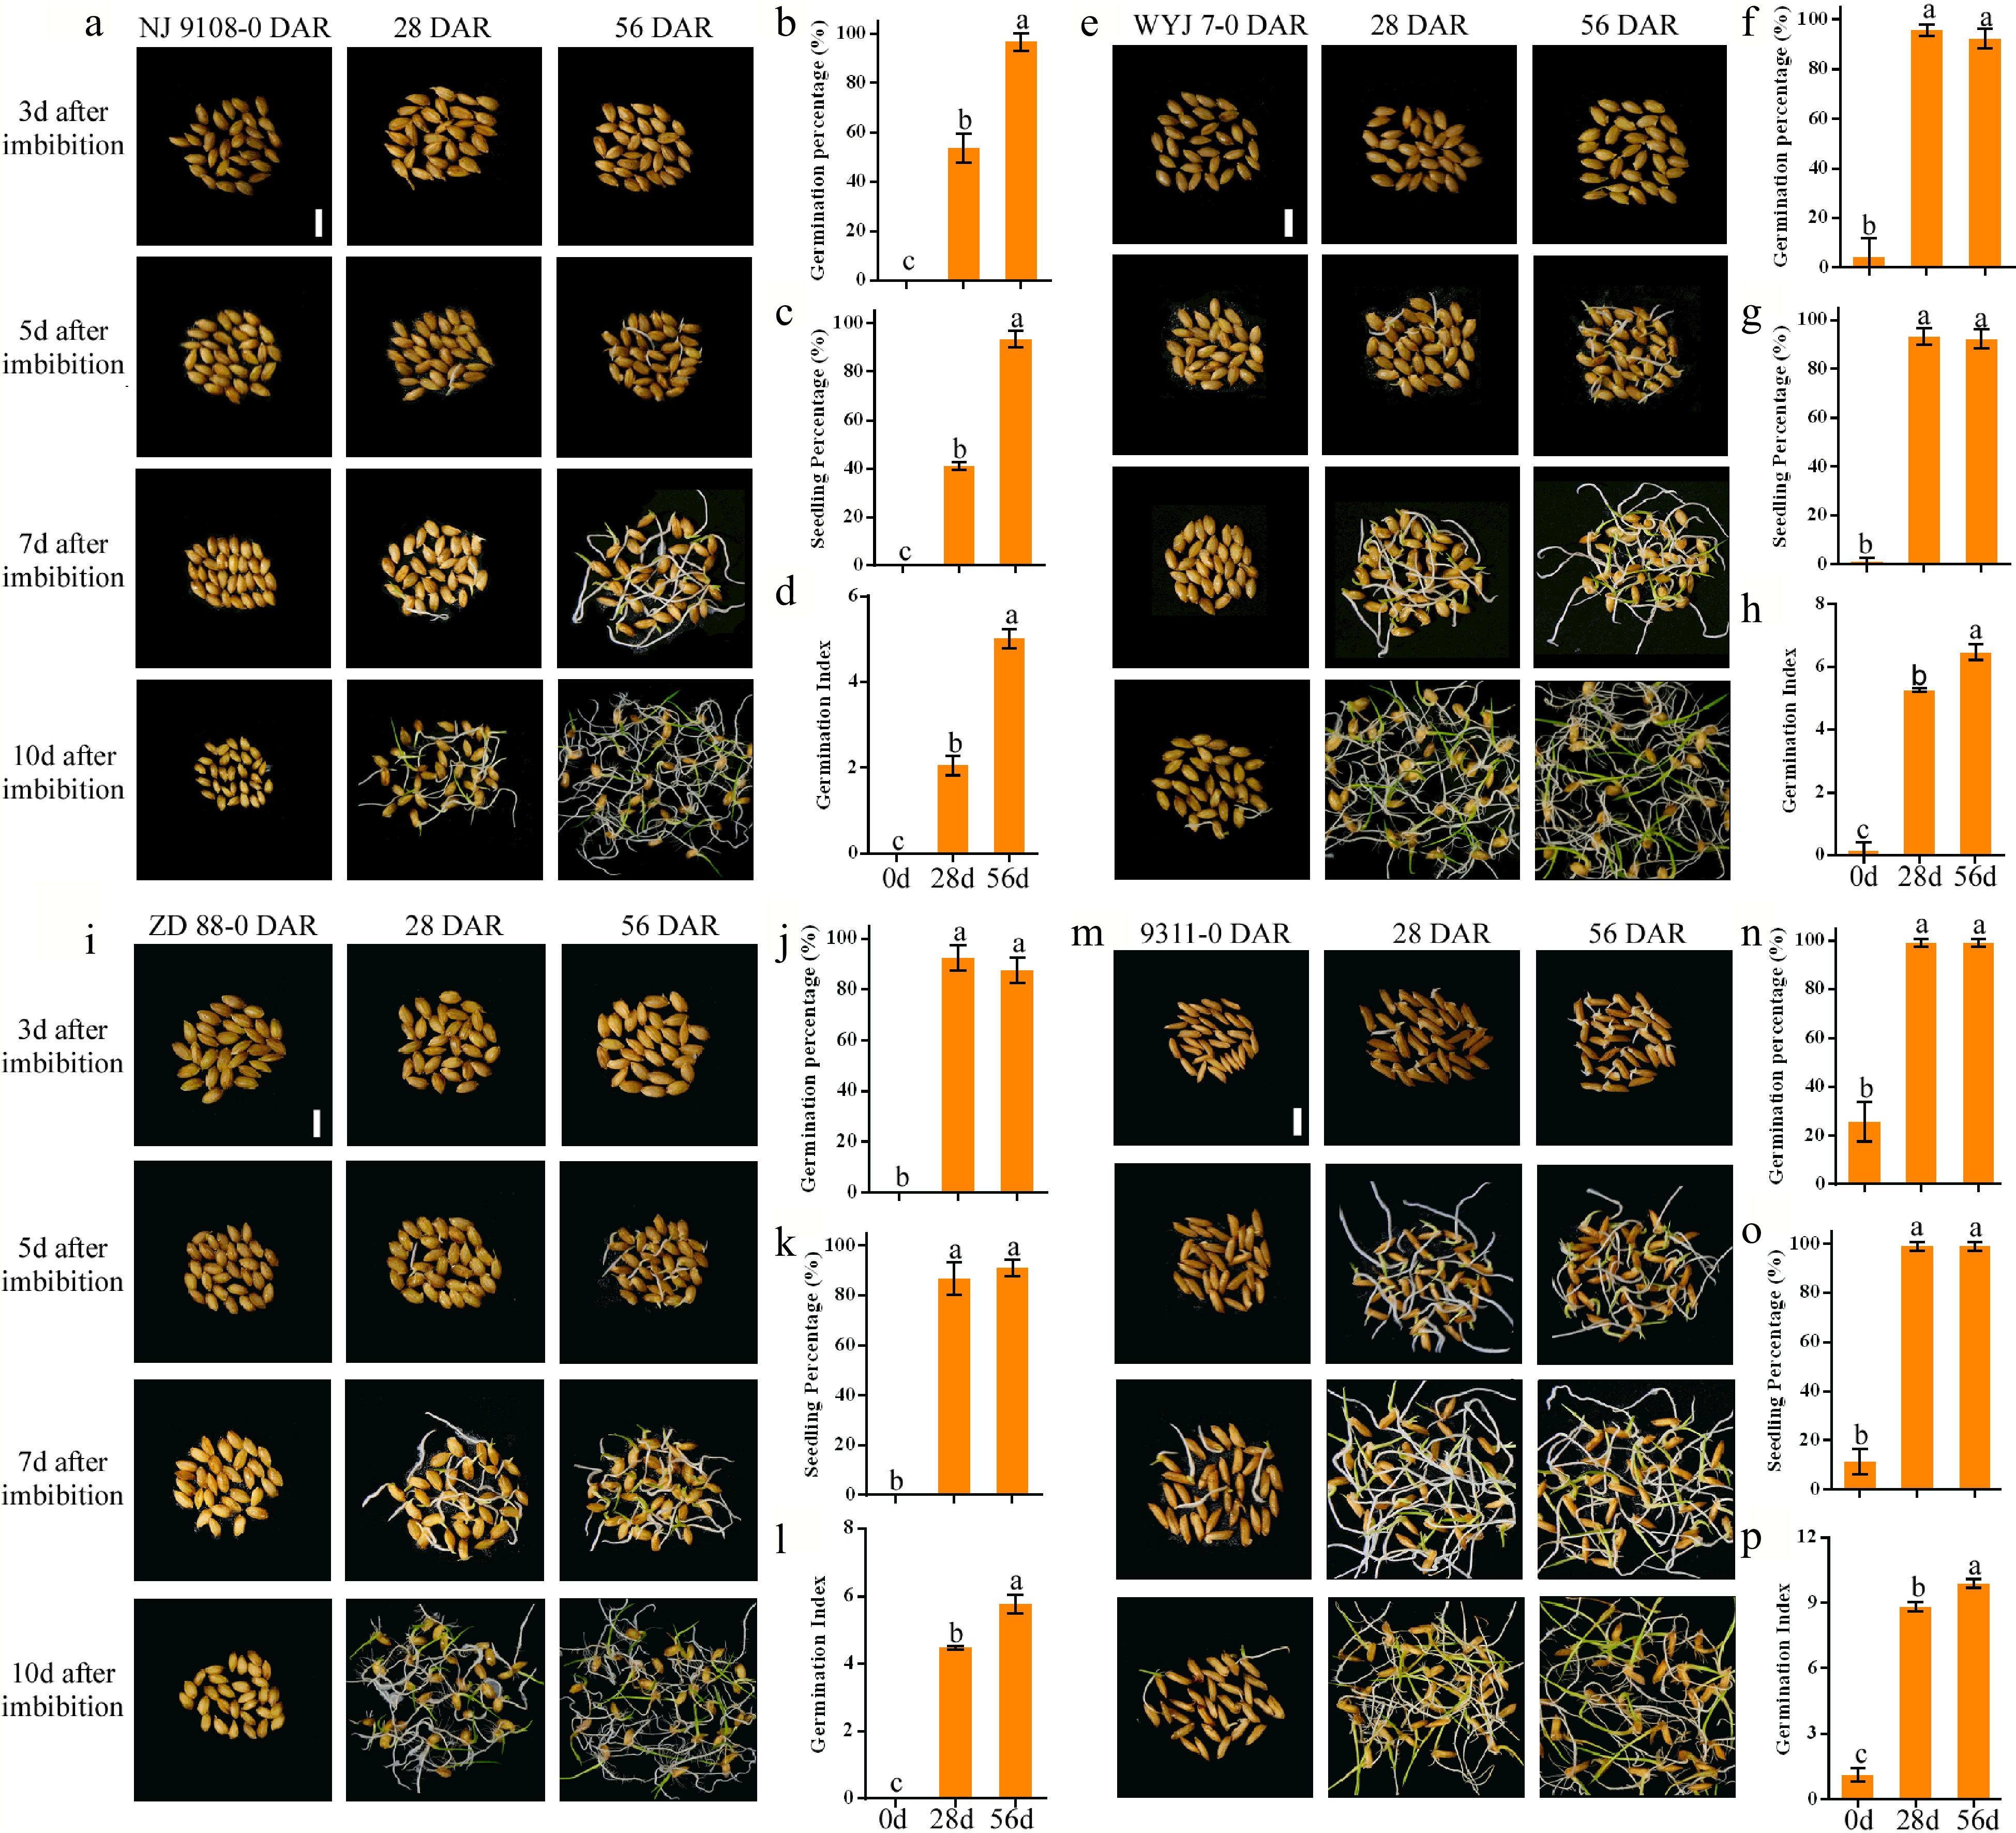
Figure 6.
Changes of seed germination and seedling emergence in NJ 9108, WYJ 7, ZD 88, and 9311 seeds at 0, 28, and 56 DAR. Phenotypic graphics of seed germination at 3, 5, 7, and 10 d of imbibition in (a) NJ 9108, (e) WYJ 7, (i) ZD 88, and (m) 9311 at 0, 28, and 56 DAR. Comparison of germination percentage, seedling percentage, and germination index at 10 d of imbibition in 0, 28, and 56 DAR (b)−(d) NJ 9108, (f)−(h) WYJ 7, (j)−(l) ZD 88, and (n)−(p) 9311 seeds. Bars = 1 cm. Each column presents the means ± standard deviations of three biological replicates. Different lower case letters above columns indicate statistical differences at P < 0.05.
-
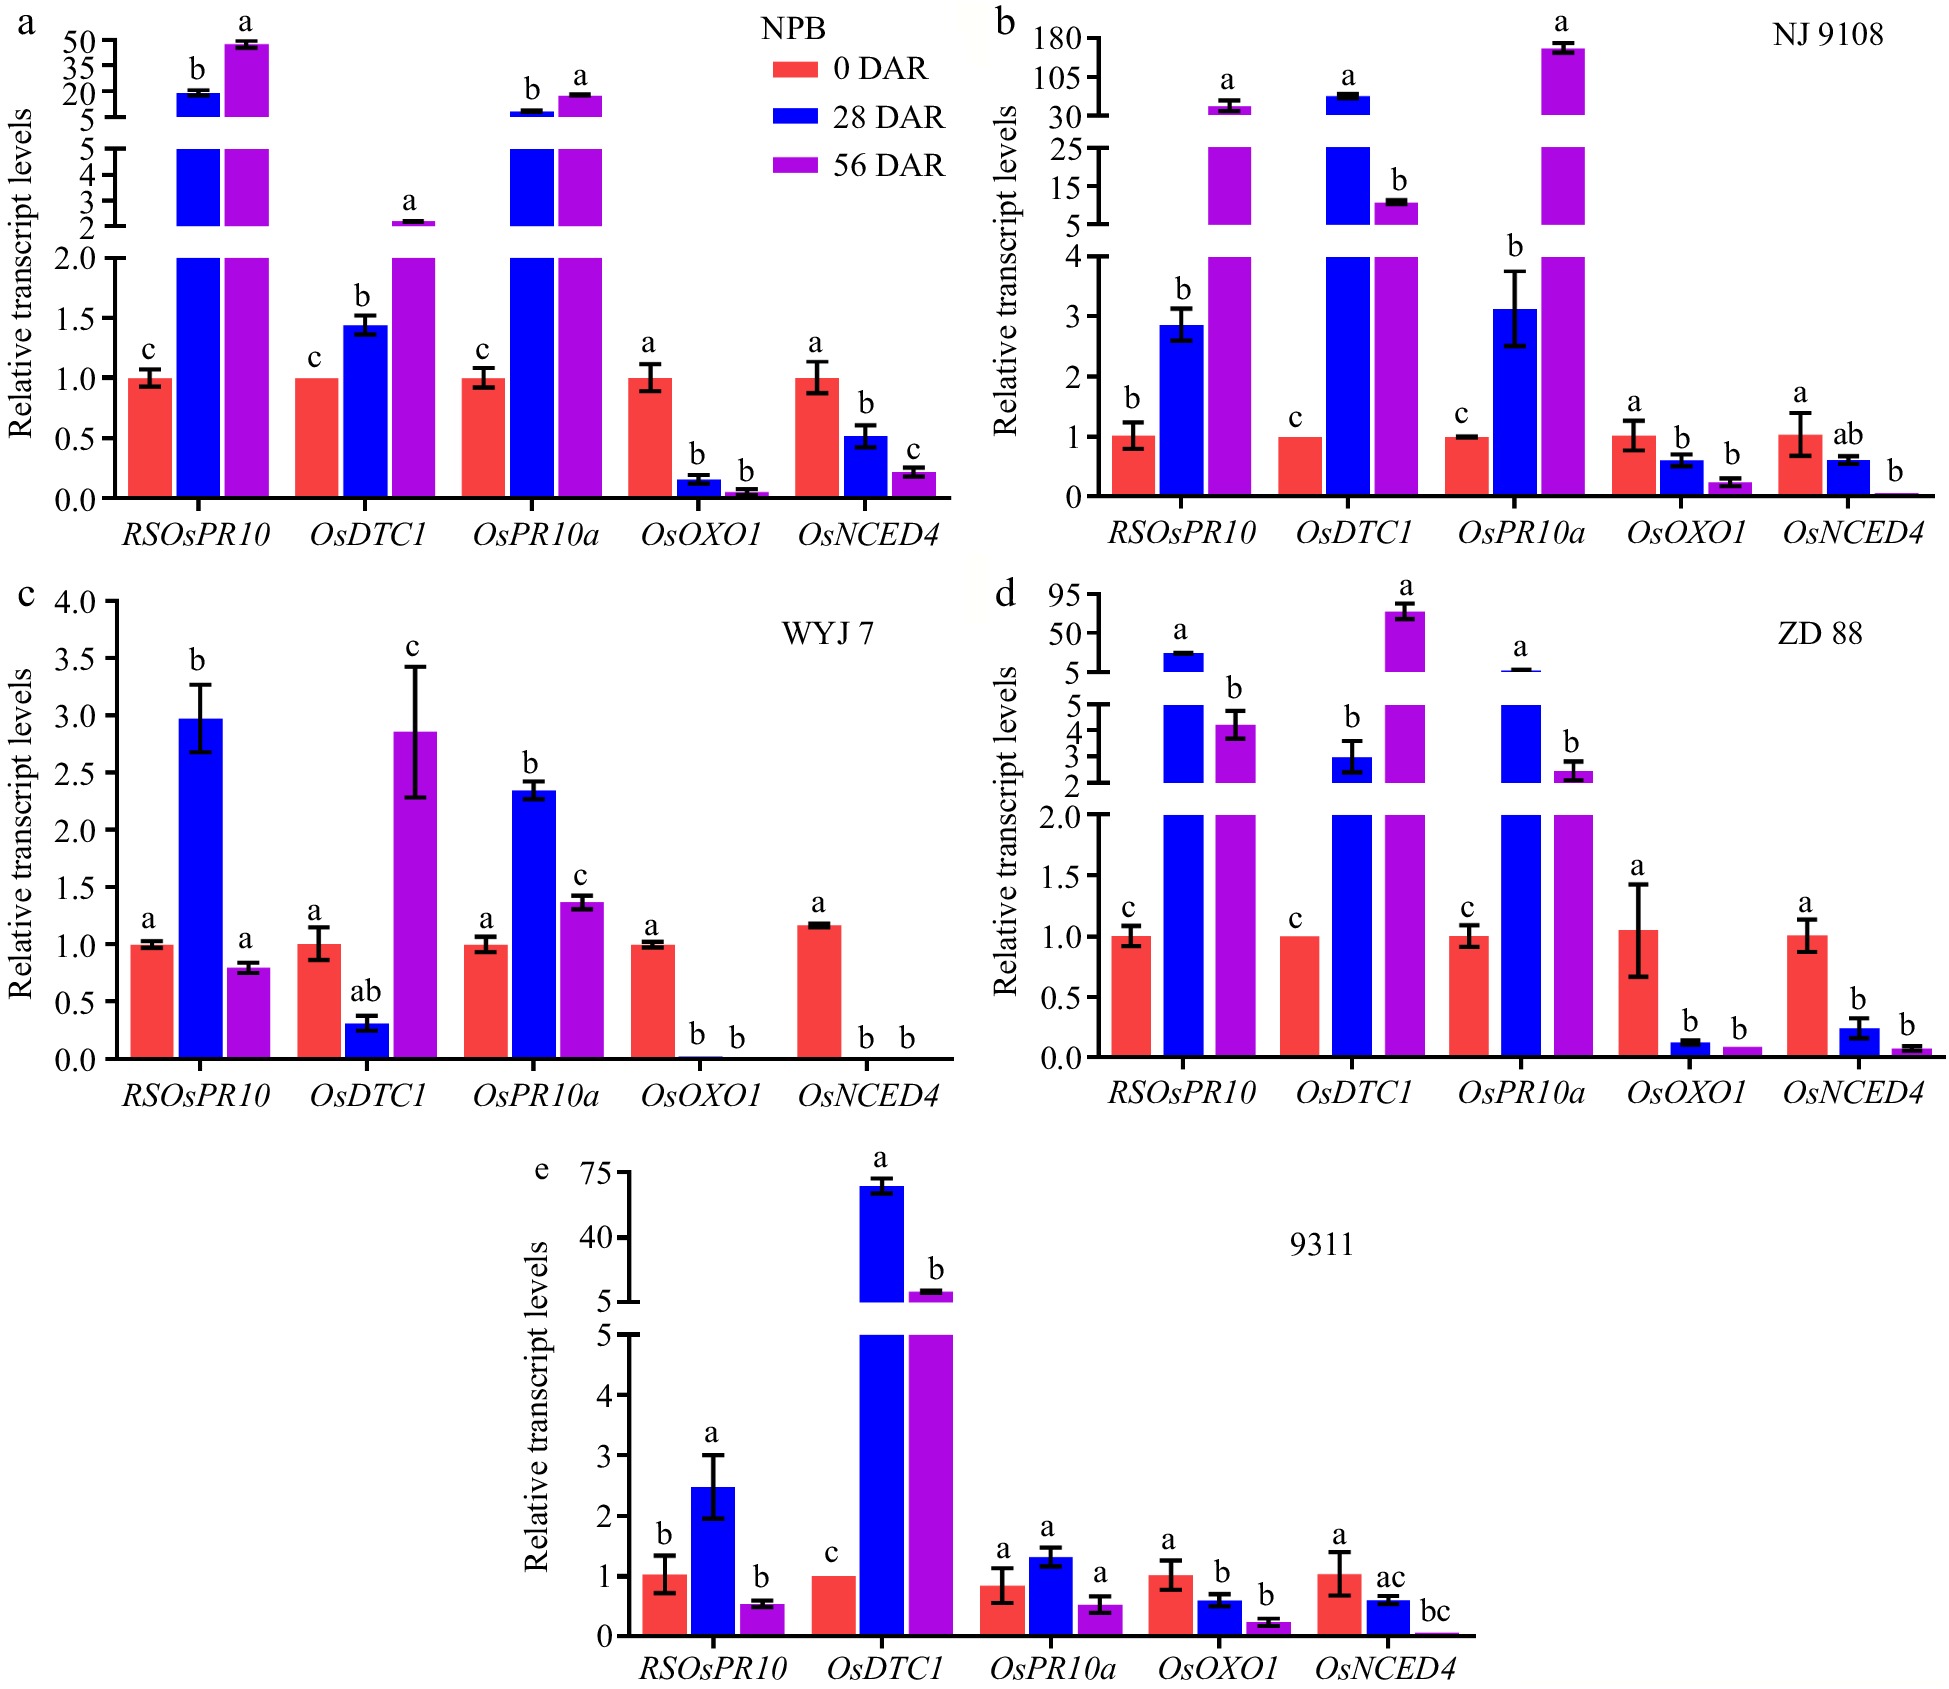
Figure 7.
Transcript levels of key genes related to after-ripening of seeds in five rice cultivars. Changes of transcript levels of RSOsPR10, OsDTC1, OsPR10a, OsOxO1, and OsNCED4 in (a) NPB, (b) NJ 9108, (c) WYJ 7, (d) ZD 88, and (e) 9311 seeds at 0, 28, and 56 DAR. The transcript levels of genes were normalized to that of OsActin. Each column presents the means ± standard deviations of three biological replicates. Different lower case letters above columns indicate statistical differences at P < 0.05.
-
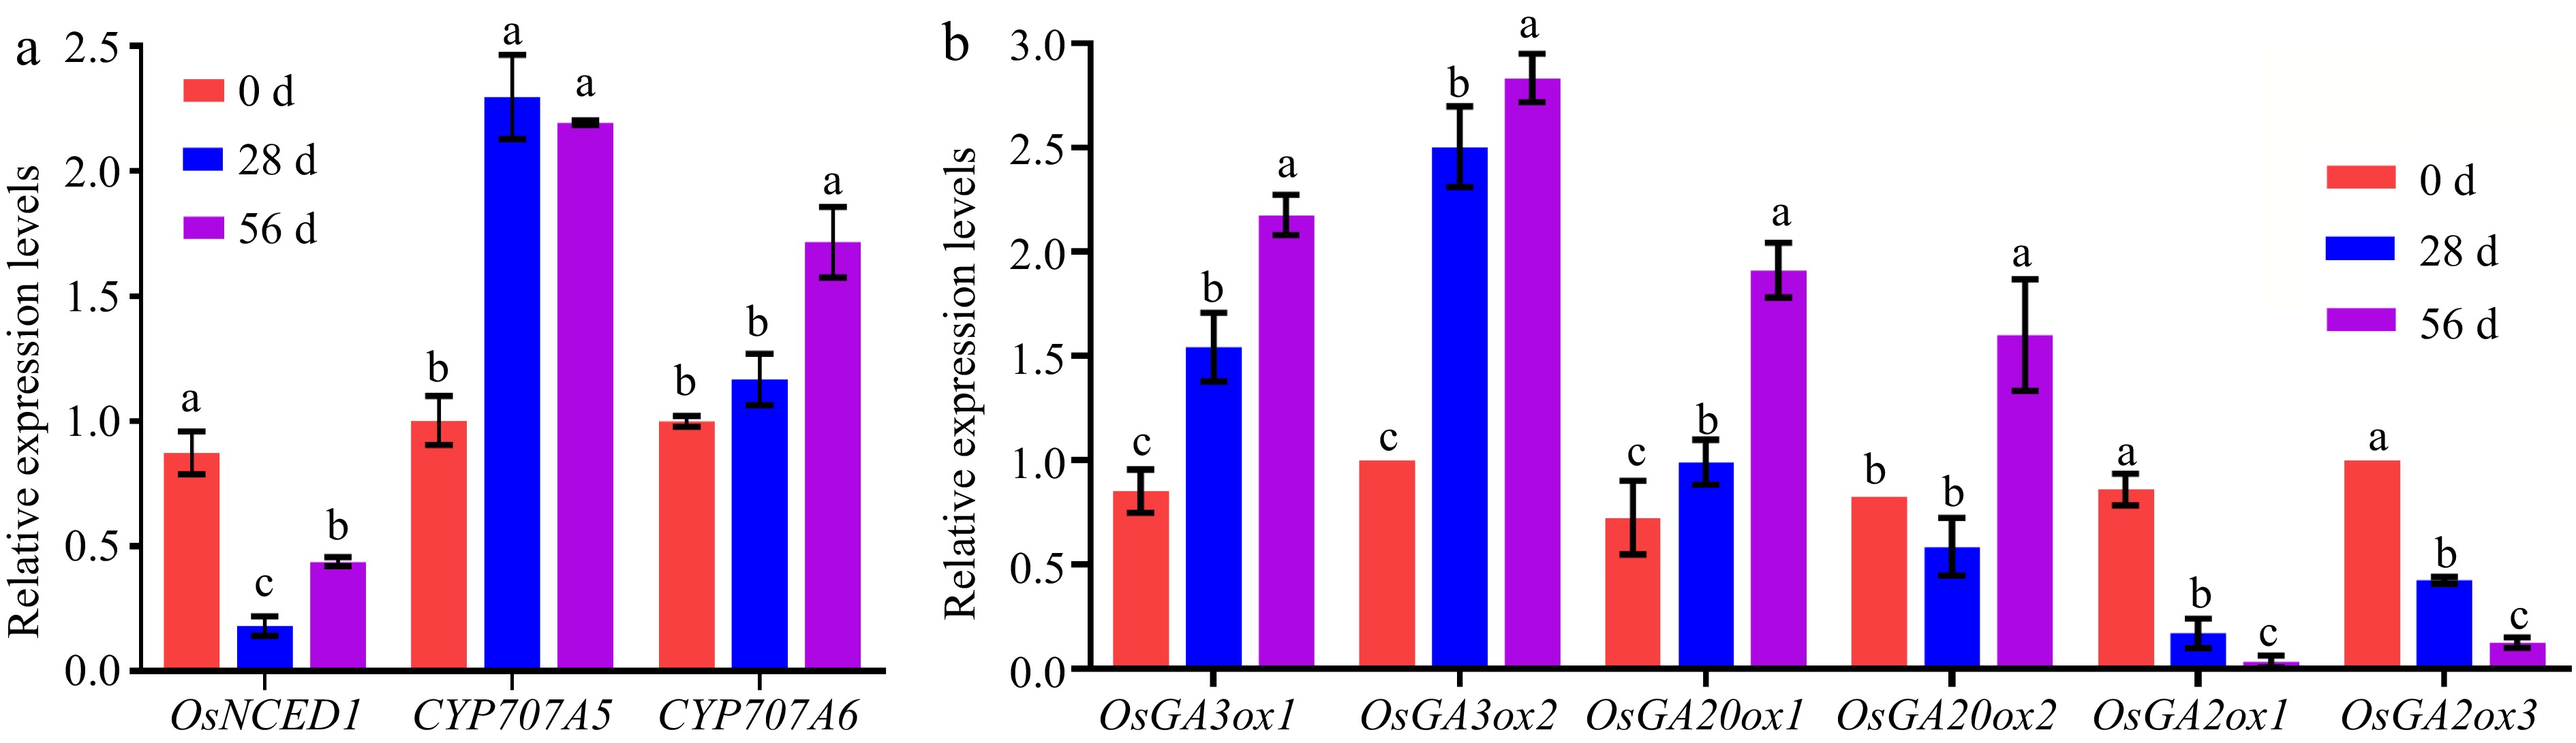
Figure 8.
Transcript levels of of ABA and GAs- related genes in Nipponbare seeds at 0, 28, and 56 DAR. (a) Relative transcript levels of OsNCED1 (ABA biosynthesis) and CYP707A5 and CYP707A6 (ABA catabolism) in NPB seeds at 0, 28, and 56 DAR. (b) Relative transcript levels of OsGA3ox1, OsGA3ox2, OsGA20ox1, and OsGA20ox2 (GA biosynthesis) and OsGA2ox1 and OsGA2ox3 (GA catabolism) in NPB seeds at 0, 28, and 56 DAR. NPB represents Nipponbare. The expression of genes is normalized to that of OsActin. Each column presents the means ± standard deviations of three biological replicates. Different lower case letters above columns indicate statistical differences at P < 0.05.
-
After-ripening (d) GA1/ABA GA9/ABA GA24/ABA GA53/ABA 0 1.9085c 0.0584c 0.1166c 0.2603c 28 3.2926b 0.1353b 0.3206b 0.4531b 56 3.4208a 0.1430a 0.4191a 0.4966a Different lower case letters above columns indicate statistical differences at P < 0.05. Table 1.
GA/ABA ratios in 0, 28, and 56 DAR NPB seeds.
Figures
(8)
Tables
(1)