-

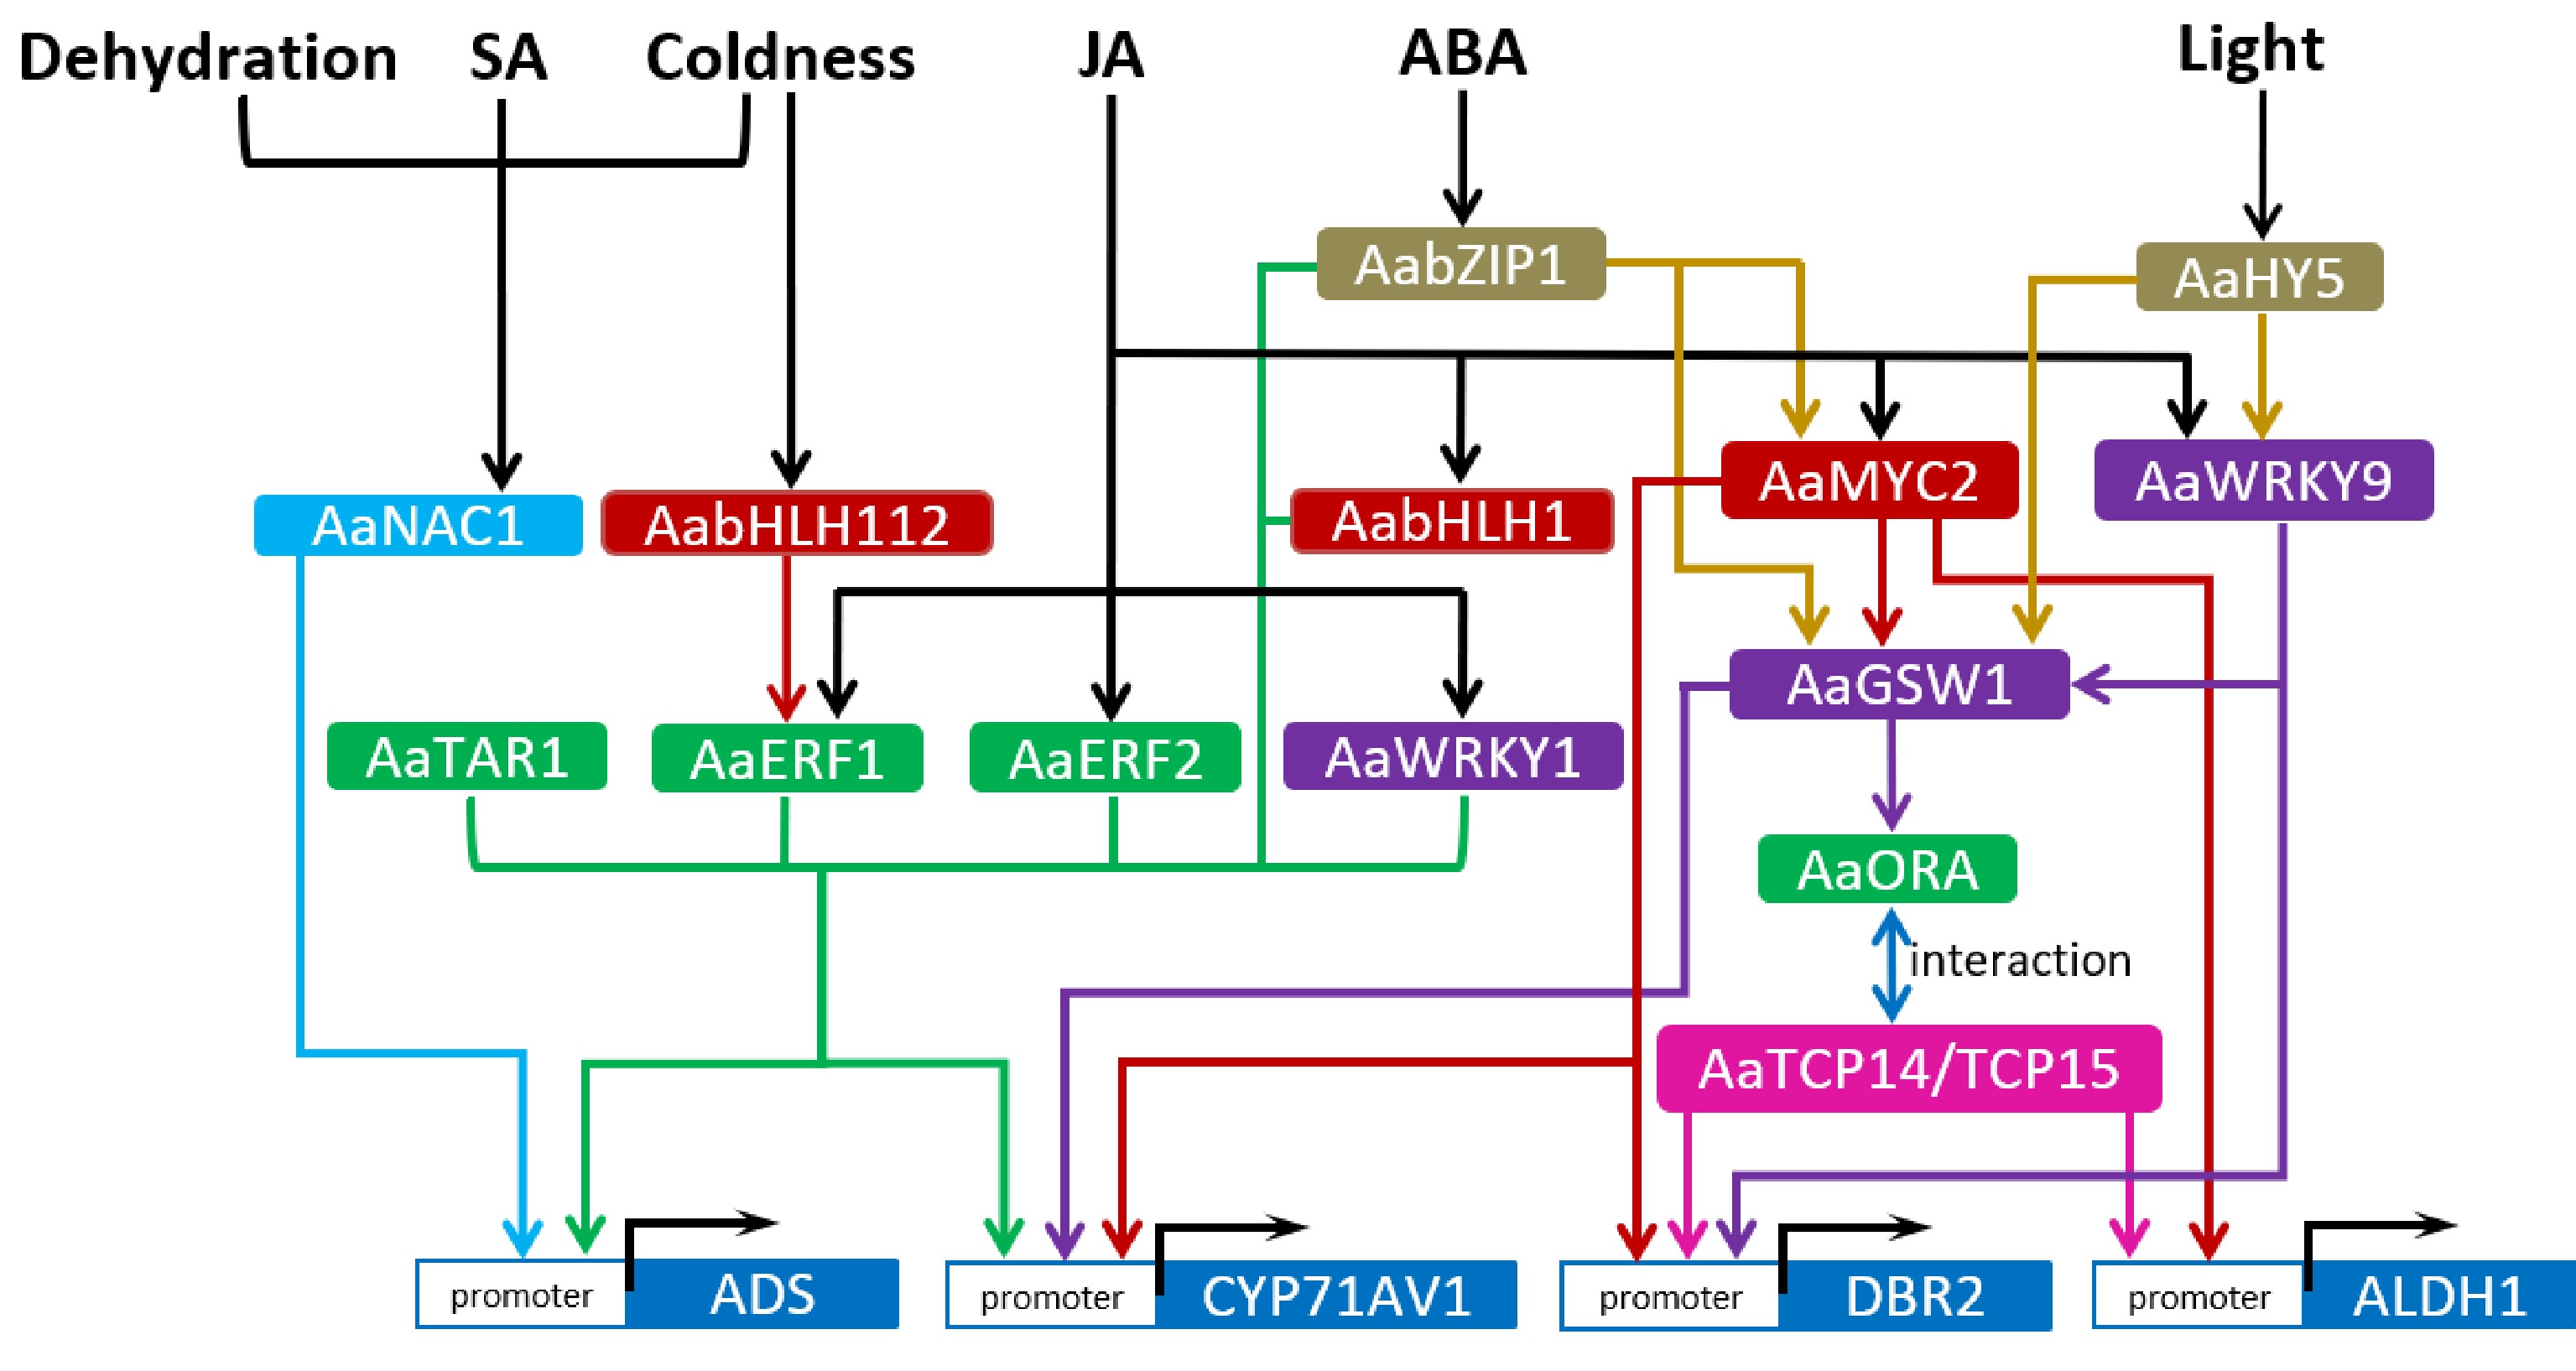
Figure 1.
Regulatory network of artemisinin biosynthetic pathway. The arrows represent direct upregulation of downstream targets. Arrows started from the common upstream regulators or directed toward the common downstream targets are in one colour. Transcription factors of the same family are marked with the same colour.
-

Figure 2.
Identified regulation of glandular trichome (GT) formation in A. annua. The arrows represent upregulation of downstream targets, while short lines represent inhibition or downregulation of downstream targets. Transcription factors of the same family are marked with the same colour.
-
Strategies for metabolic engineering of artemisinin Target genes used Artemisinin increment relative to control References Overexpressing key enzymes in artemisinin biosynthesis HMGR 22.5%−38.9% [69, 70] DXR 1.3 fold [71] FPS 1.5 fold [72, 73] ADS 82% [74] CYP71AV1/CPR 38% [71, 75] HMGR + FPS 80% [80] HMGR + ADS 7.65 fold [76] ADS + CYP71AV1/CPR 2.4 fold [78] FPS + CYP71AV1/CPR 2.6 fold [77] ADS + CYP71AV1/CPR+ ALDH1 2.4 fold [79] Repressing competitive pathways SQS 71% [82] CPS 77% [82] BFS 77% [82] GAS 1.03 fold [82] Overexpressing transcription factors AaERF1 68% [29] AaERF2 50% [29] AaORA 53% [30] AaTAR1 38% [31] AaTCP14 Nearly 1 fold [32] AaTCP15 Nearly 1 fold [33] AaTCP14+AaORA 1.8 fold [32] AaWRKY1 1.3-2 fold [36] AaGSW1 0.5-1 fold [37] AaWRKY9 0.6-1.2 fold [38] AaMYC2 23%−55% [44] AabHLH112 48%−70% [46] AaNAC1 46%−79% [50] AaEIN3(repression) About 35% [52] AabZIP1 0.7-1.5 fold [51] AaHY5 Nearly 1 fold [53] Increasing glandular trichome density AaHD1 50% [56] AaHD8 35% [58] AaMIXTA1 1 fold [59] AaMYB1 1 fold [63] AaTAR2 50% [66] AaMYB17 87% [67] AaMYB5(knockdown) 45%−84% [68] AaMYB16 43%−56% [68] AaGSW2 1 fold [57] Table 1.
Summary of genes used for metabolic engineering of artemisinin in A. annua.
Figures
(2)
Tables
(1)