-
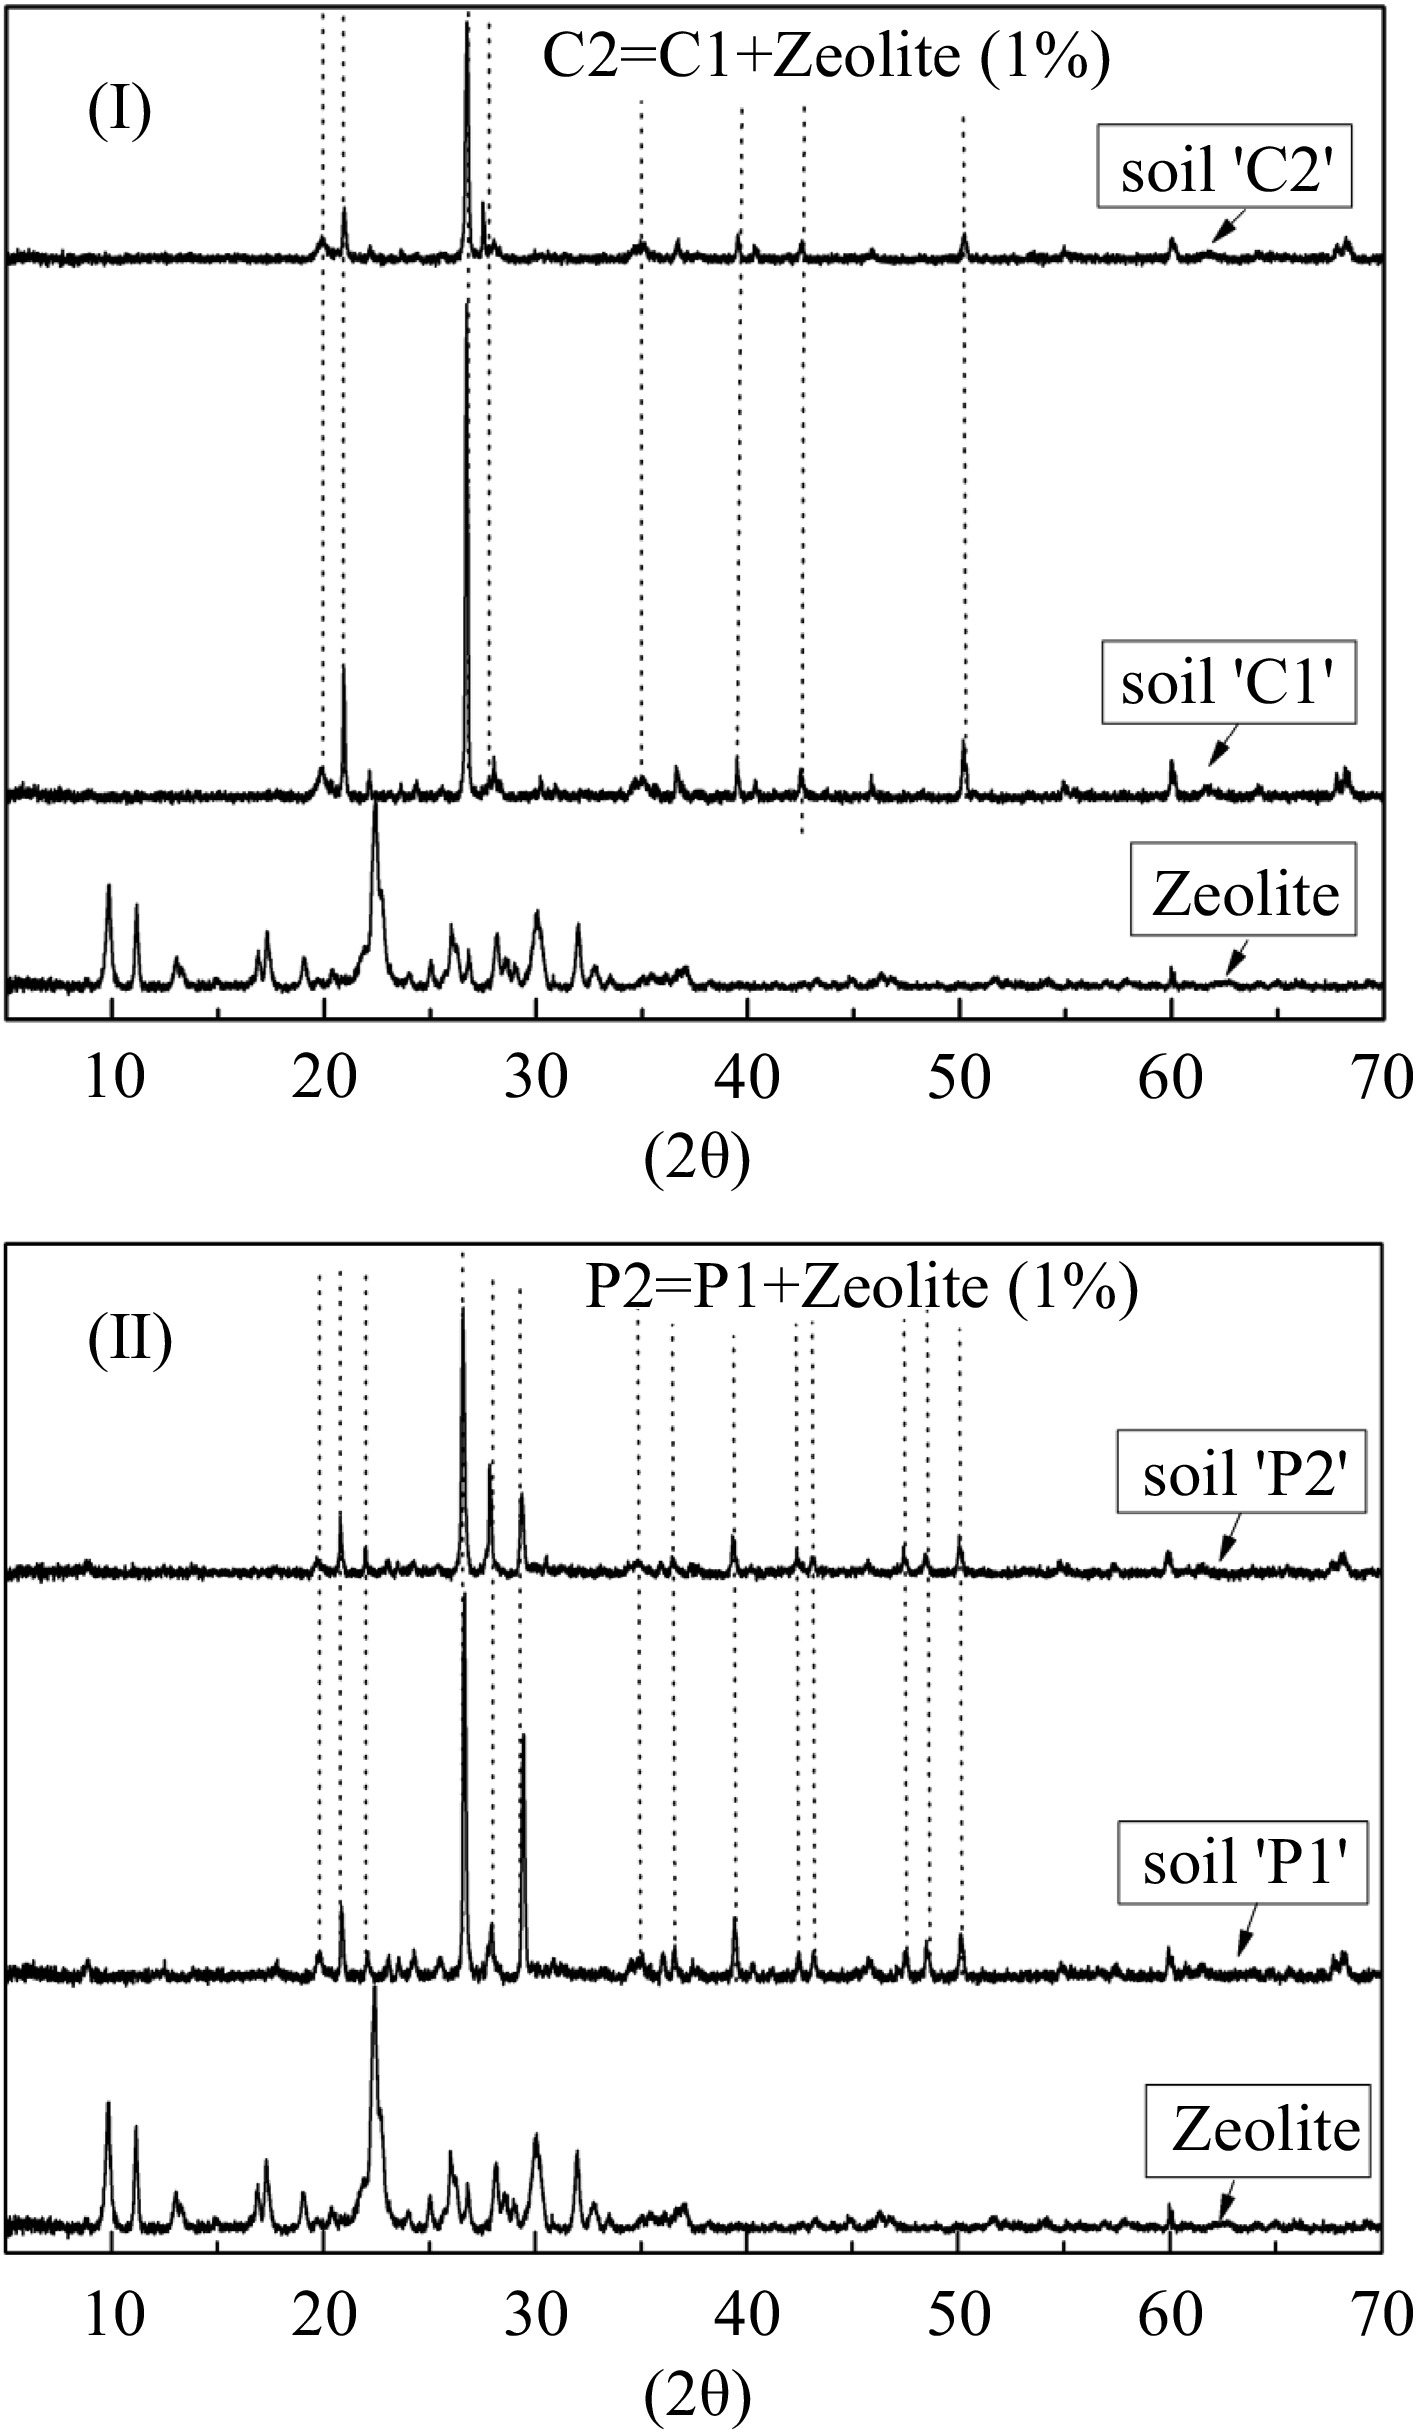
Figure 1.
X-ray powder diffraction pattern of the (I) soil-'C' and (II) soil-'P'. The dotted lines show similar peaks. (C1: unpolluted soil, C2: unpolluted soil with the addition of 1% zeolite, P1: polluted soil and P2: polluted soil with the addition of 1% zeolite).
-
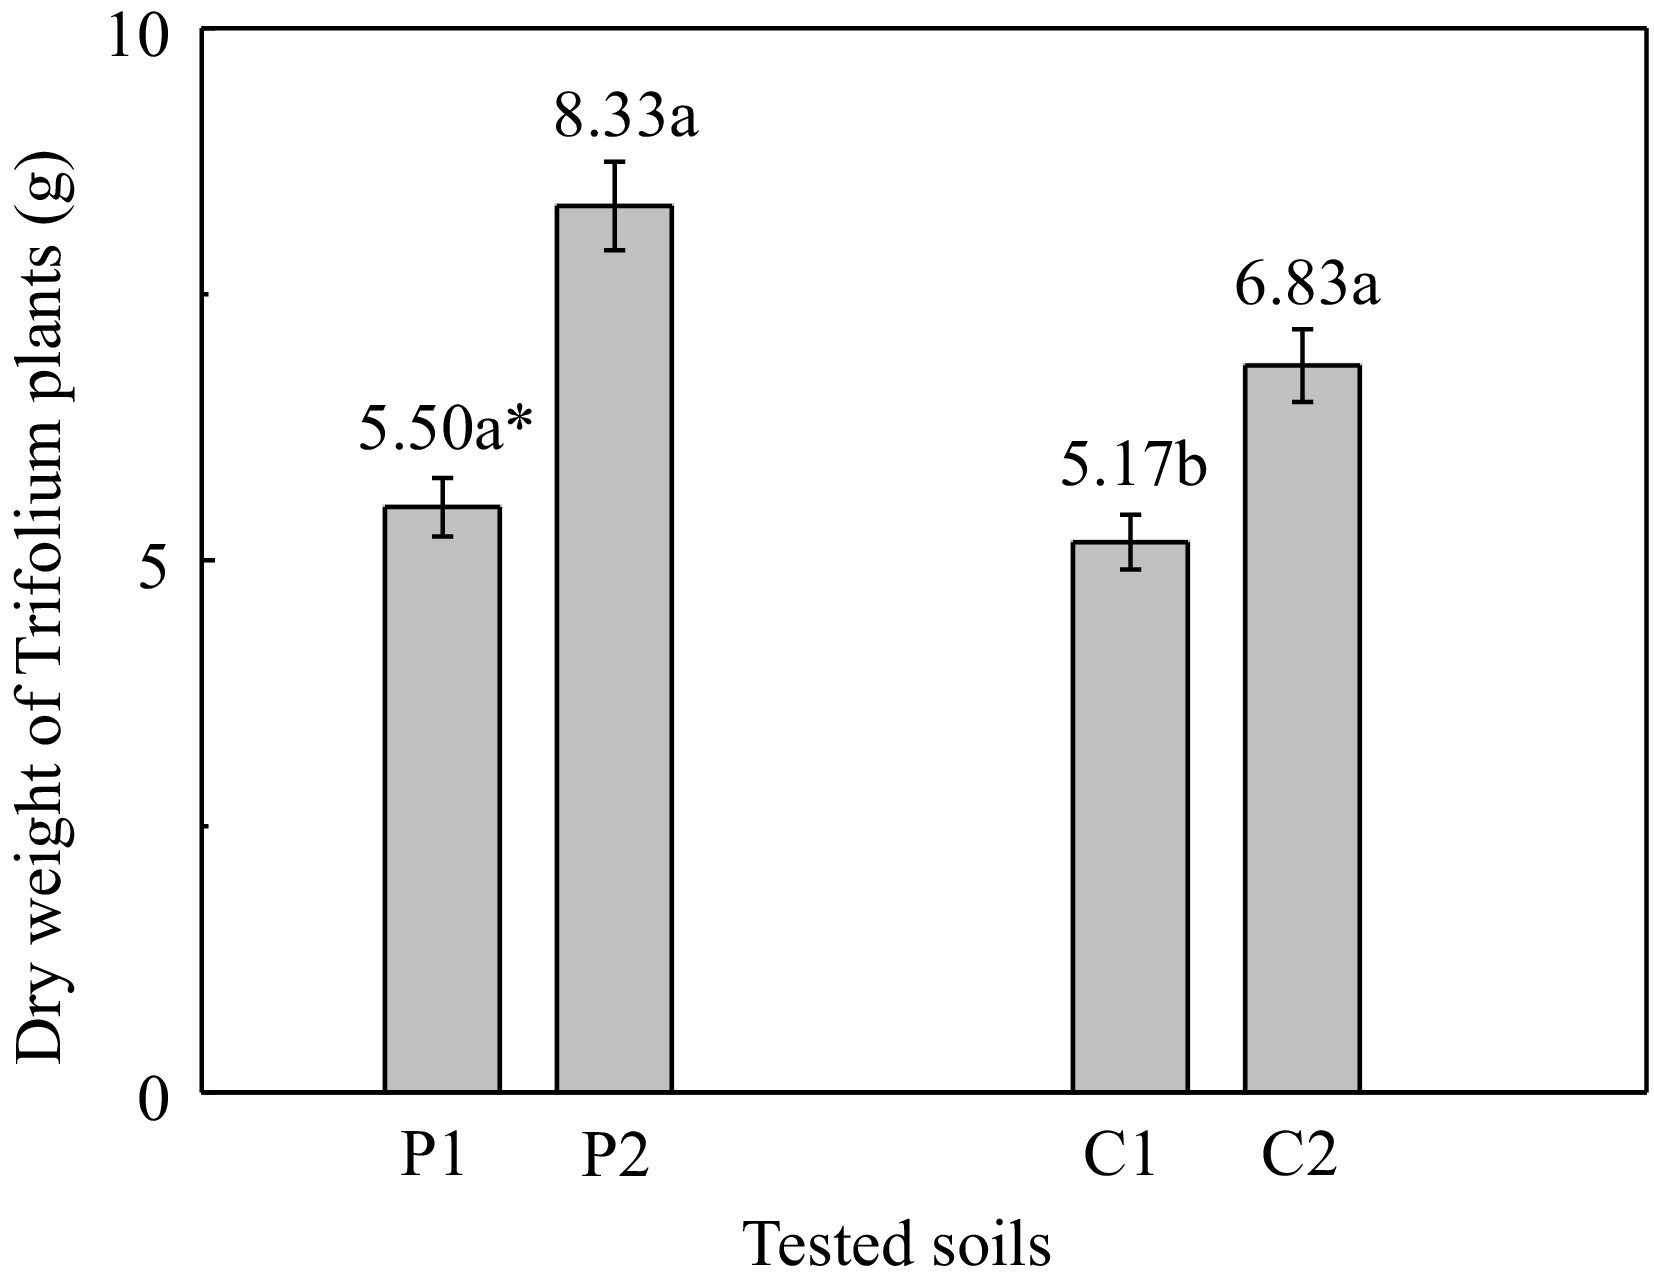
Figure 2.
Dry weight of white clover plants grown on the different tested soils. (P1: polluted soil without the addition of 1% zeolite, P2: polluted soil with the addition of 1% zeolite, C1: unpolluted soil without the addition of 1% zeolite, C2: unpolluted soil with the addition of 1% zeolite). * Different letters in each column indicate statistically significant differences (F-test, p < 0.05). Values ± SD.
-
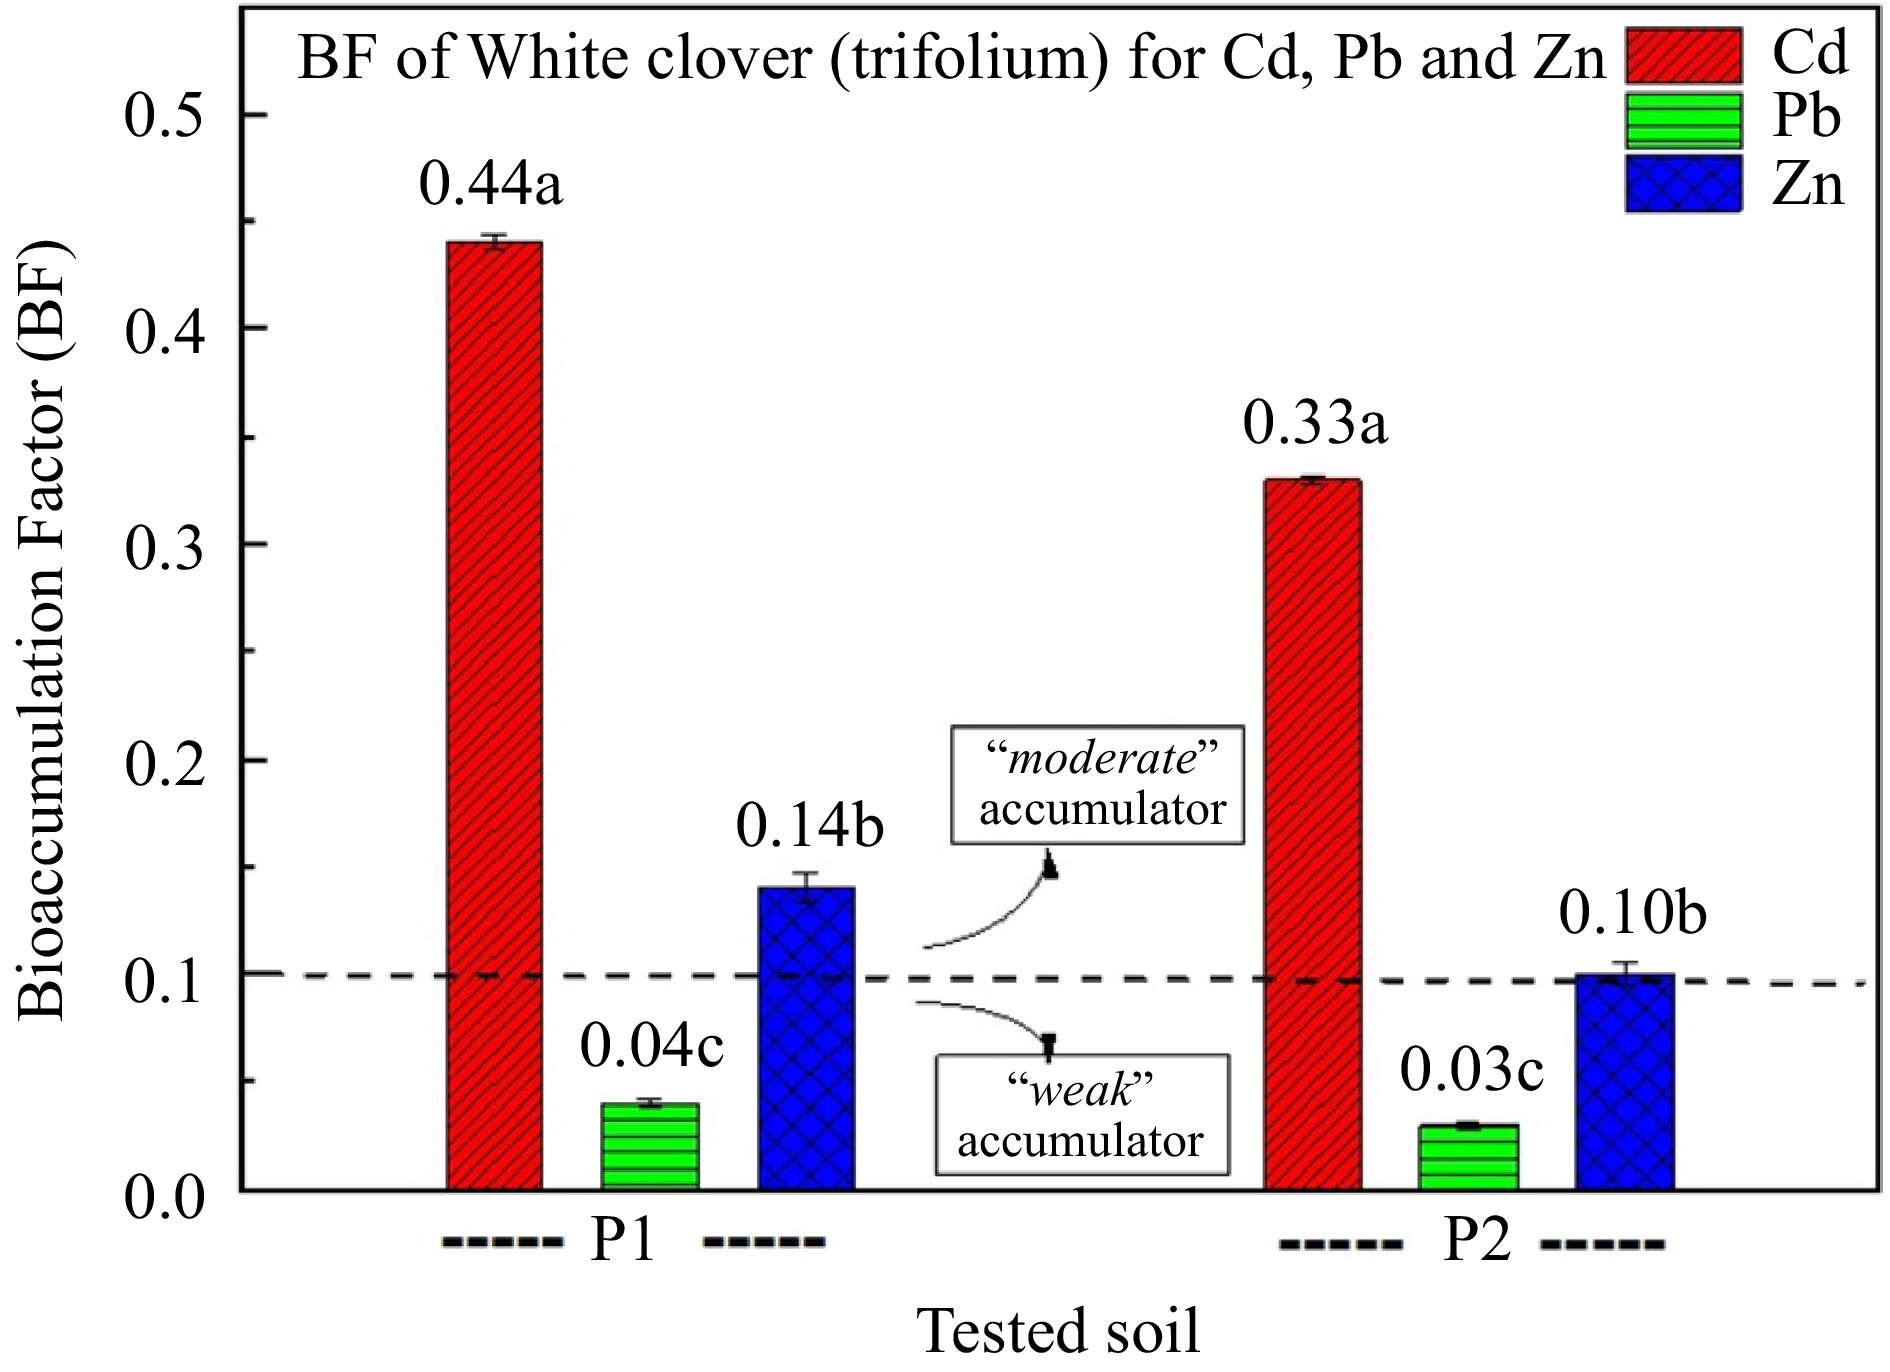
Figure 3.
Bioaccumulation factor (BF) of white clover for Cd, Pb, and Zn. (P1: polluted soil without the addition of 1% zeolite, and P2: polluted soil with the addition of 1% zeolite,). Different letters in each column indicate statistically significant differences (F-test, p < 0.05). Values ± SD.
-
Soil Nutrients and physicochemical properties Metal concentration (mg/kg dry soil) N
(g/100g)P
(mg/kg)K
(cmol+/kg)pH
(+0.01)Organic
matter
%CaCO3 % CEC
(meq/100 g
dry soil)Sand
%Clay
%Silt
%Soil
typeCd Pb Zn 'P' 0.10 11 0.74 8.24 3.21 1.10 34.92 64.0 12.1 24.2 Sandy loam 4.30a 291.10a 1,458.12a 'C' 0.11 10 1.51 7.32 0.67 2.21 36.31 31.0 44.2 25.0 Clay nd** 17.32c 76.21c Maximum allowable values* 1.00 60.0 200.0 * Ministry of the Environment–Finland (MEF, 2007). nd**: Not Detectable. P: polluted soil, C: unpolluted soil (control). Different letters in each column indicate statistically significant differences (F-test, p < 0.05). Table 1.
Nutrients, physical and chemical characteristics of the tested soils.
-
Soil White clover (mg/kg dry weight of plant) Cd Pb Zn P1 1.93a* 11.74a 199.31a P2 1.43b 7.98b 141.95b C1 nd** 5.58c 60.92c C2 nd** 3.66d 54.16c Normal consumption
limits as dry biomass:0.50 30.00 300.00 P1: polluted soil without the addition of 1% zeolite, P2: polluted soil with the addition of 1% zeolite, C1: unpolluted soil without the addition of 1% zeolite, C2: unpolluted soil with the addition of 1% zeolite. *Different letters in each column indicate statistically significant differences (F-test, p < 0.05) nd**: not detectable. Table 2.
Concentration of Cd, Pb and Zn in the total plant tissue of white clover plants.
-
Soil Metal concentration (mg/kg dry soil) Total Available Cd Pb Zn Cd Pb Zn P1 2.33a 215.67a* 996.67a 0.39a 31.00a 84.67a P2 2.74b 220.33b 1043.33b 0.40a 32.33a 93.67b C1 nd** 12.00c 73.33c nd** 2.07b 5.97c C2 nd** 13.33c 70.00c nd** 2.1b 6.87c P1: polluted soil without the addition of 1% zeolite. P2: polluted soil with the addition of 1% zeolite. C1: unpolluted soil without the addition of 1% zeolite. C2: unpolluted soil with the addition of 1% zeolite. * Different letters in each column indicate statistically significant differences (F-test, p < 0.05). Table 3.
Total and available metal concentration in the soils after harvesting white clover plants.
Figures
(3)
Tables
(3)