-

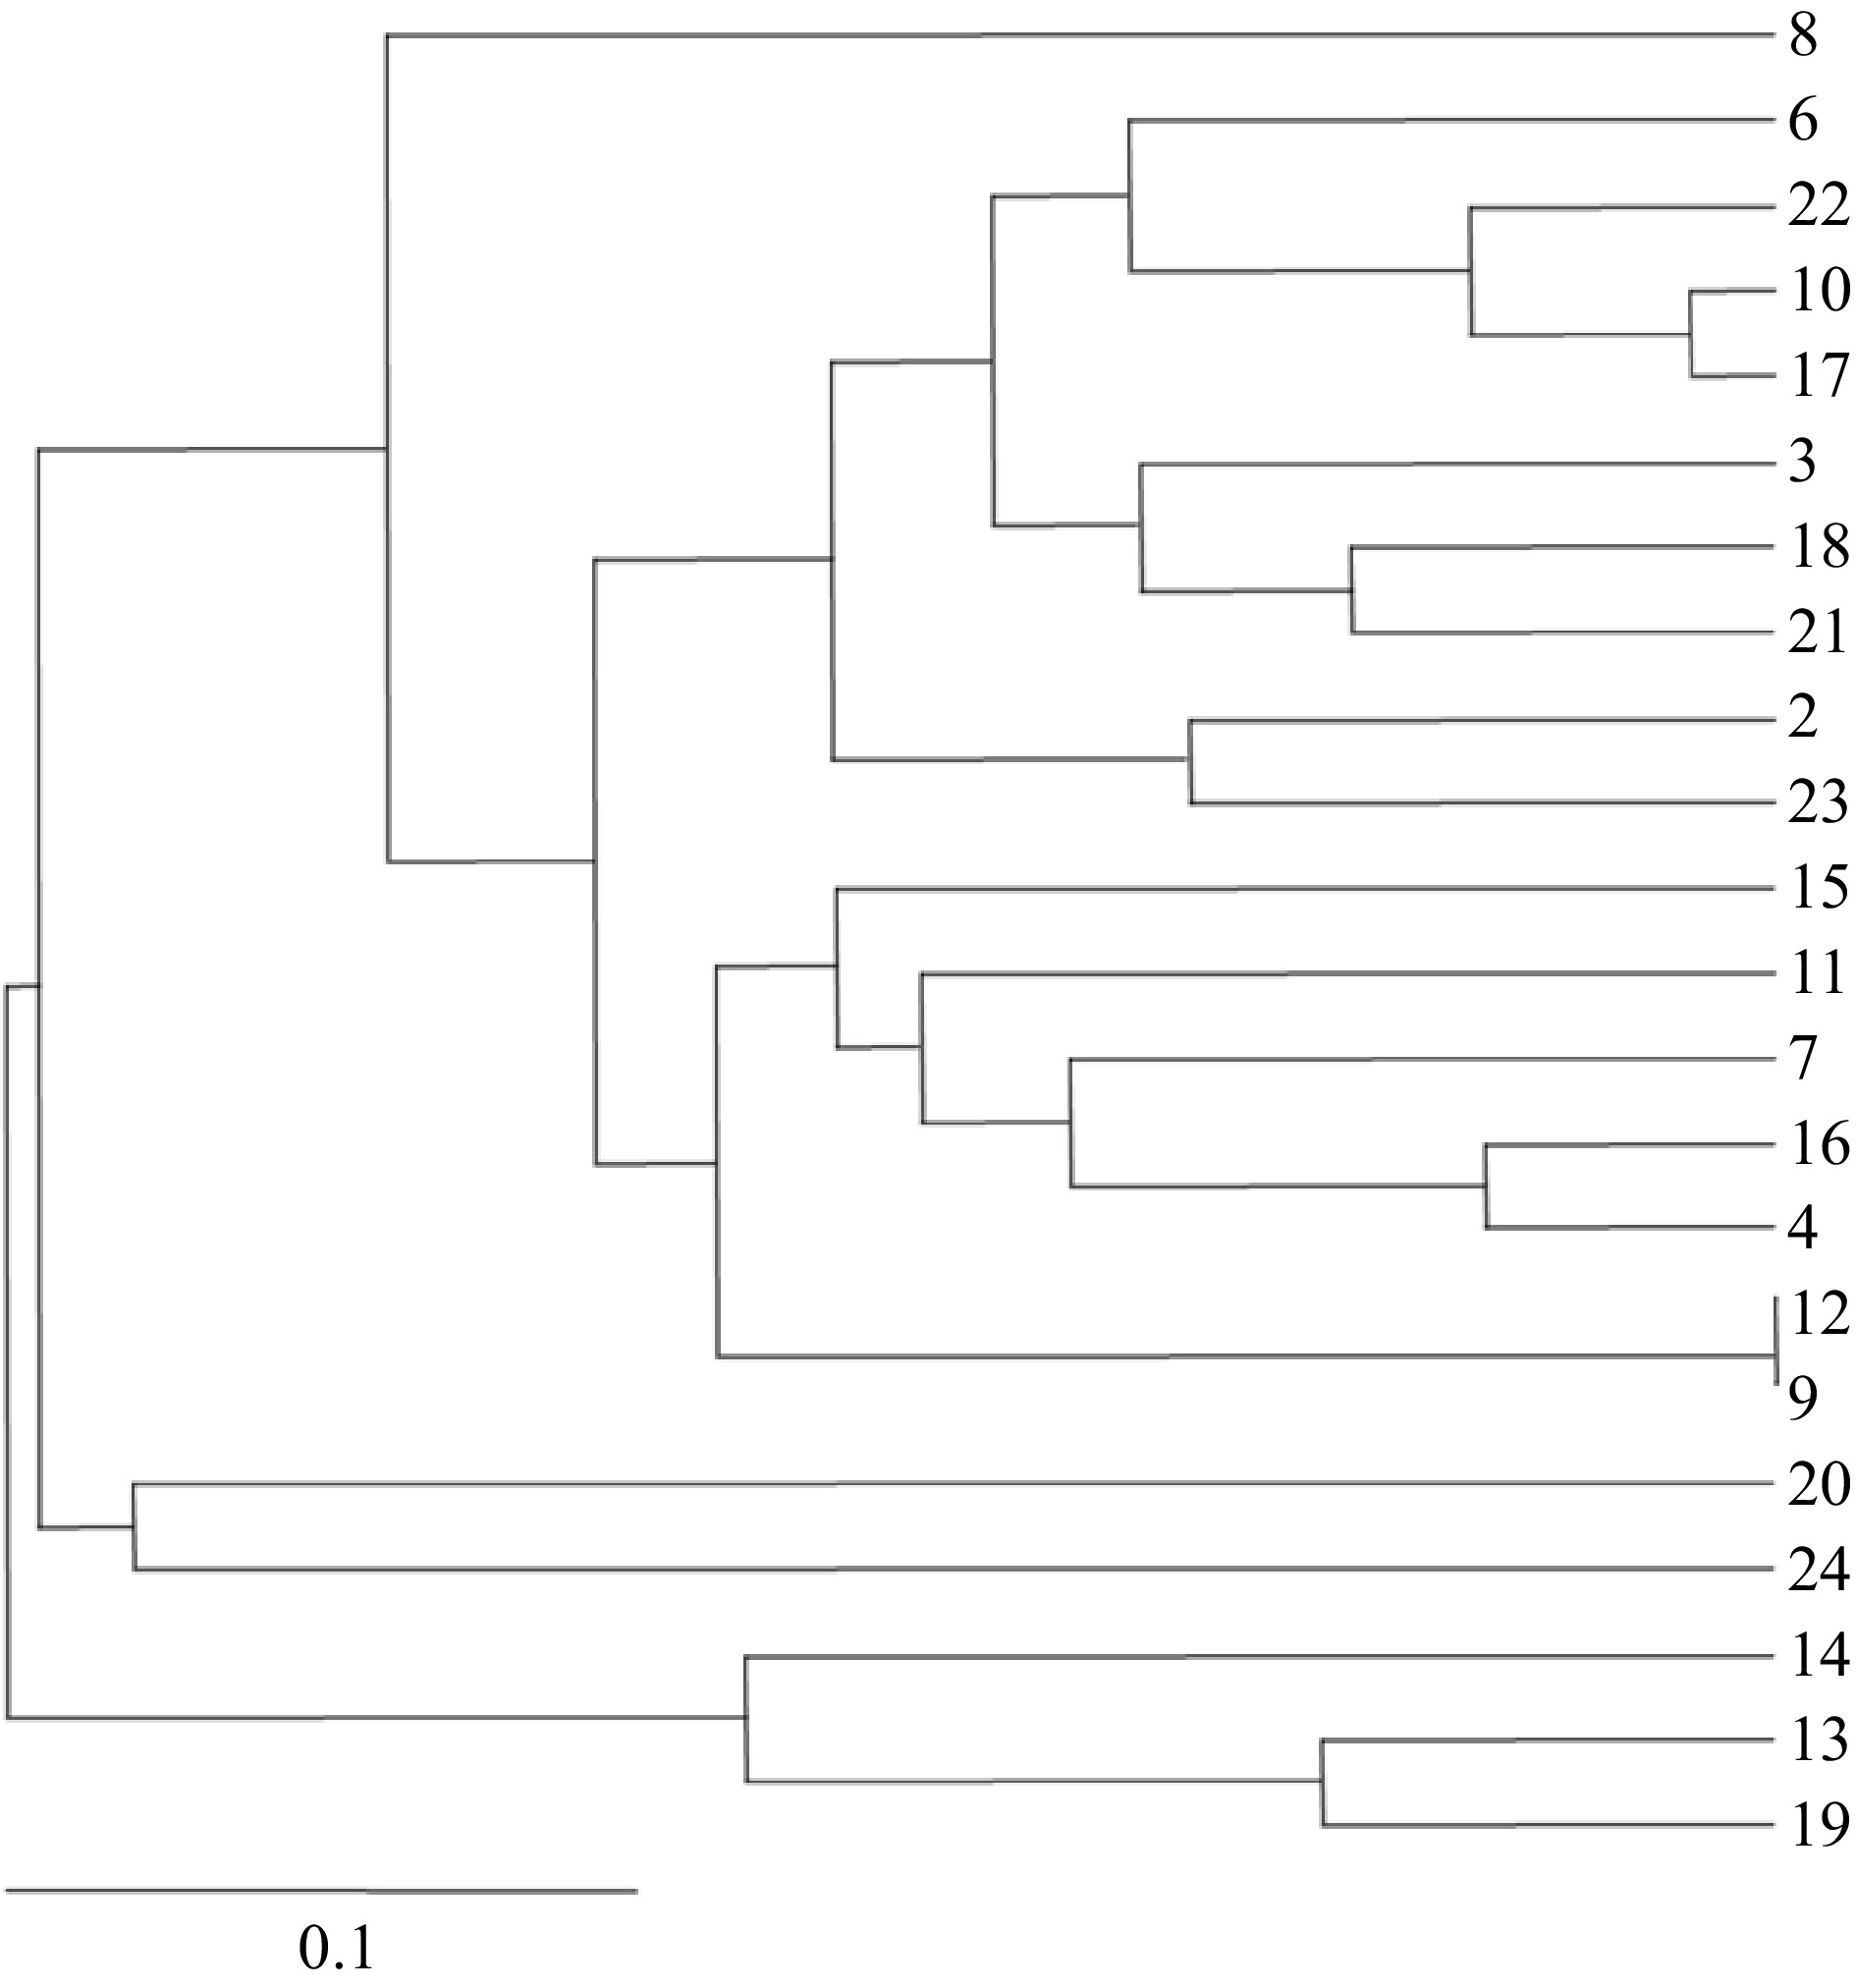
Figure 1.
Dendrogram showing the diversity of root nodule bacteria (Bradyrhizobium sp.) isolated from L. uliginosus, derived from ERIC-PCR fingerprints using UPGMA method, at 85% similarity.
-

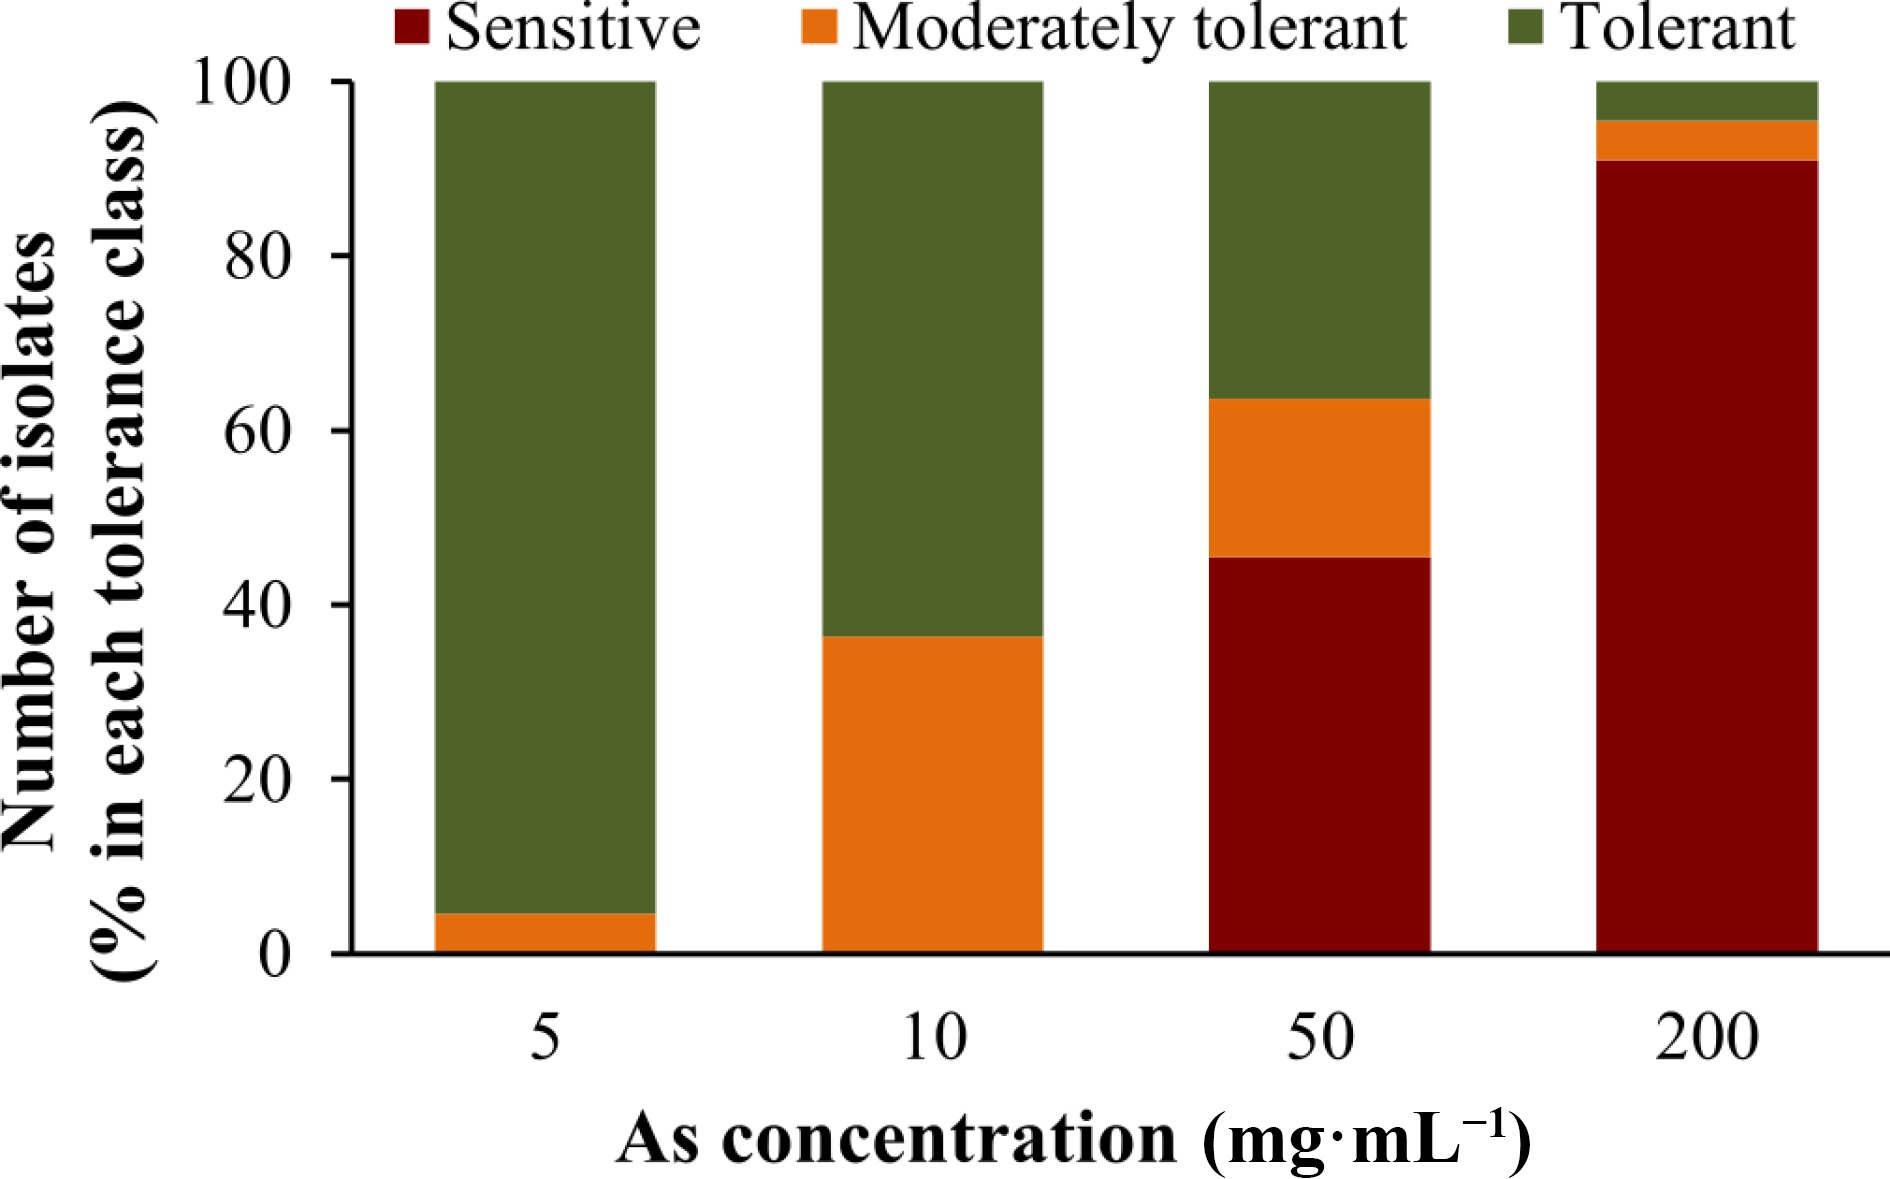
Figure 2.
Tolerance of the L. uliginosus isolates to different As concentrations (5, 10, 50 and 200 mg·mL−1). Isolates were classified according to the percentage of growth inhibition relative to controls grown in the absence of As, being considered sensitive (80%−100%), moderately tolerant (60%−80%) and tolerant (< 60%). Stacked-columns indicate the percentage of isolates in the three tolerance classes for each As concentration.
-

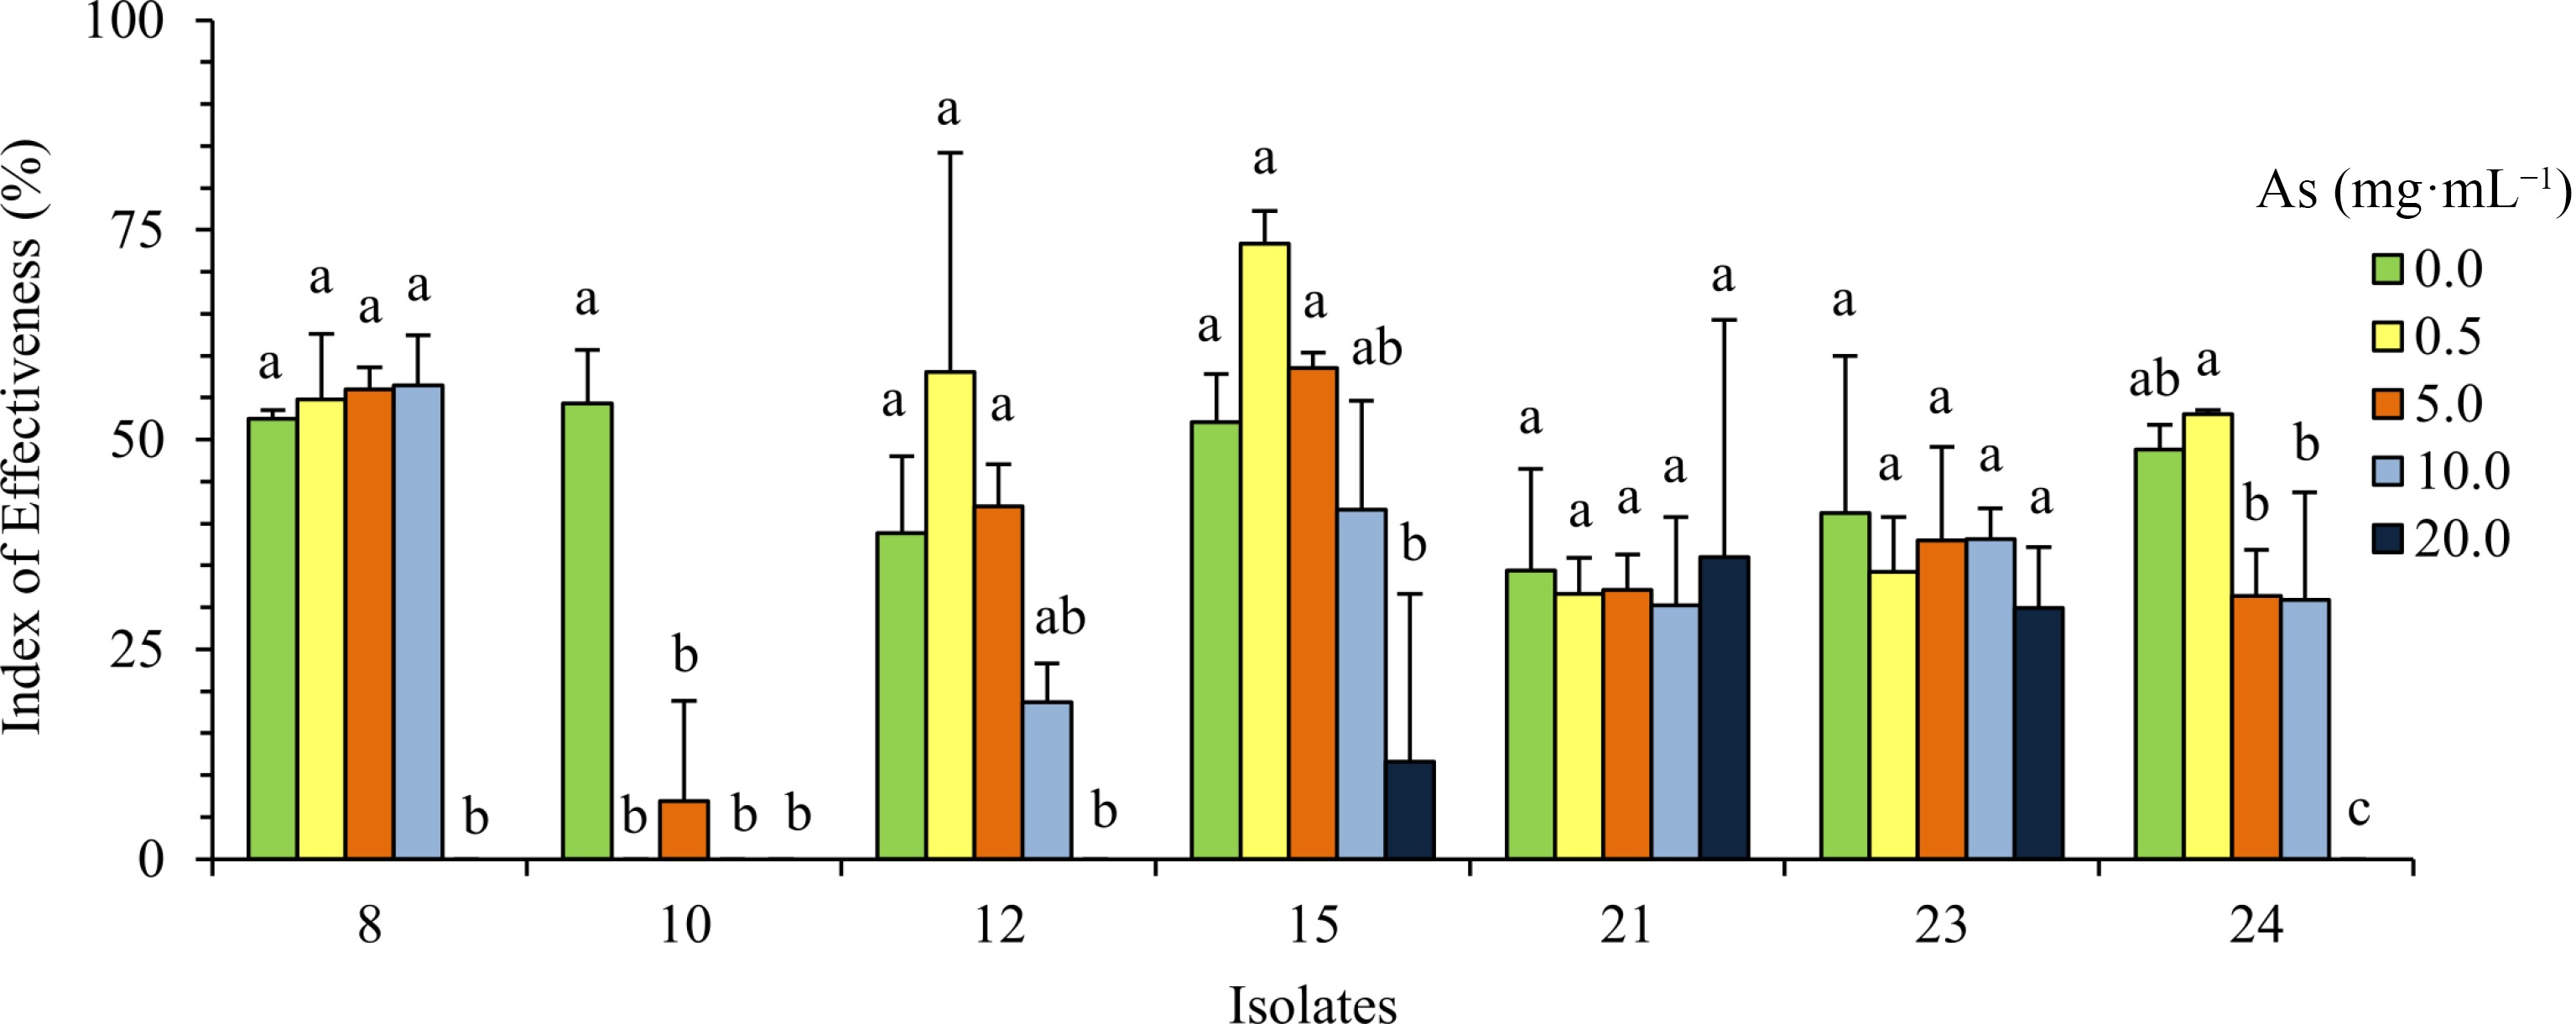
Figure 3.
Effect of As on the symbiosis. Values represent the average of the index of effectiveness (Es) ± SD of L. uliginosus plants inoculated with the bacterial isolates and grown with different As concentrations (0, 0.5, 5, 10 and 20 mg·mL−1). Different letters express significant differences between plants inoculated with each isolate at several As concentrations according to Tukey's HSD test at at P < 0.05.
-

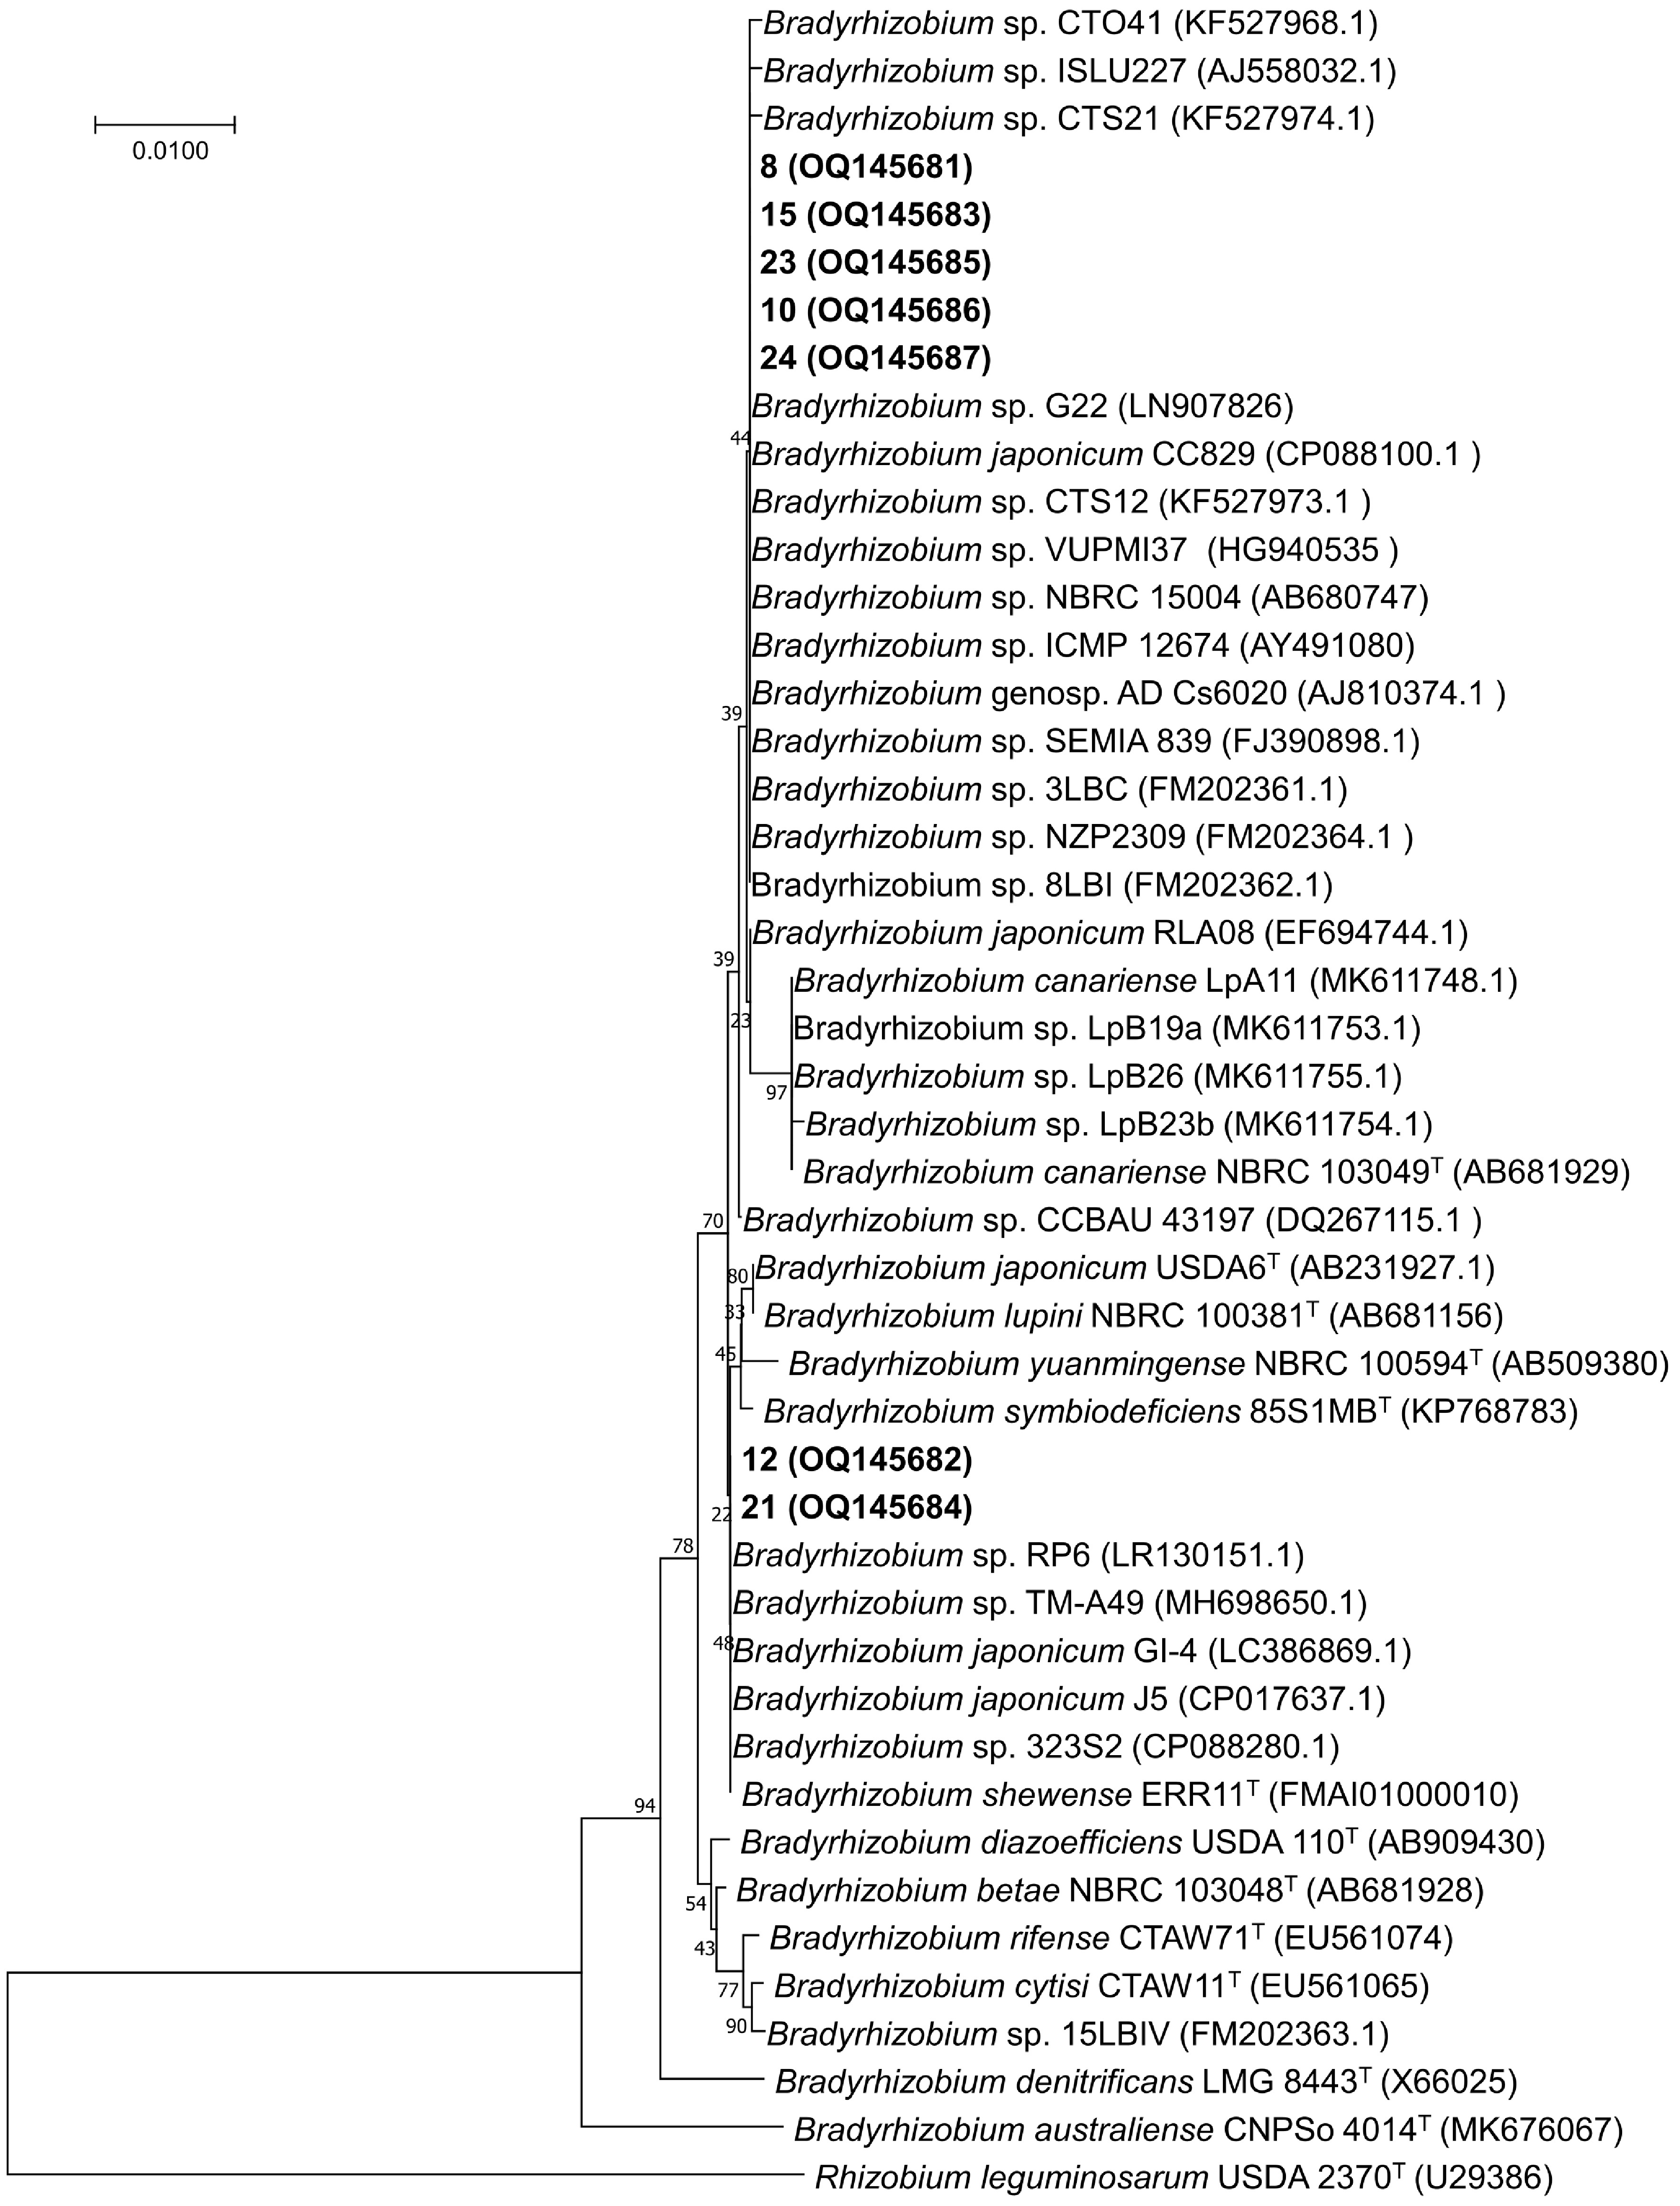
Figure 4.
Phylogeny of the partial 16S rRNA gene with a total of 1189 aligned positions. Confidence bootstrap values are presented near each node. NCBI GenBank accession codes are presented next to each strain. Isolates obtained in this work are in bold. Rhizobium leguminosarum USDA 2370T (U29386) was selected as an outgroup.
-
Isolates As concentration (mg·mL−1) 0 0.5 5 10 20 3 w 6 w 3 w 6 w 3 w 6 w 3 w 6 w 3 w 6 w 8 + + + + + + + + − − + + + + + + + + − − + + + + + + + + − − 10 + + − ± − ± − − − − + + − ± − ± − − − − + + − ± − ± − − − − 12 + + + + + + ± ± − − + + + + + + ± ± − − + + + + + + ± ± − − 15 + + − + − + + + − + + + + + + + + + − + + + + + + + + + − + 21 + + − + + + − + − + + + + + + + − + − − + + + + + + − + − − 23 + + − + − + − + − + + + − + − + + + − + + + + + + + + + − − 24 + + + + − + − + − − + + + + − + − + − − + + − − − + − + − − w, incubation weeks; +, presence of nodules; −, absence of nodules; ±, presence of small and white nodules. Table 1.
Nodulation phenotype of L. uliginosus plants inoculated with the different isolates upon different As concentrations.
Figures
(4)
Tables
(1)