-
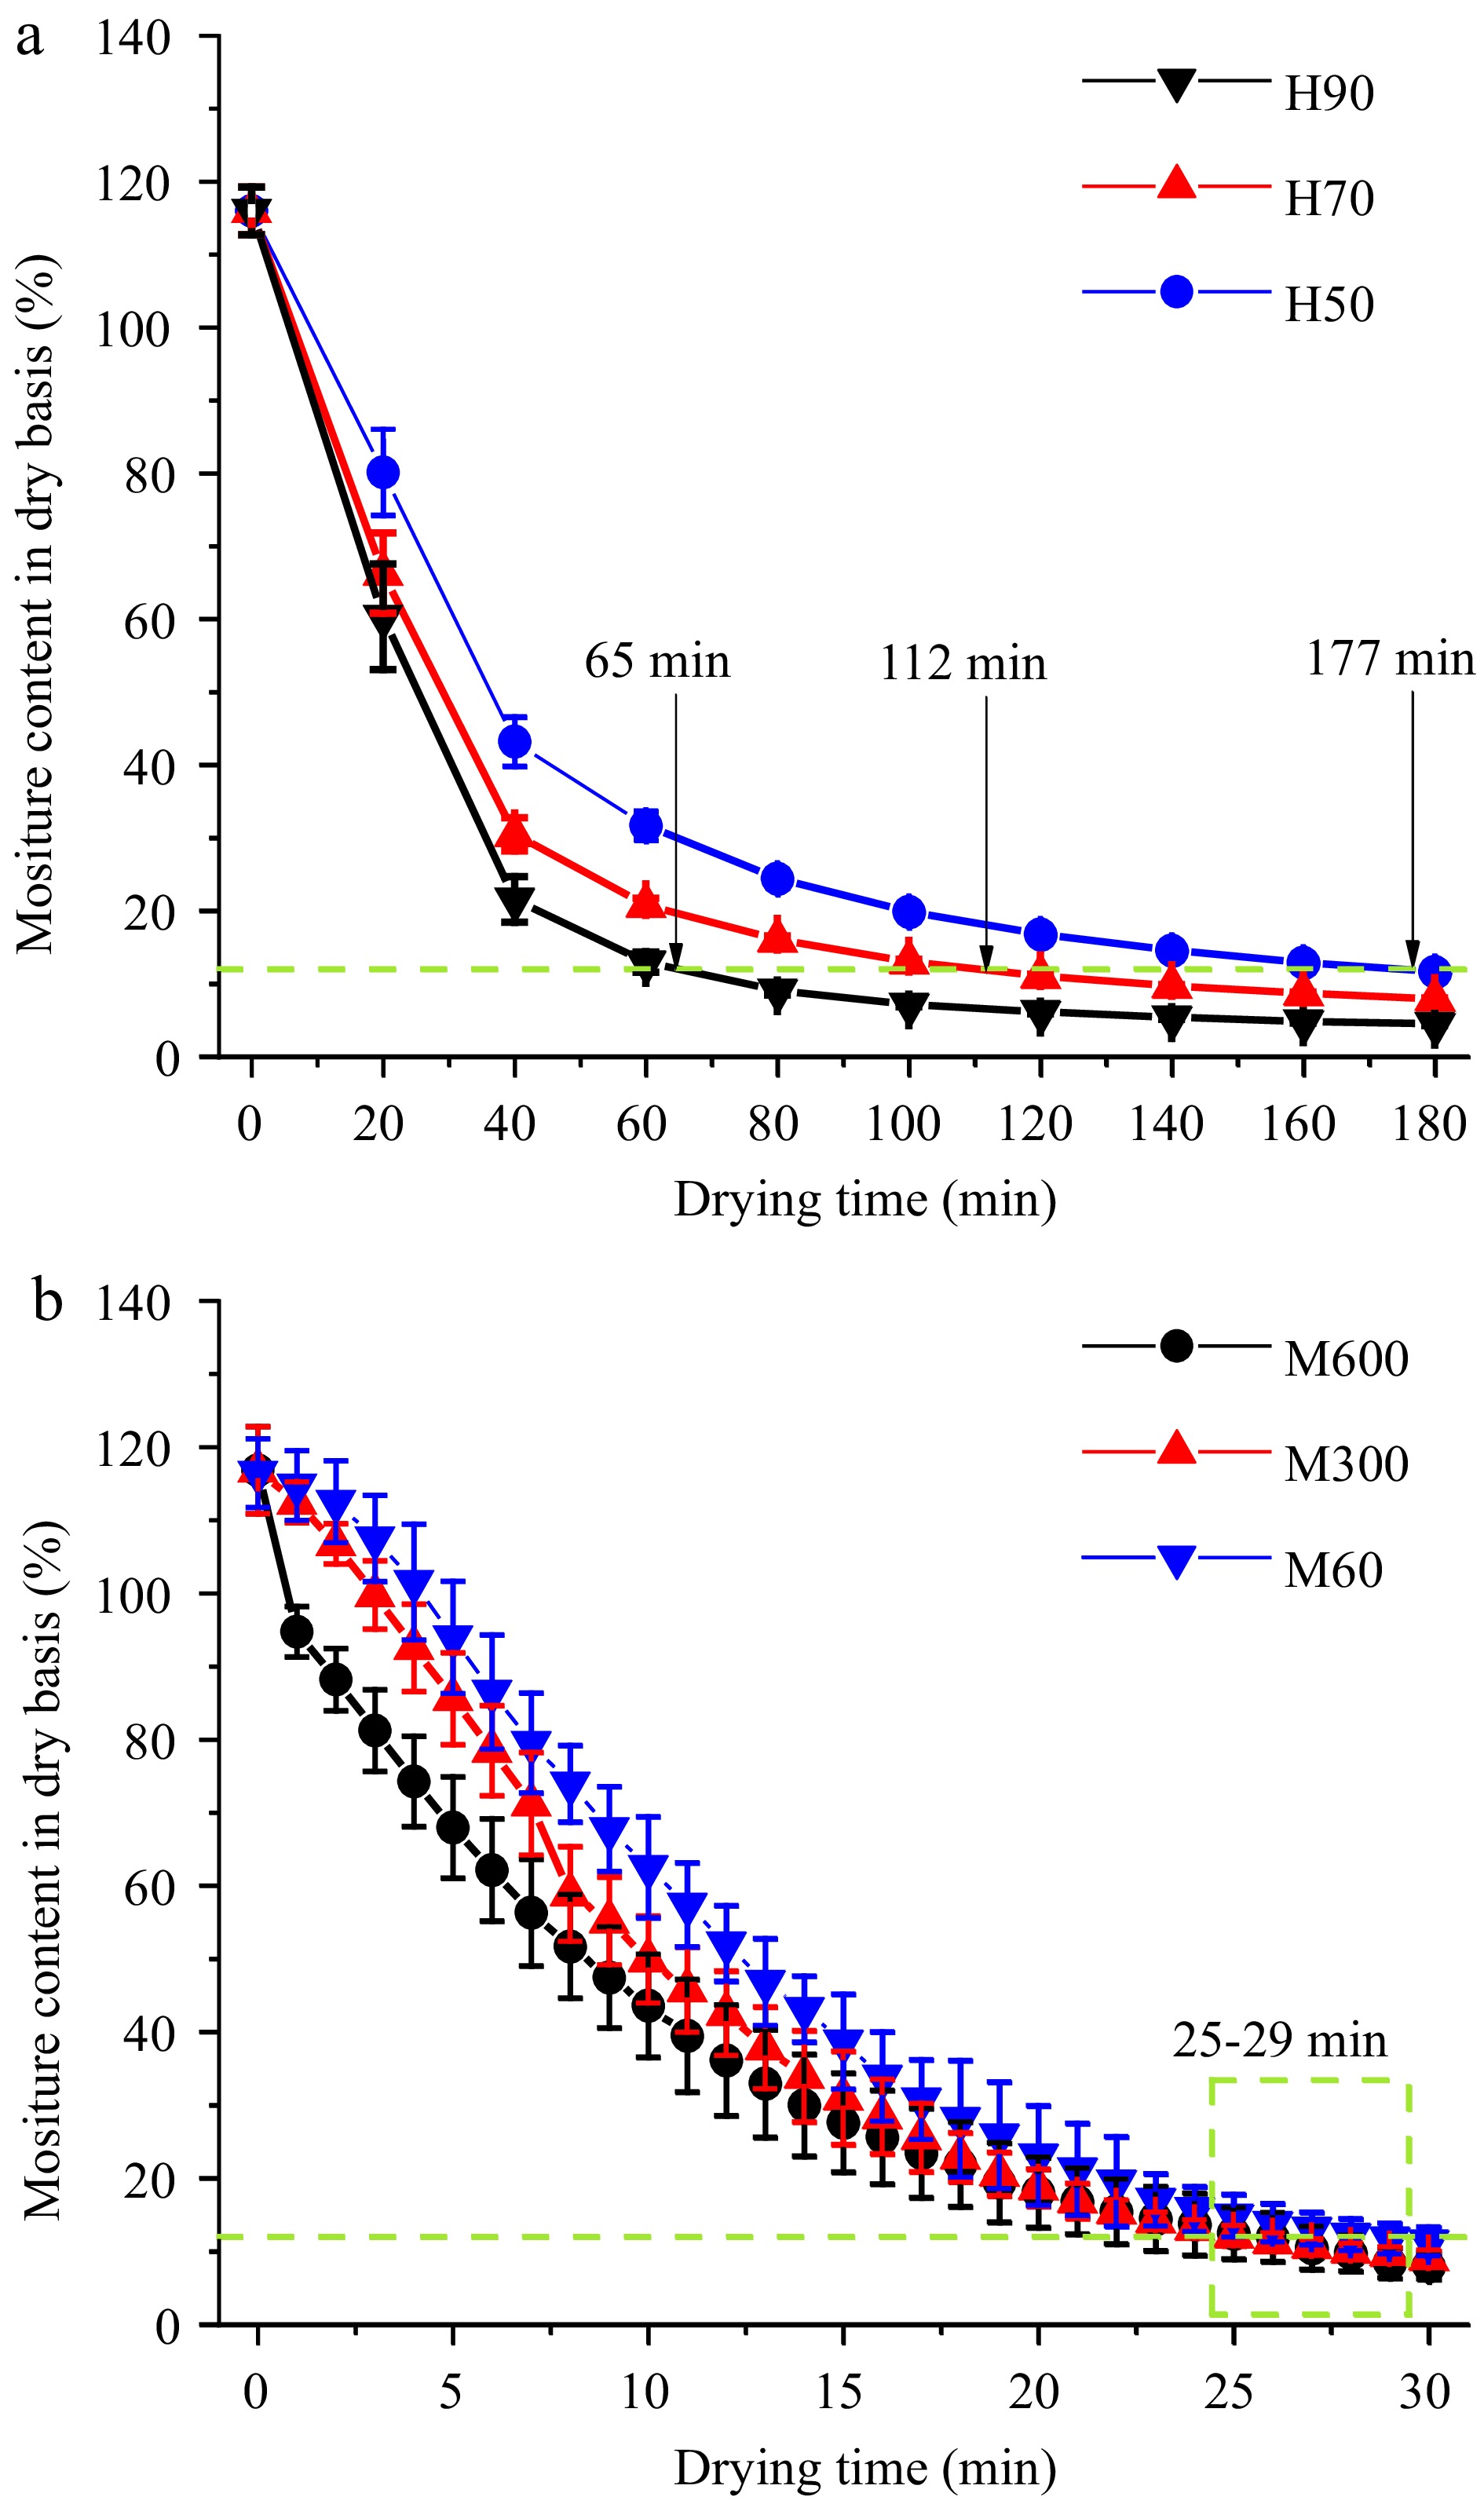
Figure 1.
Drying kinetics of pre-cooked mung bean during (a) hot air and (b) microwave drying. Note: H50, H70, and H90 represent hot air drying at 50, 70, and 90 °C, respectively; M60, M300, and M600 represent microwave treatment at 60, 300, and 600 W, respectively.
-
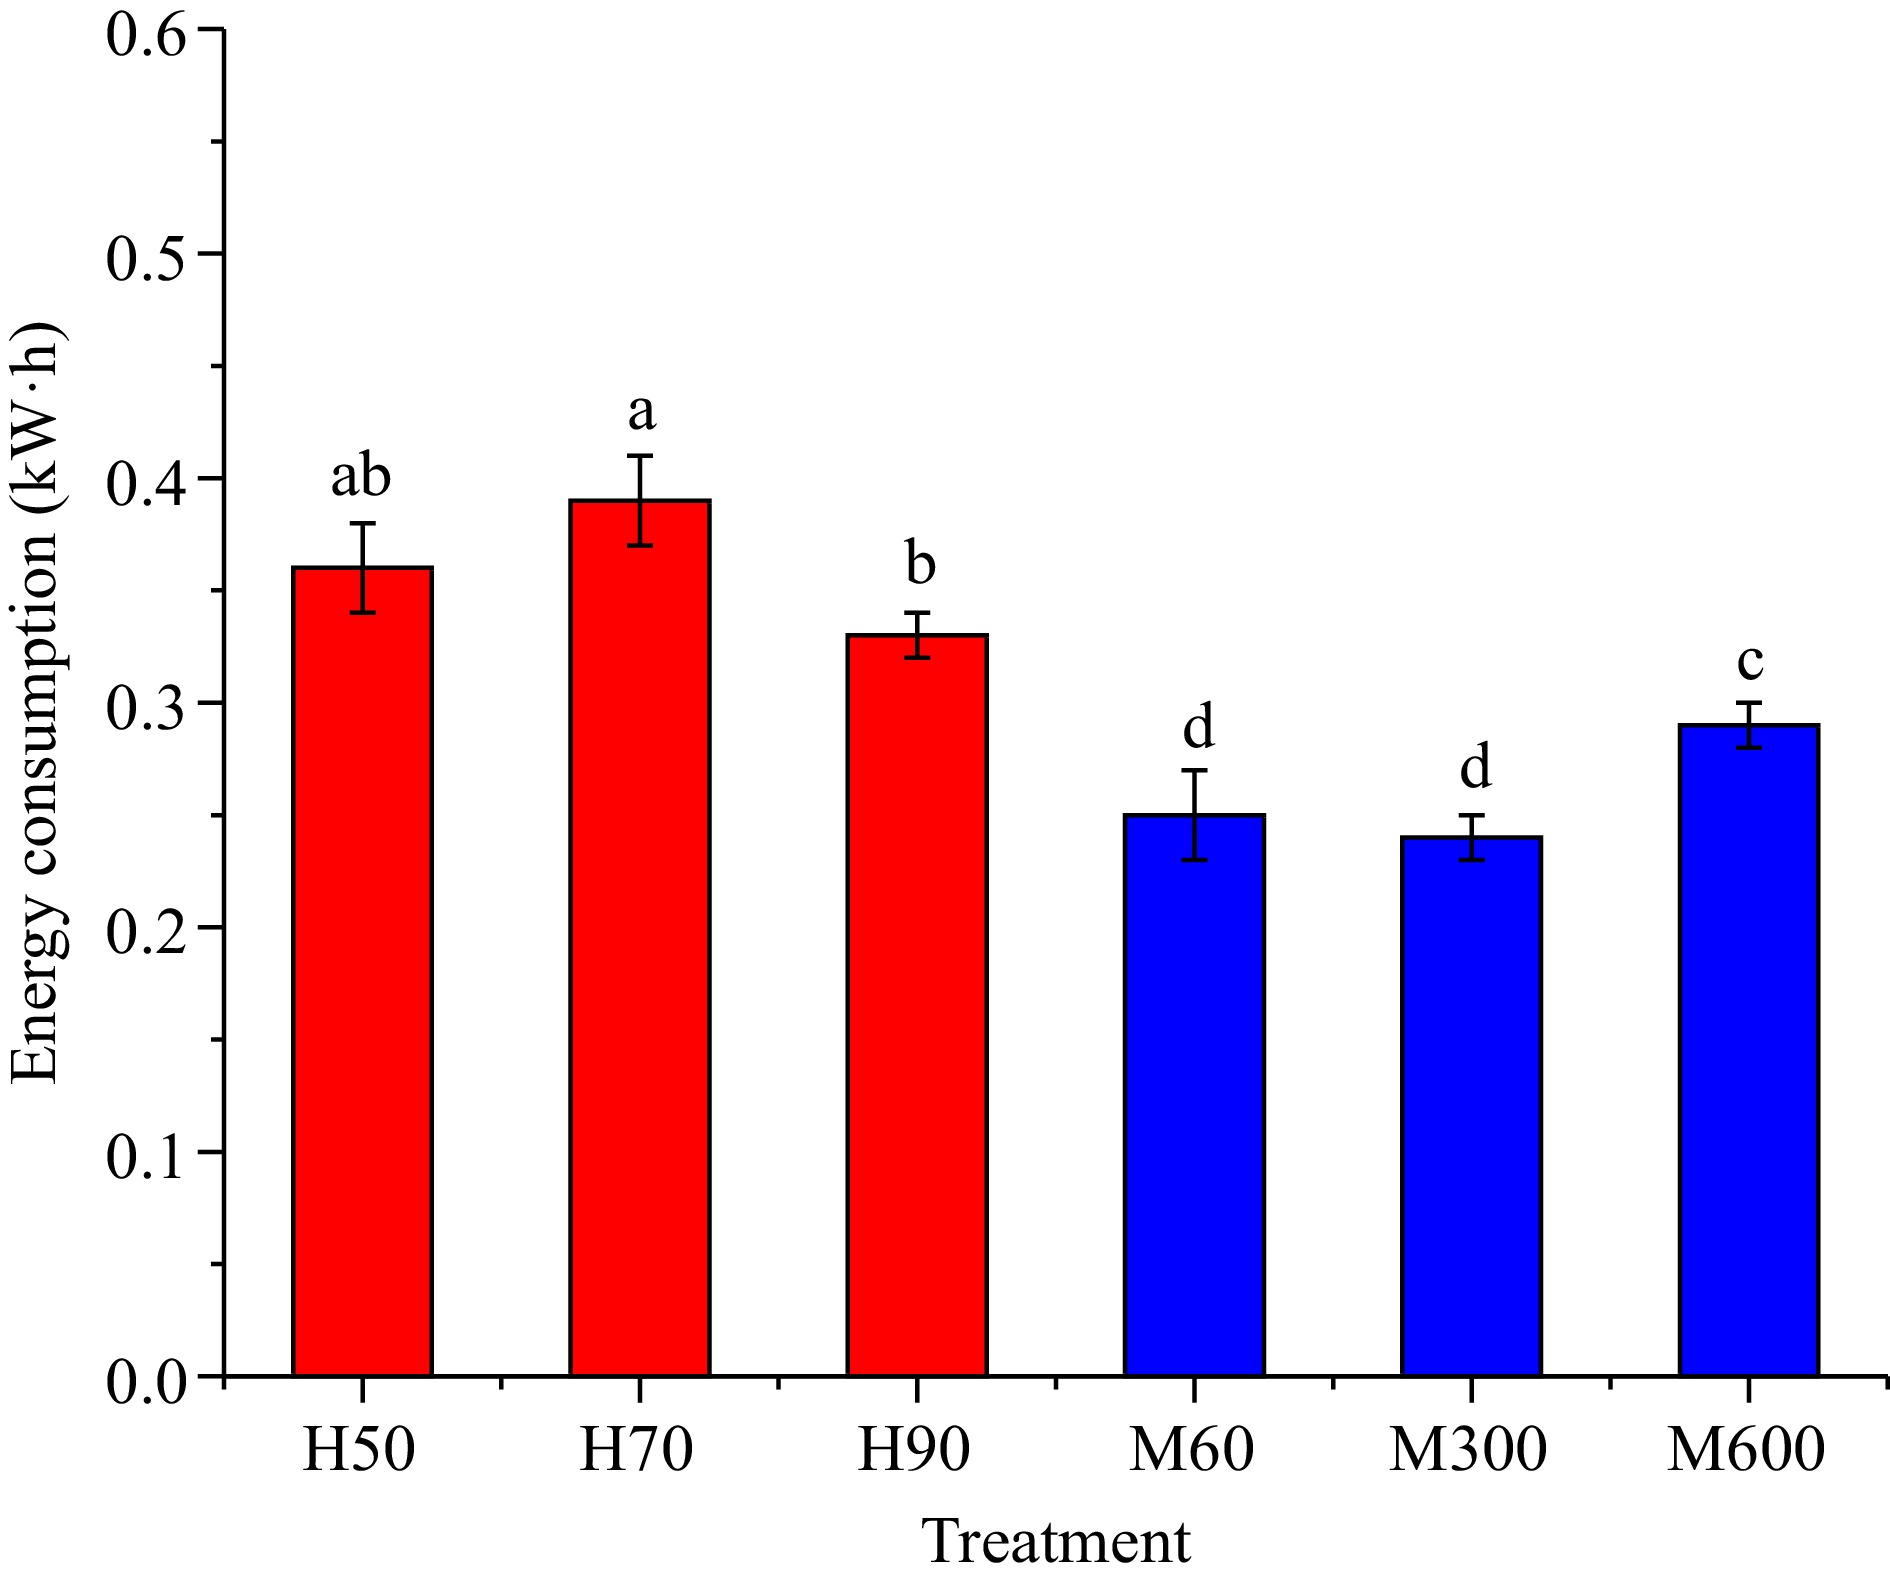
Figure 2.
Energy consumption during hot air and microwave drying of pre-cooked mung bean. Note: Same as Fig. 1.
-
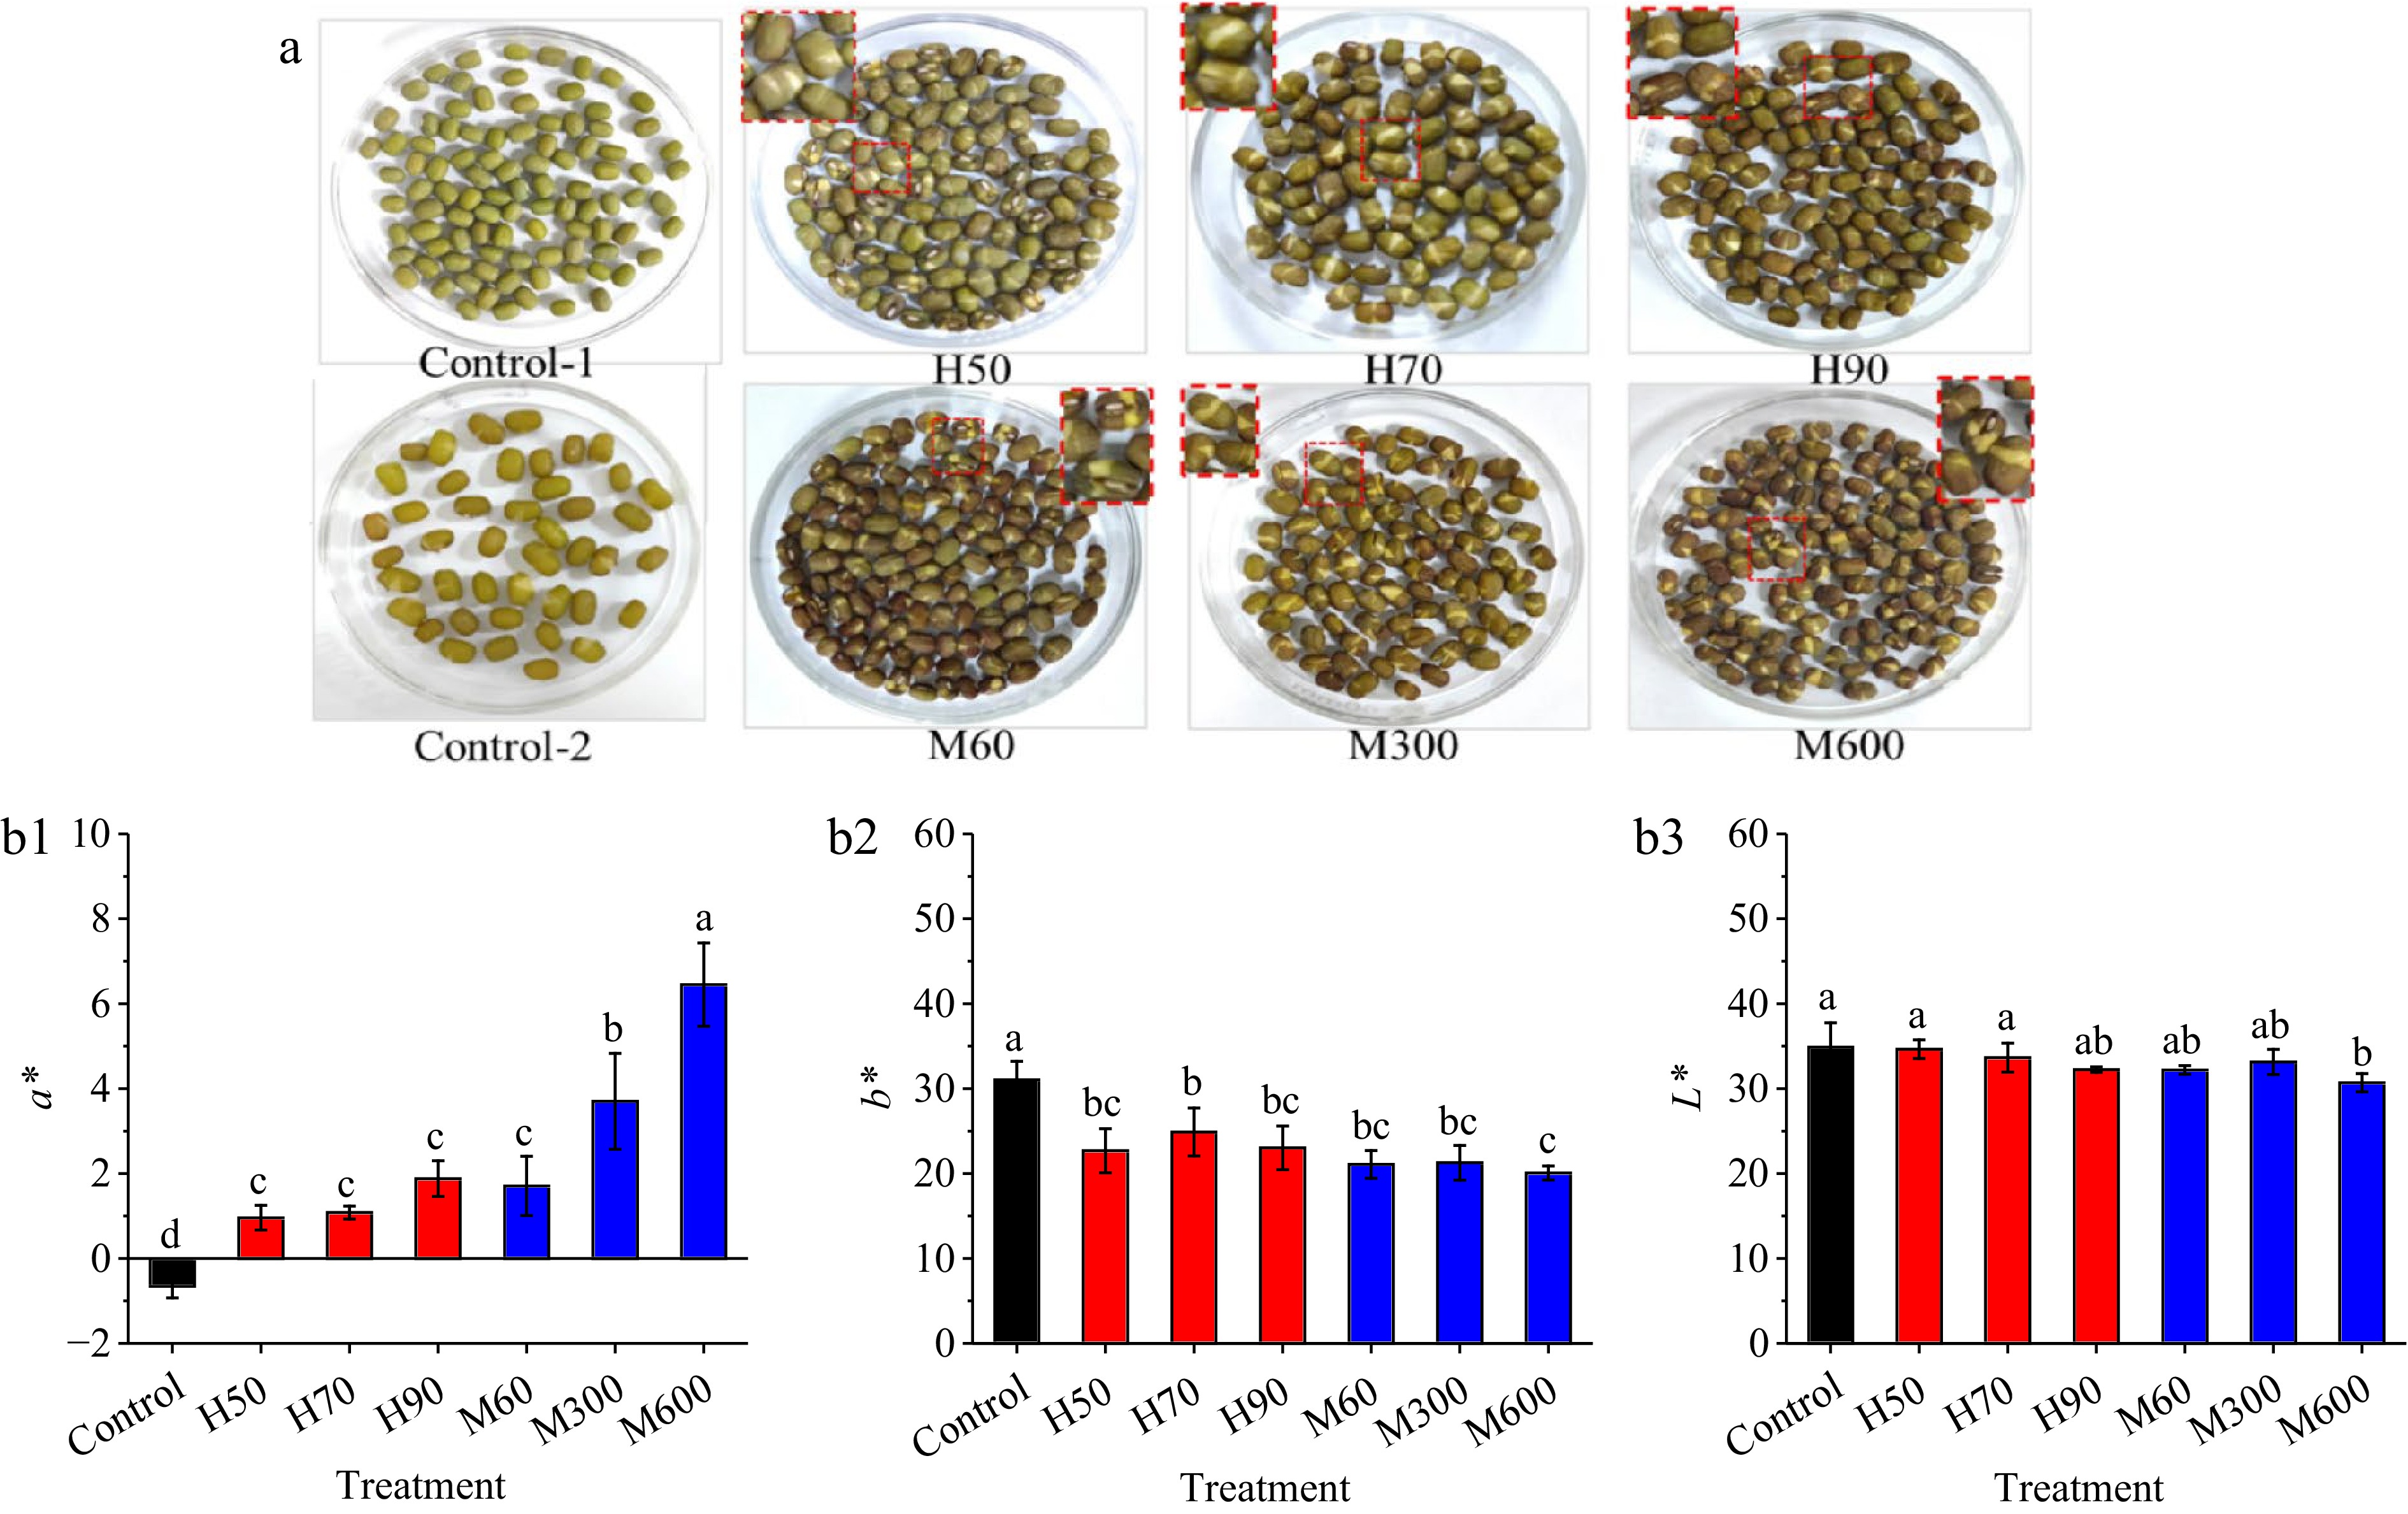
Figure 3.
Effects of hot air and microwave drying on (a) appearance and (b) color of pre-cooked mung bean. Note: Control-1/Control represents native mung bean; Control-2 represents pre-cooked mung bean; H50, H70, H90, M60, M300, and M600 were same as Fig. 1.
-
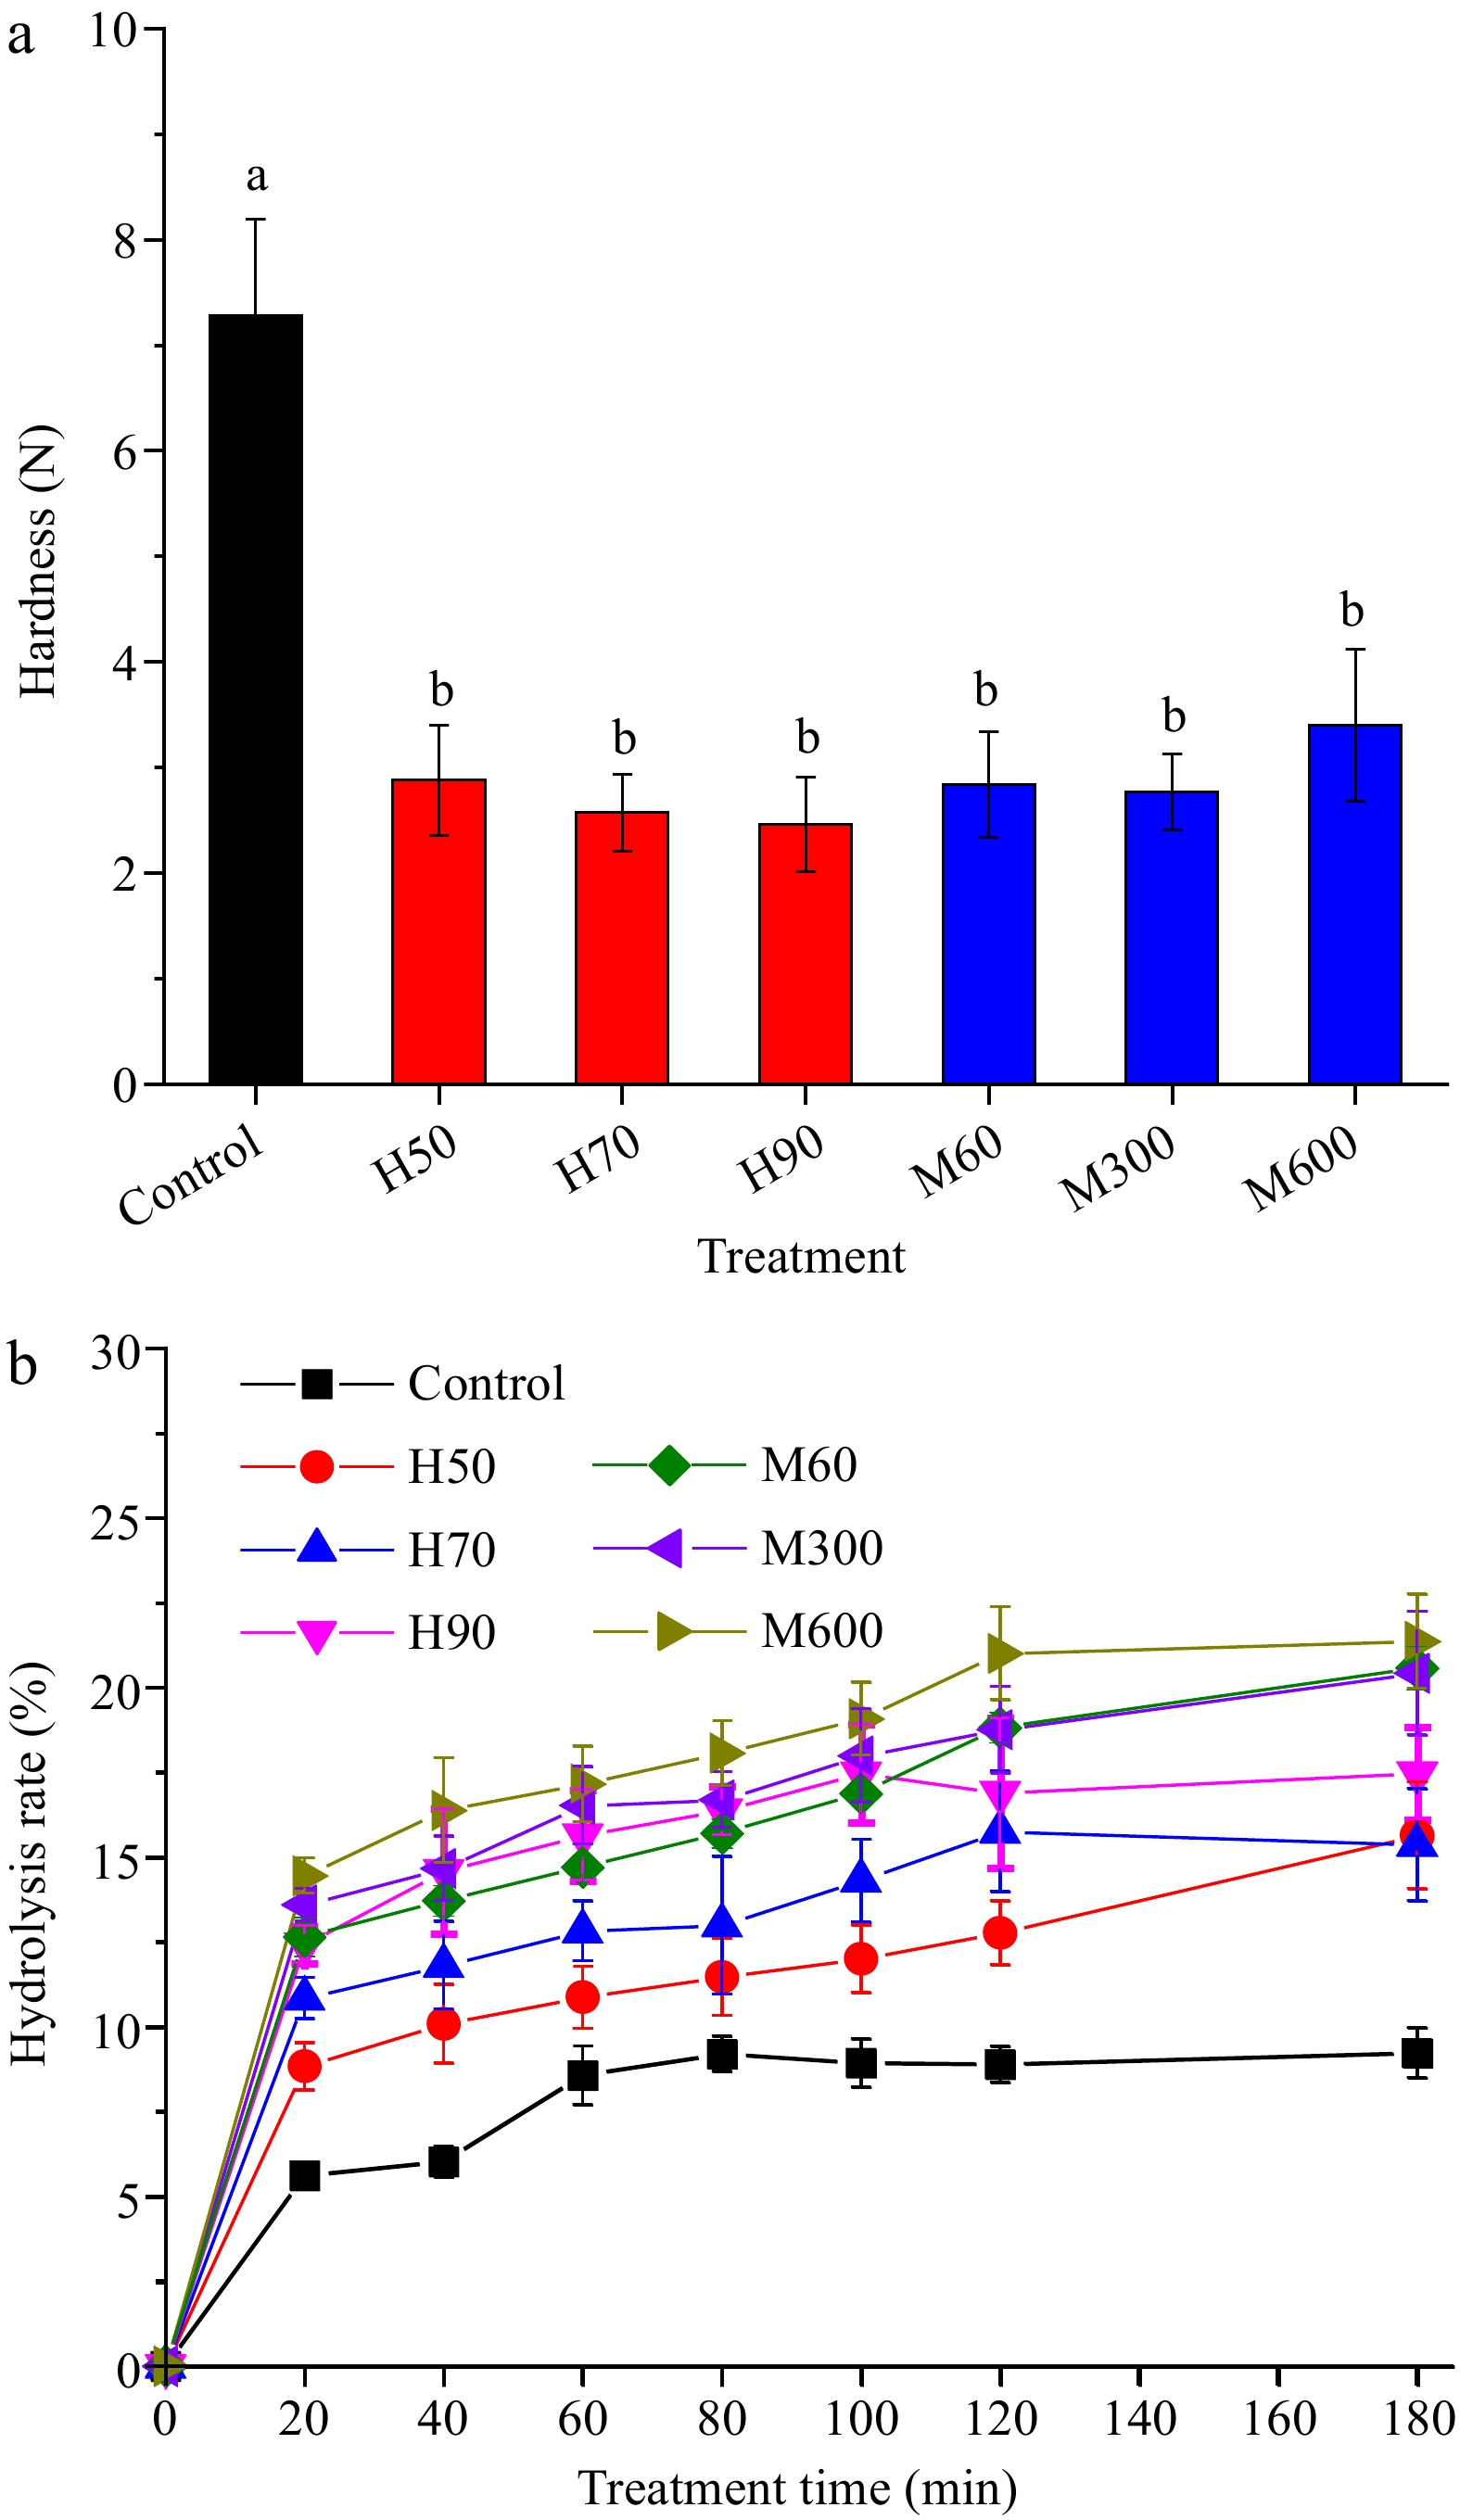
Figure 4.
(a) Hardness and (b) in vitro digestibility of native and pre-cooked mung bean dried by hot air and microwave. Note: Same as Fig. 3.
-
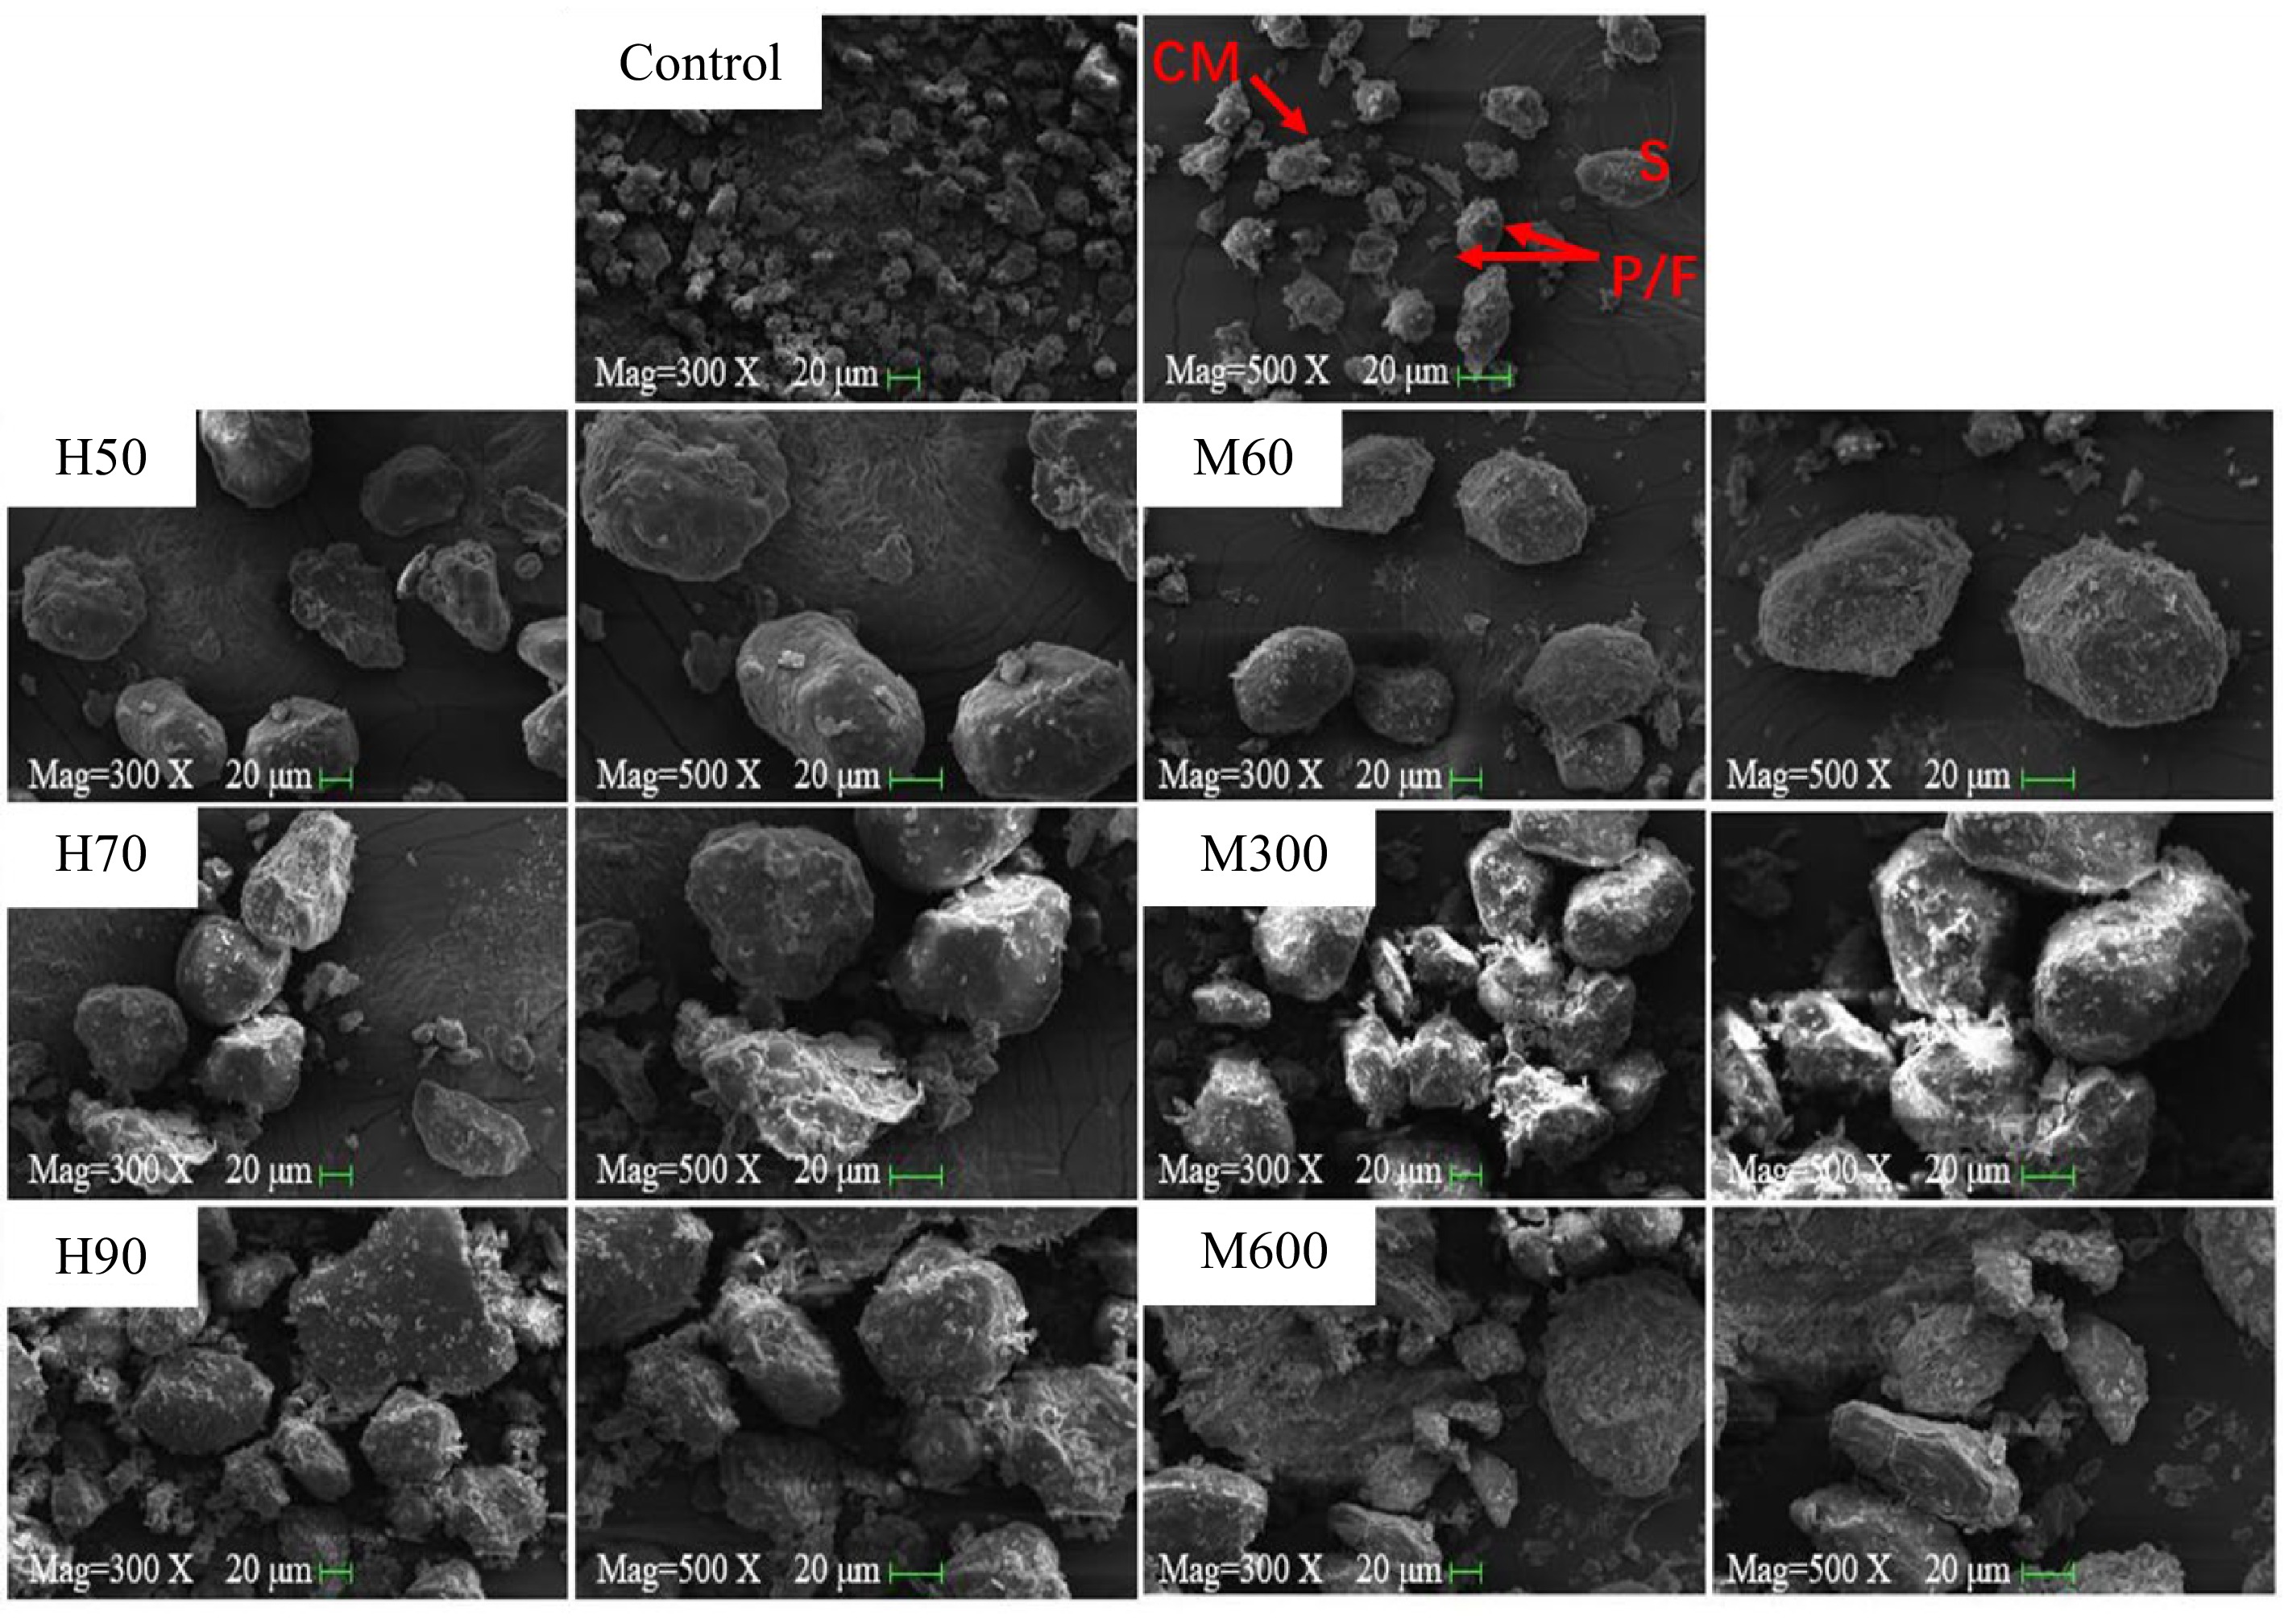
Figure 5.
SEM images of pre-cooked mung bean after hot air and microwave drying. Note: Same as Fig. 3.
-
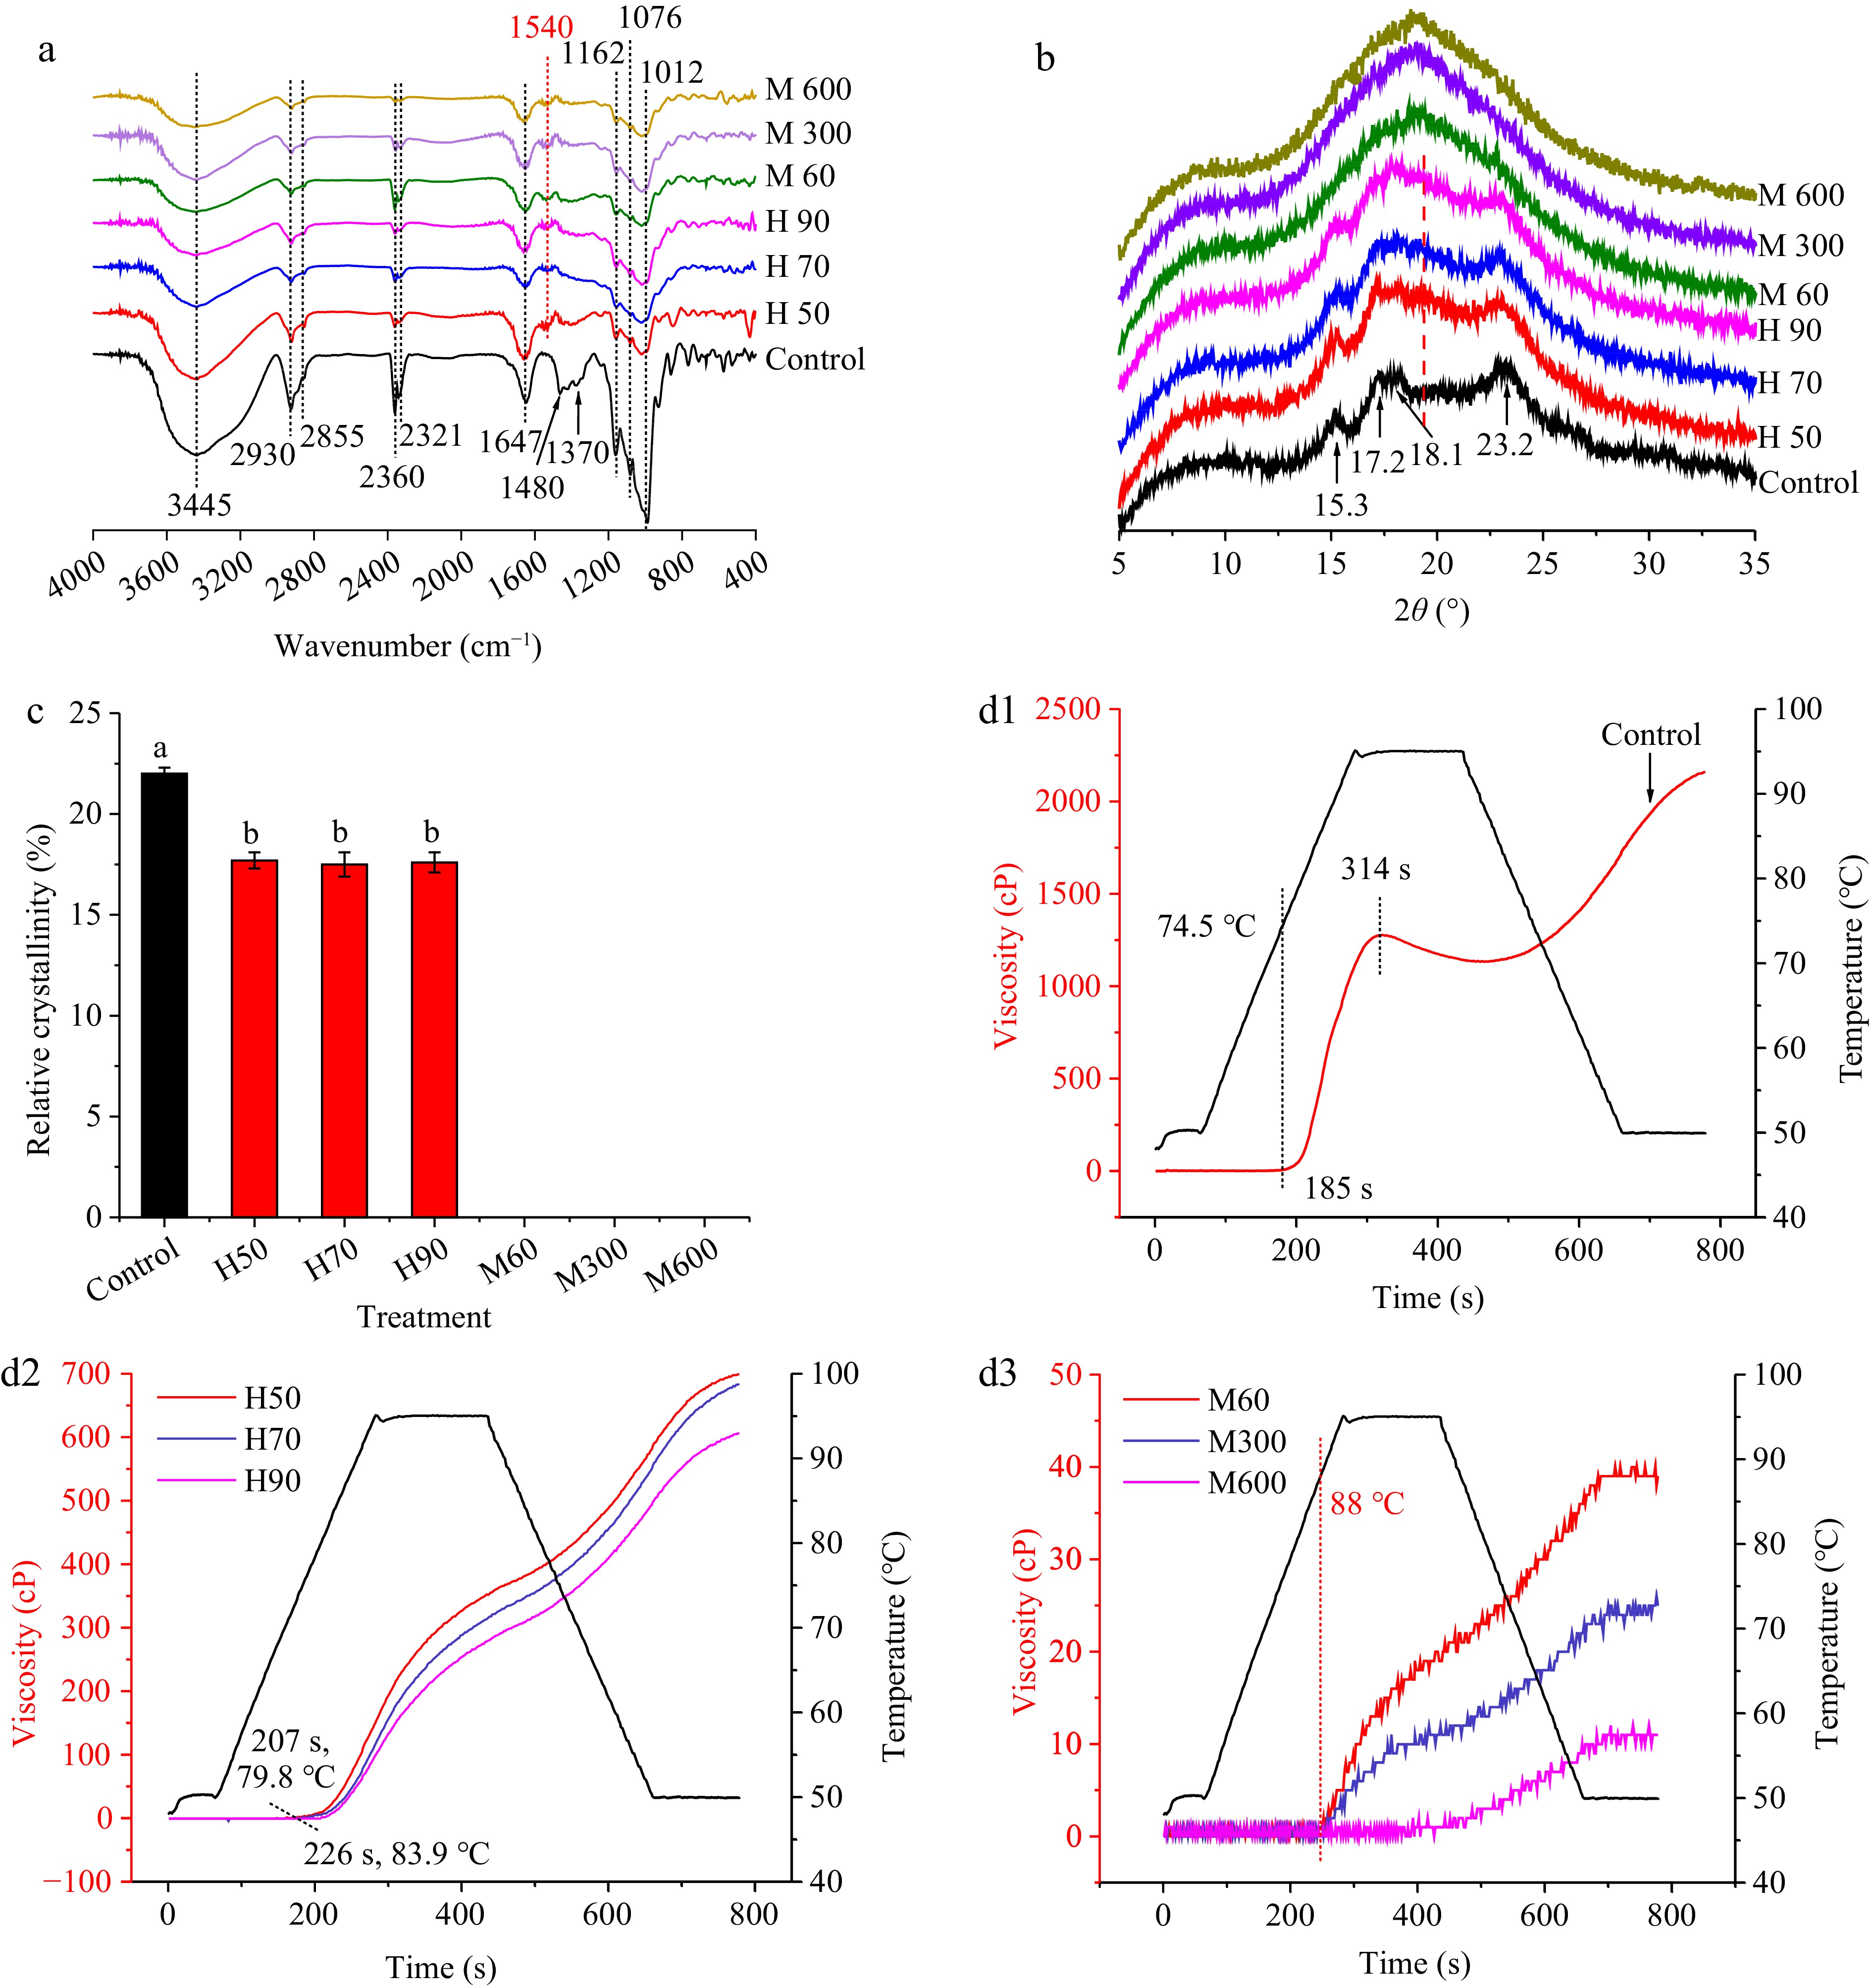
Figure 6.
(a) FT-IR spectra, (b) XRD patterns, (c) relative crystallinity, and (d) RVA curves of native and pre-cooked mung bean dried by hot air and microwave. Note: Same as Fig. 3.
-
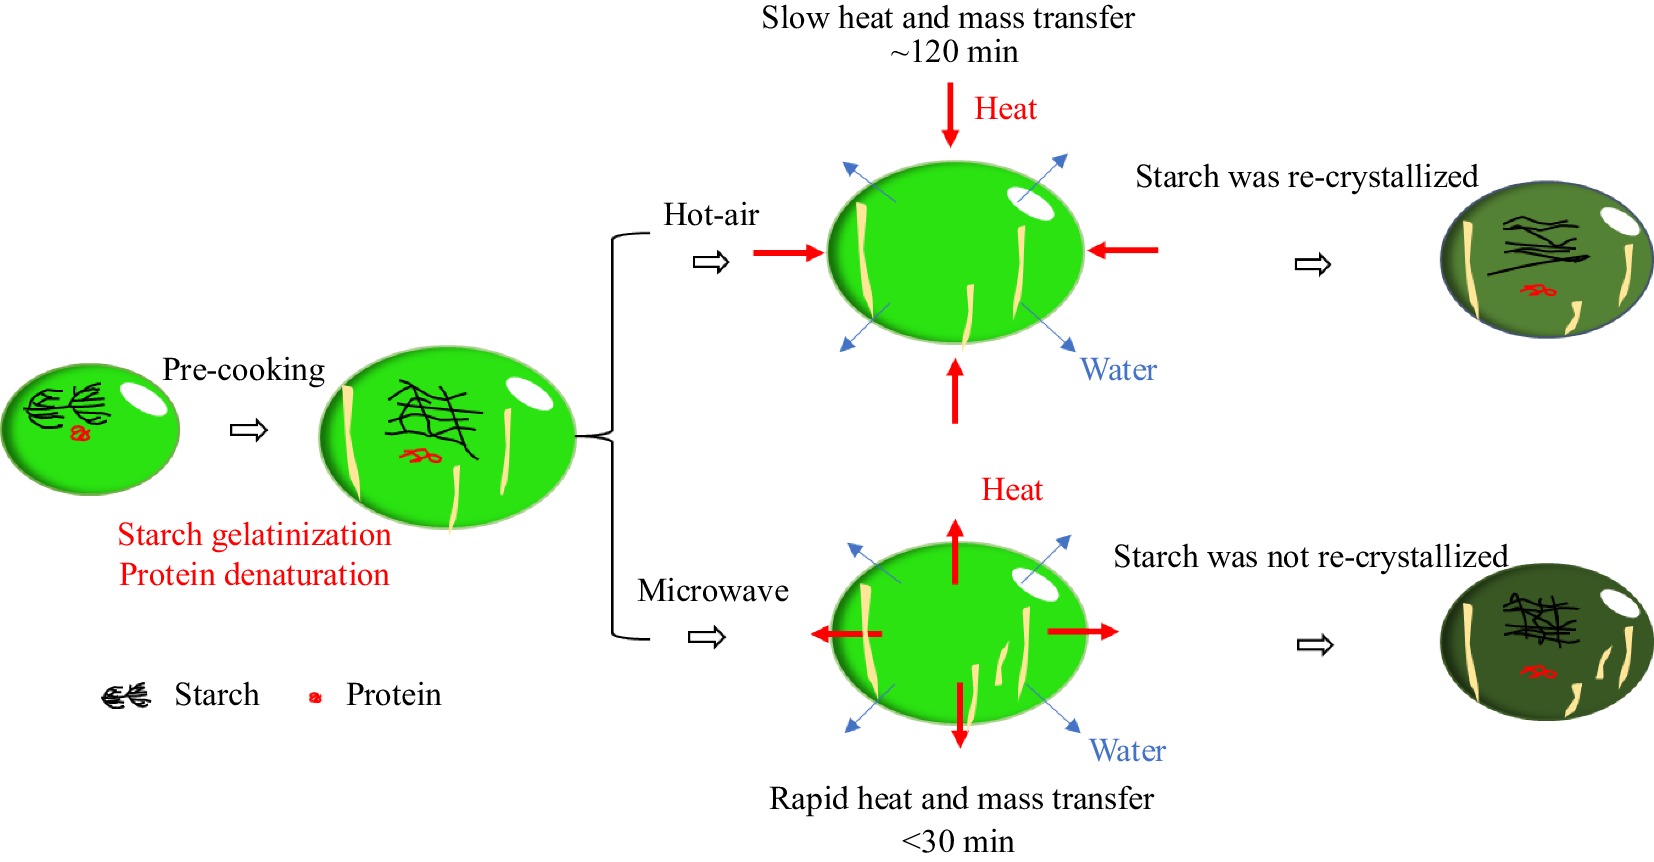
Figure 7.
Drying process of pre-cooked mung bean during hot air and microwave treatment.
-
Treatment Peak viscosity
(cP)Trough viscosity (cP) Breakdown
(cP)Final viscosity (cP) Setback
(cP)Control 560 ± 24a 496 ± 24a 64 ± 2a 1,011 ± 35a 515 ± 18a H50 348 ± 6b 295 ± 5b 53 ± 1bc 705 ± 6b 410 ± 1b H70 319 ± 20c 263 ± 18c 55 ± 3b 683 ± 7b 420 ± 24b H90 267 ± 3d 216 ± 2d 51 ± 1c 599 ± 7c 382 ± 6c M60 19 ± 1e 14 ± 0.6e 4 ± 1d 39 ± 1d 25 ± 1d M300 9 ± 3e 6 ± 3e 3 ± 1d 22 ± 3de 16 ± 1d M600 2 ± 0e 0 ± 0e 2 ± 0d 10 ± 1e 10 ± 1d Different letters within same column represents significant difference (p < 0.05). Control represents native mung bean; H50, H70, and H90 represent hot air drying at 50, 70, and 90 ºC, respectively; M60, M300, and M600 represent microwave treatment at 60, 300, and 600 W, respectively. Table 1.
RVA parameters of pre-cooked mung bean treated by hot air and microwave.
Figures
(7)
Tables
(1)