-
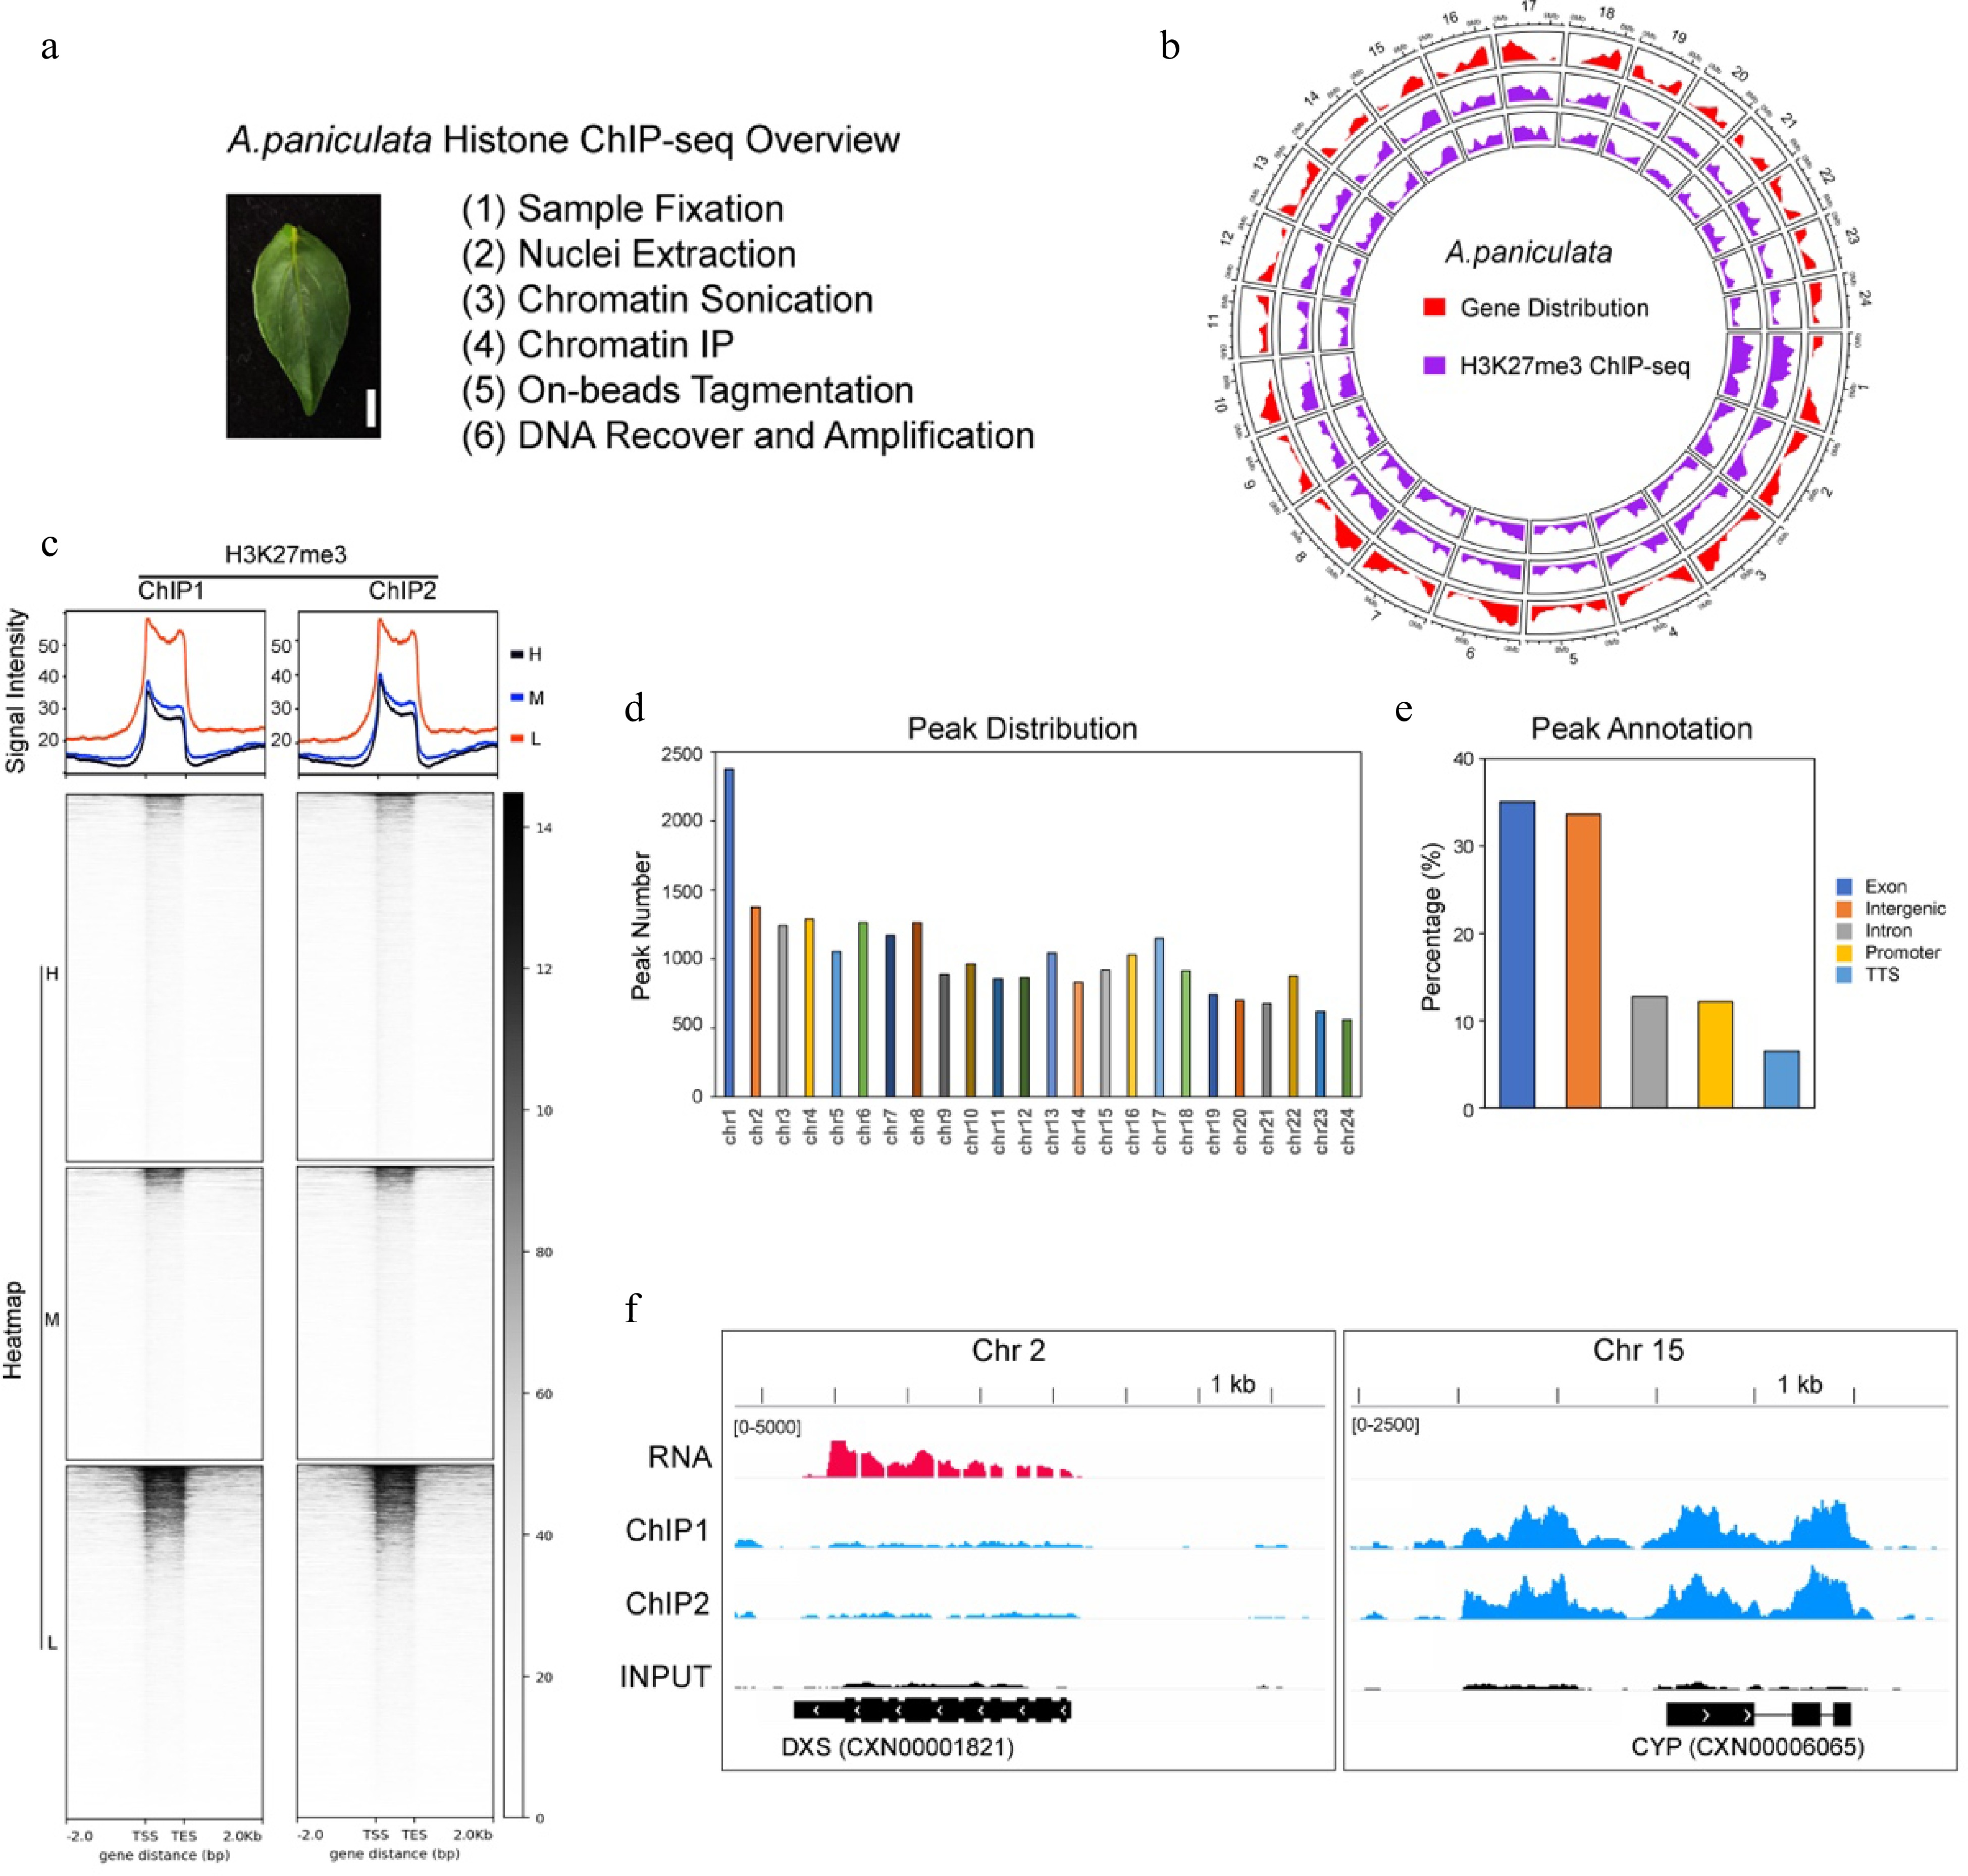
Figure 1.
Overview of the H3K27me3 ChIP-seq in A. paniculata. (a) A brief introduction of the histone ChIP-seq method in this study. The leaf of A. paniculata used in the ChIP-seq experiments. Bar = 0.5 cm. (b) A circos diagram showing the genome-wide distribution of the H3K27me3 ChIP-seq data. The red color indicates the gene location. The two violet circles indicate the two biological replicates of H3K27me3 ChIP-seq. (c) The H3K27me3 ChIP-seq profile and heatmap showing a negative correlation between H3K27me3 modifications and gene expressions. H, M and L indicate the high (FPKM > 10), middle (1 < FPKM ≤ 10) and low (FPKM ≤ 1) expression of genes, respectively. TSS, Transcript start sites; TES, Transcript end sites. ChIP1 and ChIP2 indicate two biological replicates. (d) The number of enriched peaks in the 24 chromosomes in the A. paniculata genome. (e) The genomic annotation of H3K27me3-enriched peaks. TTS, Transcript terminal sites. (f) The andrographolide biosynthesis-related genes, DXS and CYP genes were used as examples to show the H3K27me3 modification state in leaves.
Figures
(1)
Tables
(0)