-
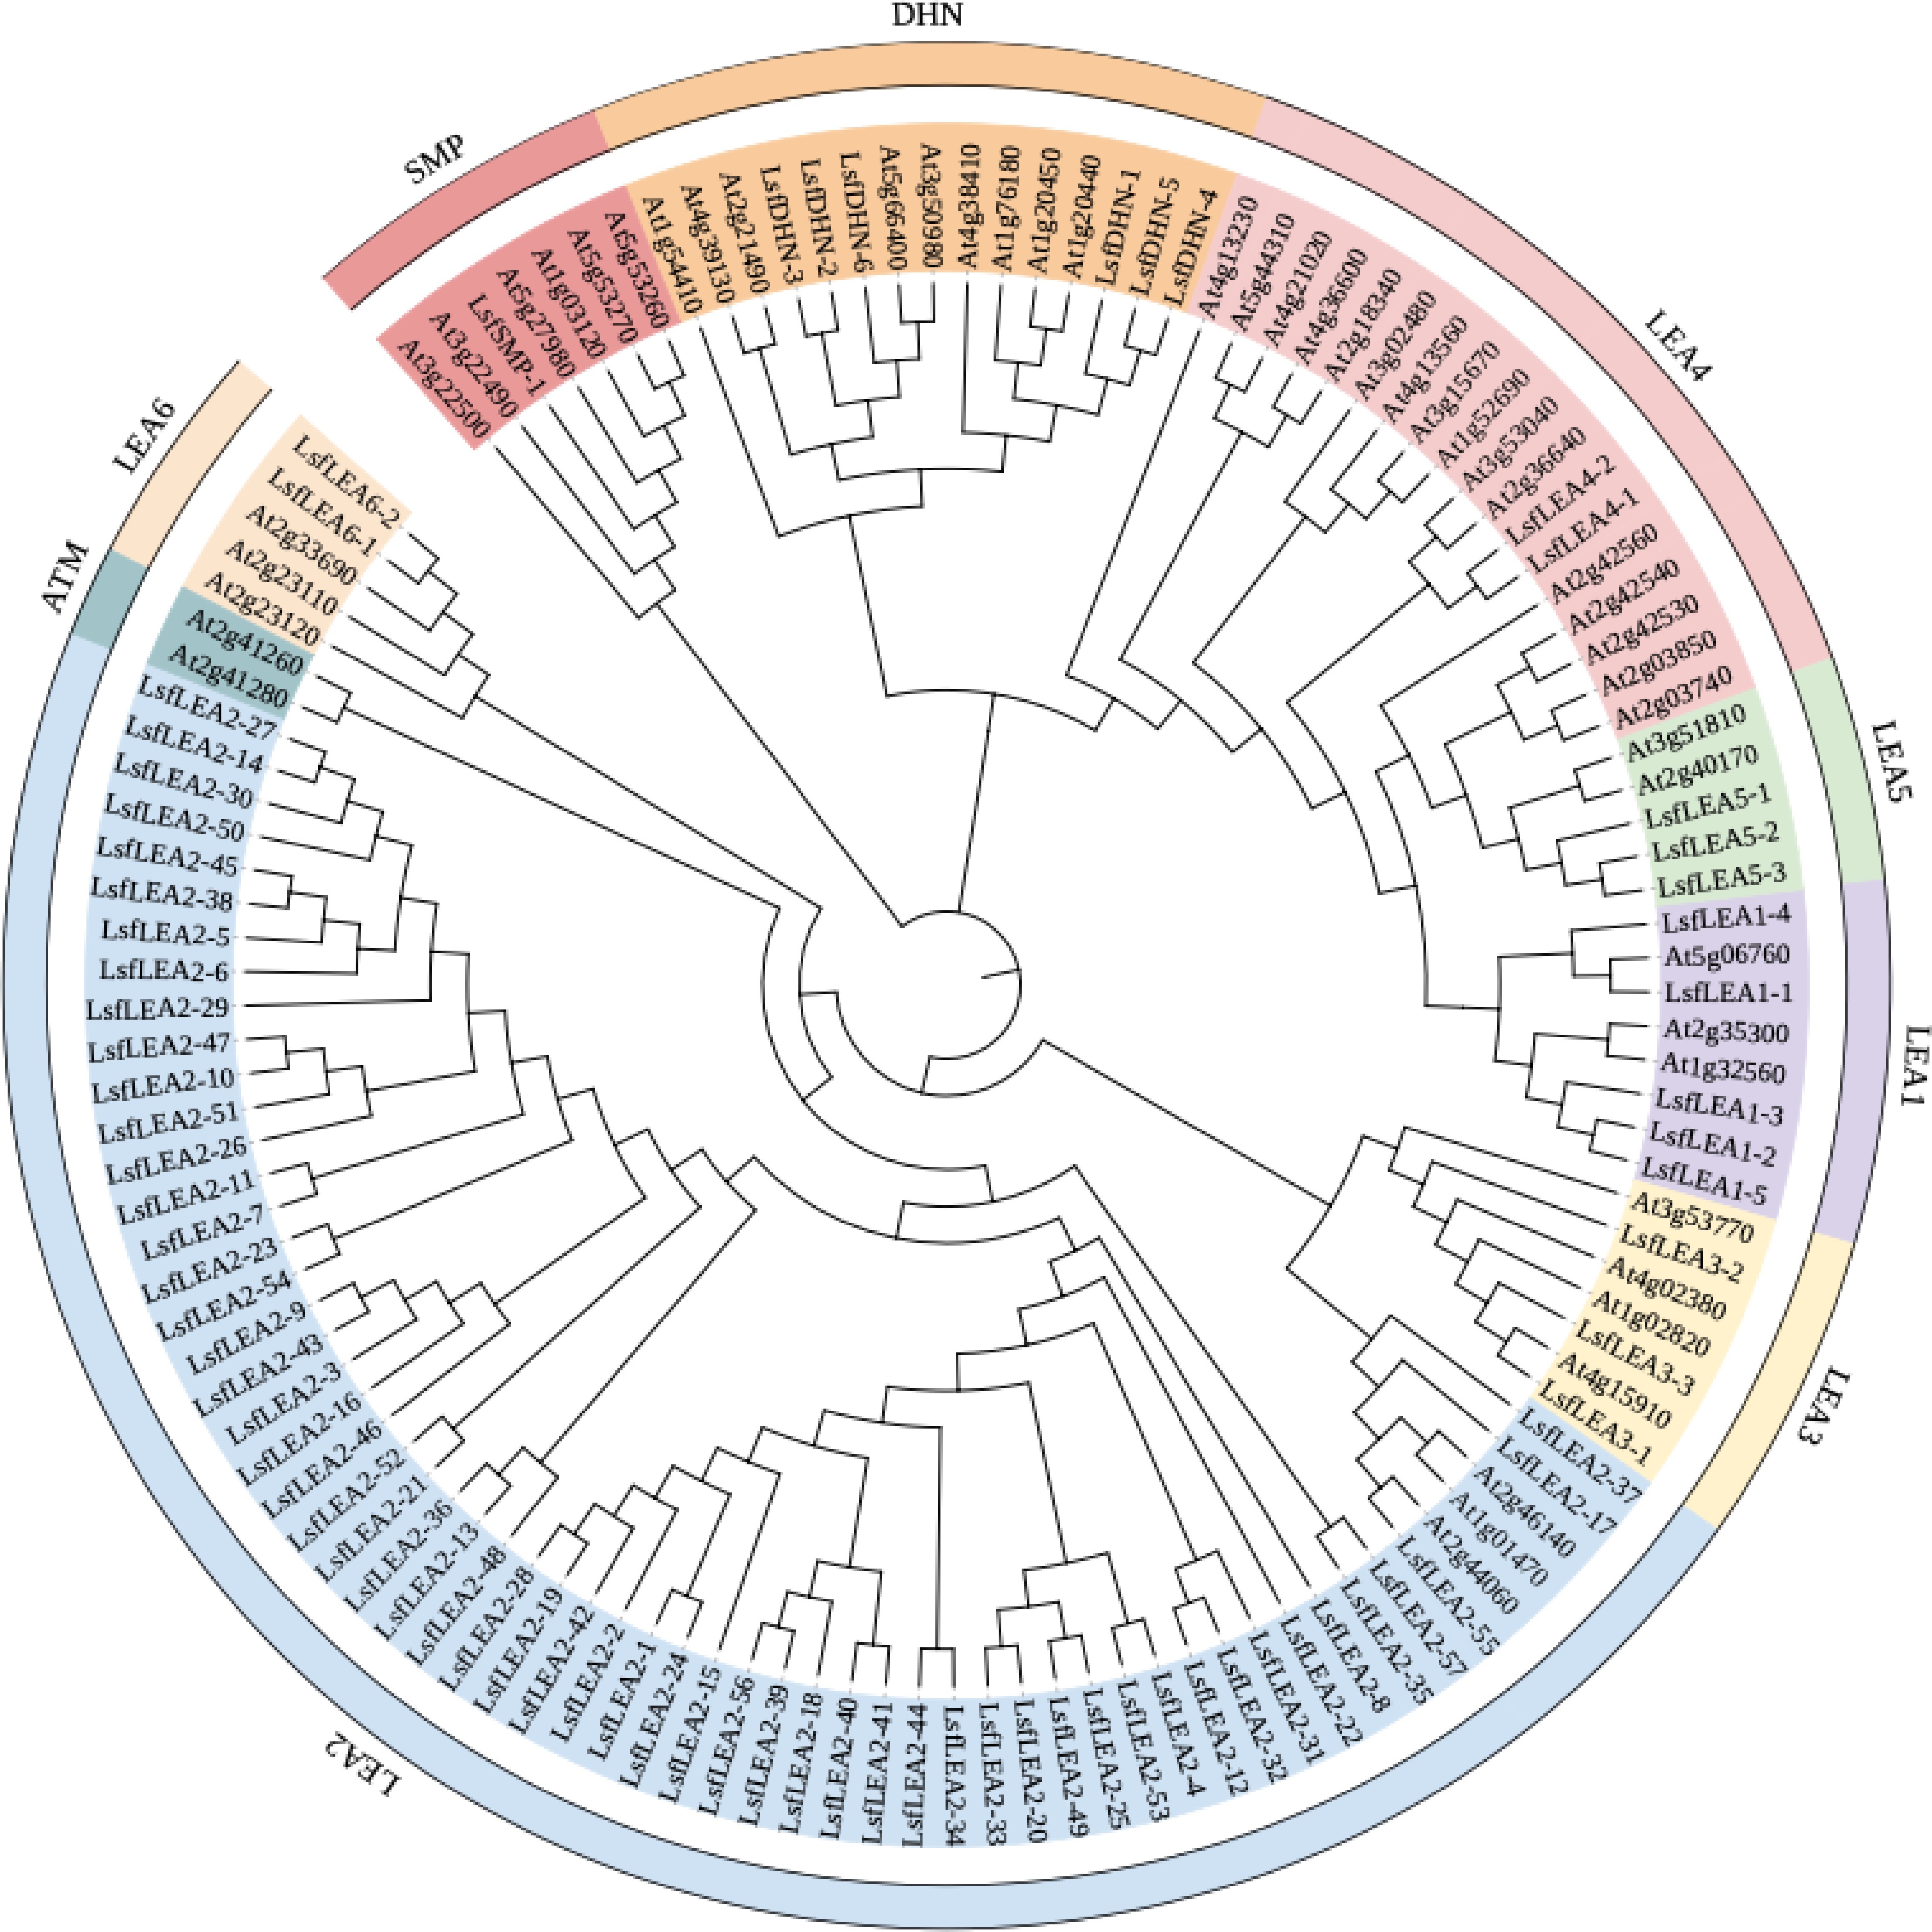
Figure 1.
Maximum likelihood phylogenetic tree of 79 LsfLEA genes and 51 AtLEA genes. The phylogenetic tree was constructed using MEGA 7 software with 1000 bootstrap replicates. We used the online site iTOL for evolutionary tree beautification, and the 9 major groups are marked with different colored backgrounds.
-
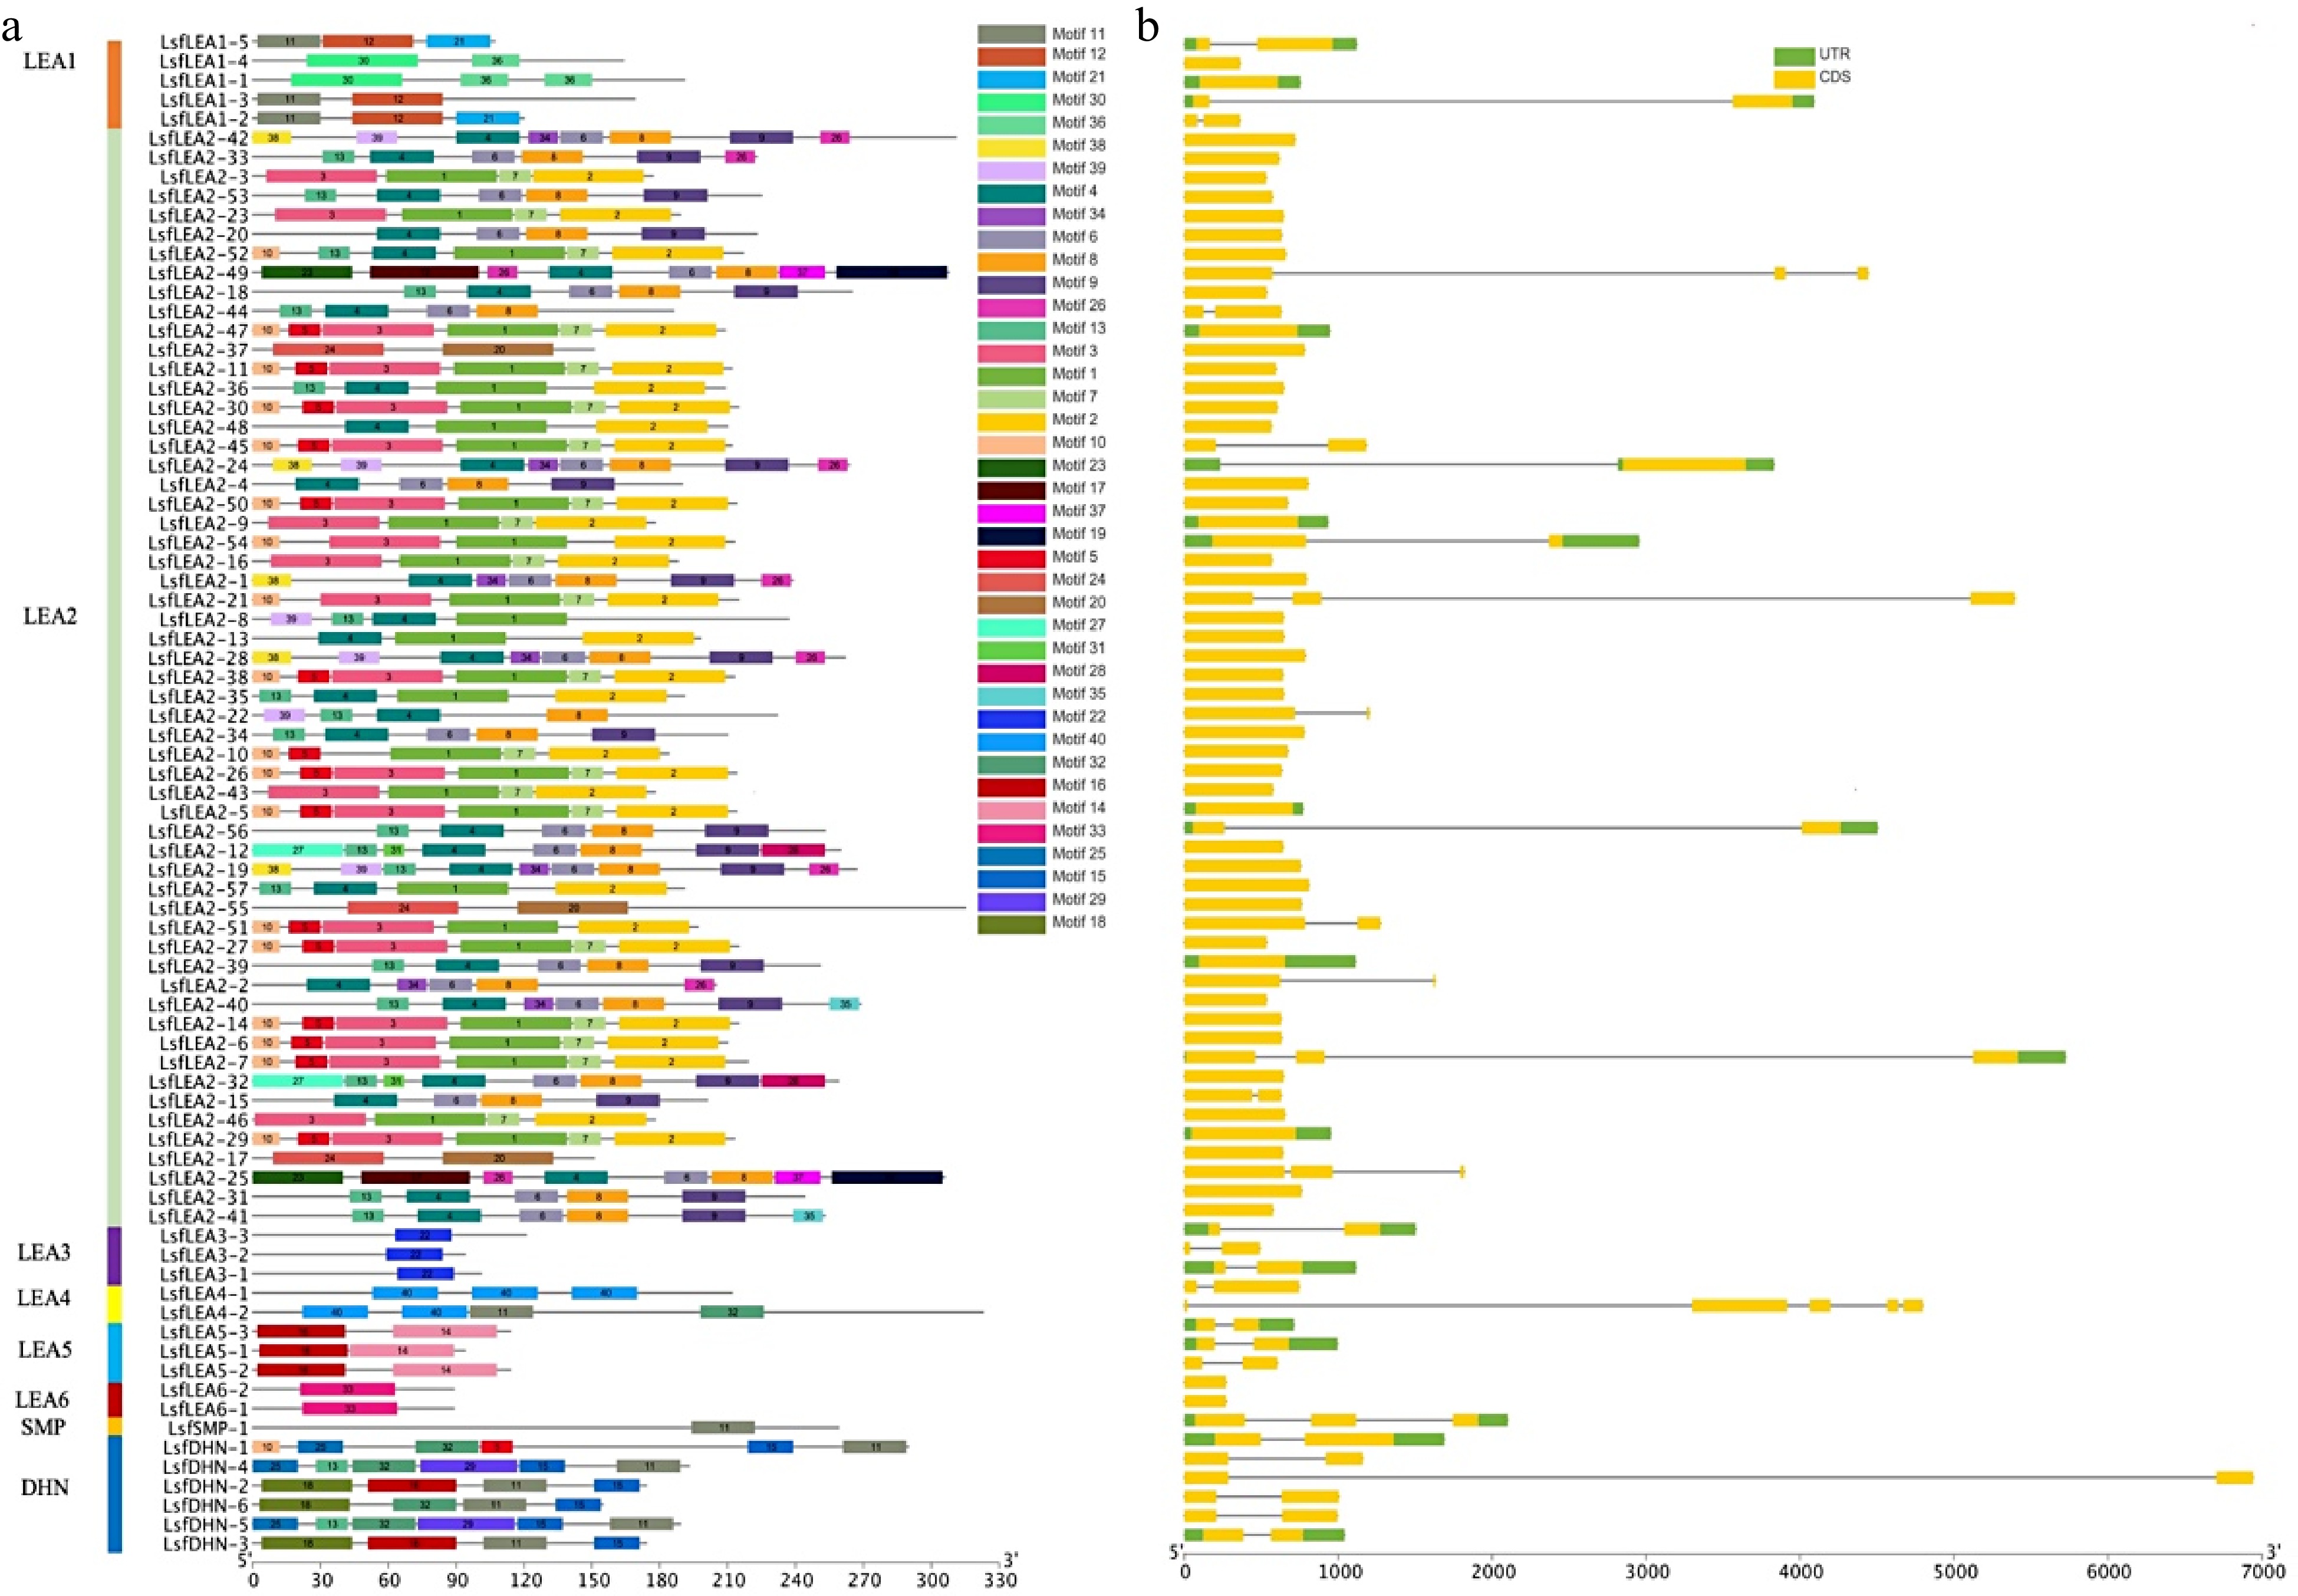
Figure 2.
(a) Motif analysis of LsfLEA genes from hybrid sweetgum. The conserved motifs of each group on the right side were identified by the MEME web server. Different motifs are represented by different colored boxes (b) Gene structure distribution map of LsfLEA.
-
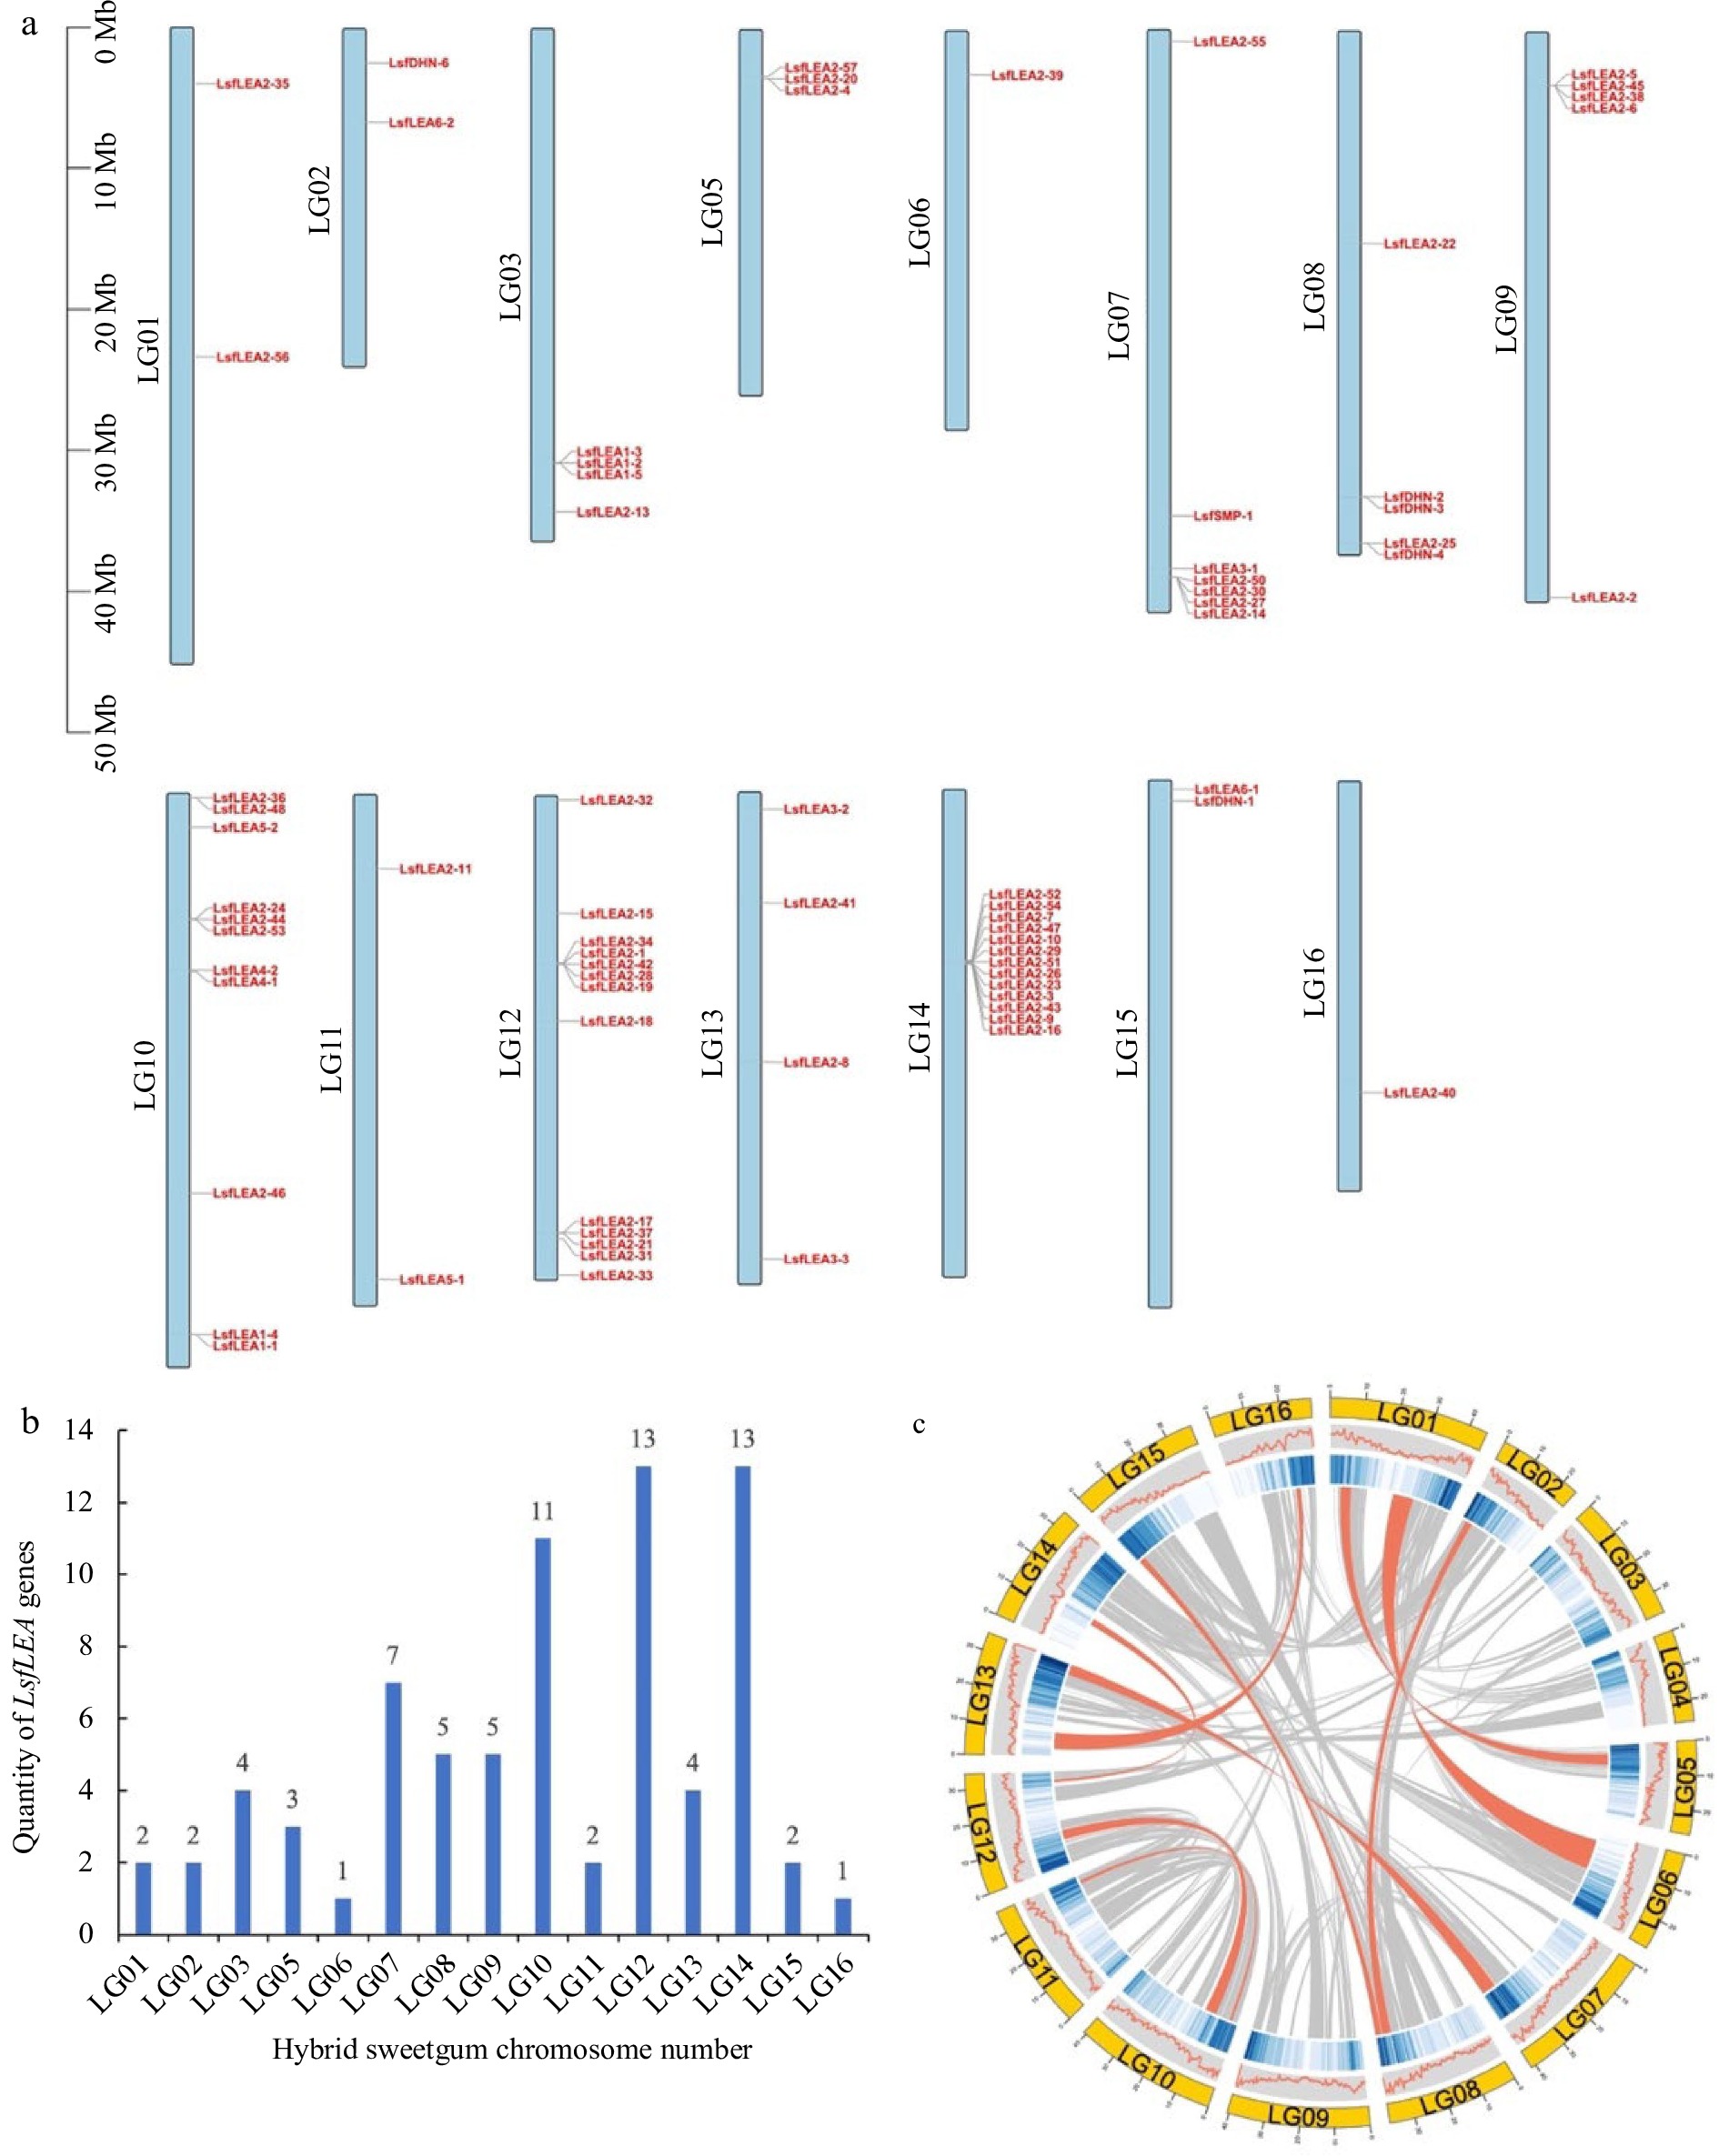
Figure 3.
Chromosomal localization of the LsfLEA genes and gene duplication events. (a) Chromosomal localization of hybrid sweetgum LsfLEA gene. (b) Numbers of LsfLEA genes on each chromosome in hybrid sweetgum. (c) Duplicate pairs of the LsfLEA genes in hybrid sweetgum. The red lines represent collinear pairs of the LsfLEA genes.
-
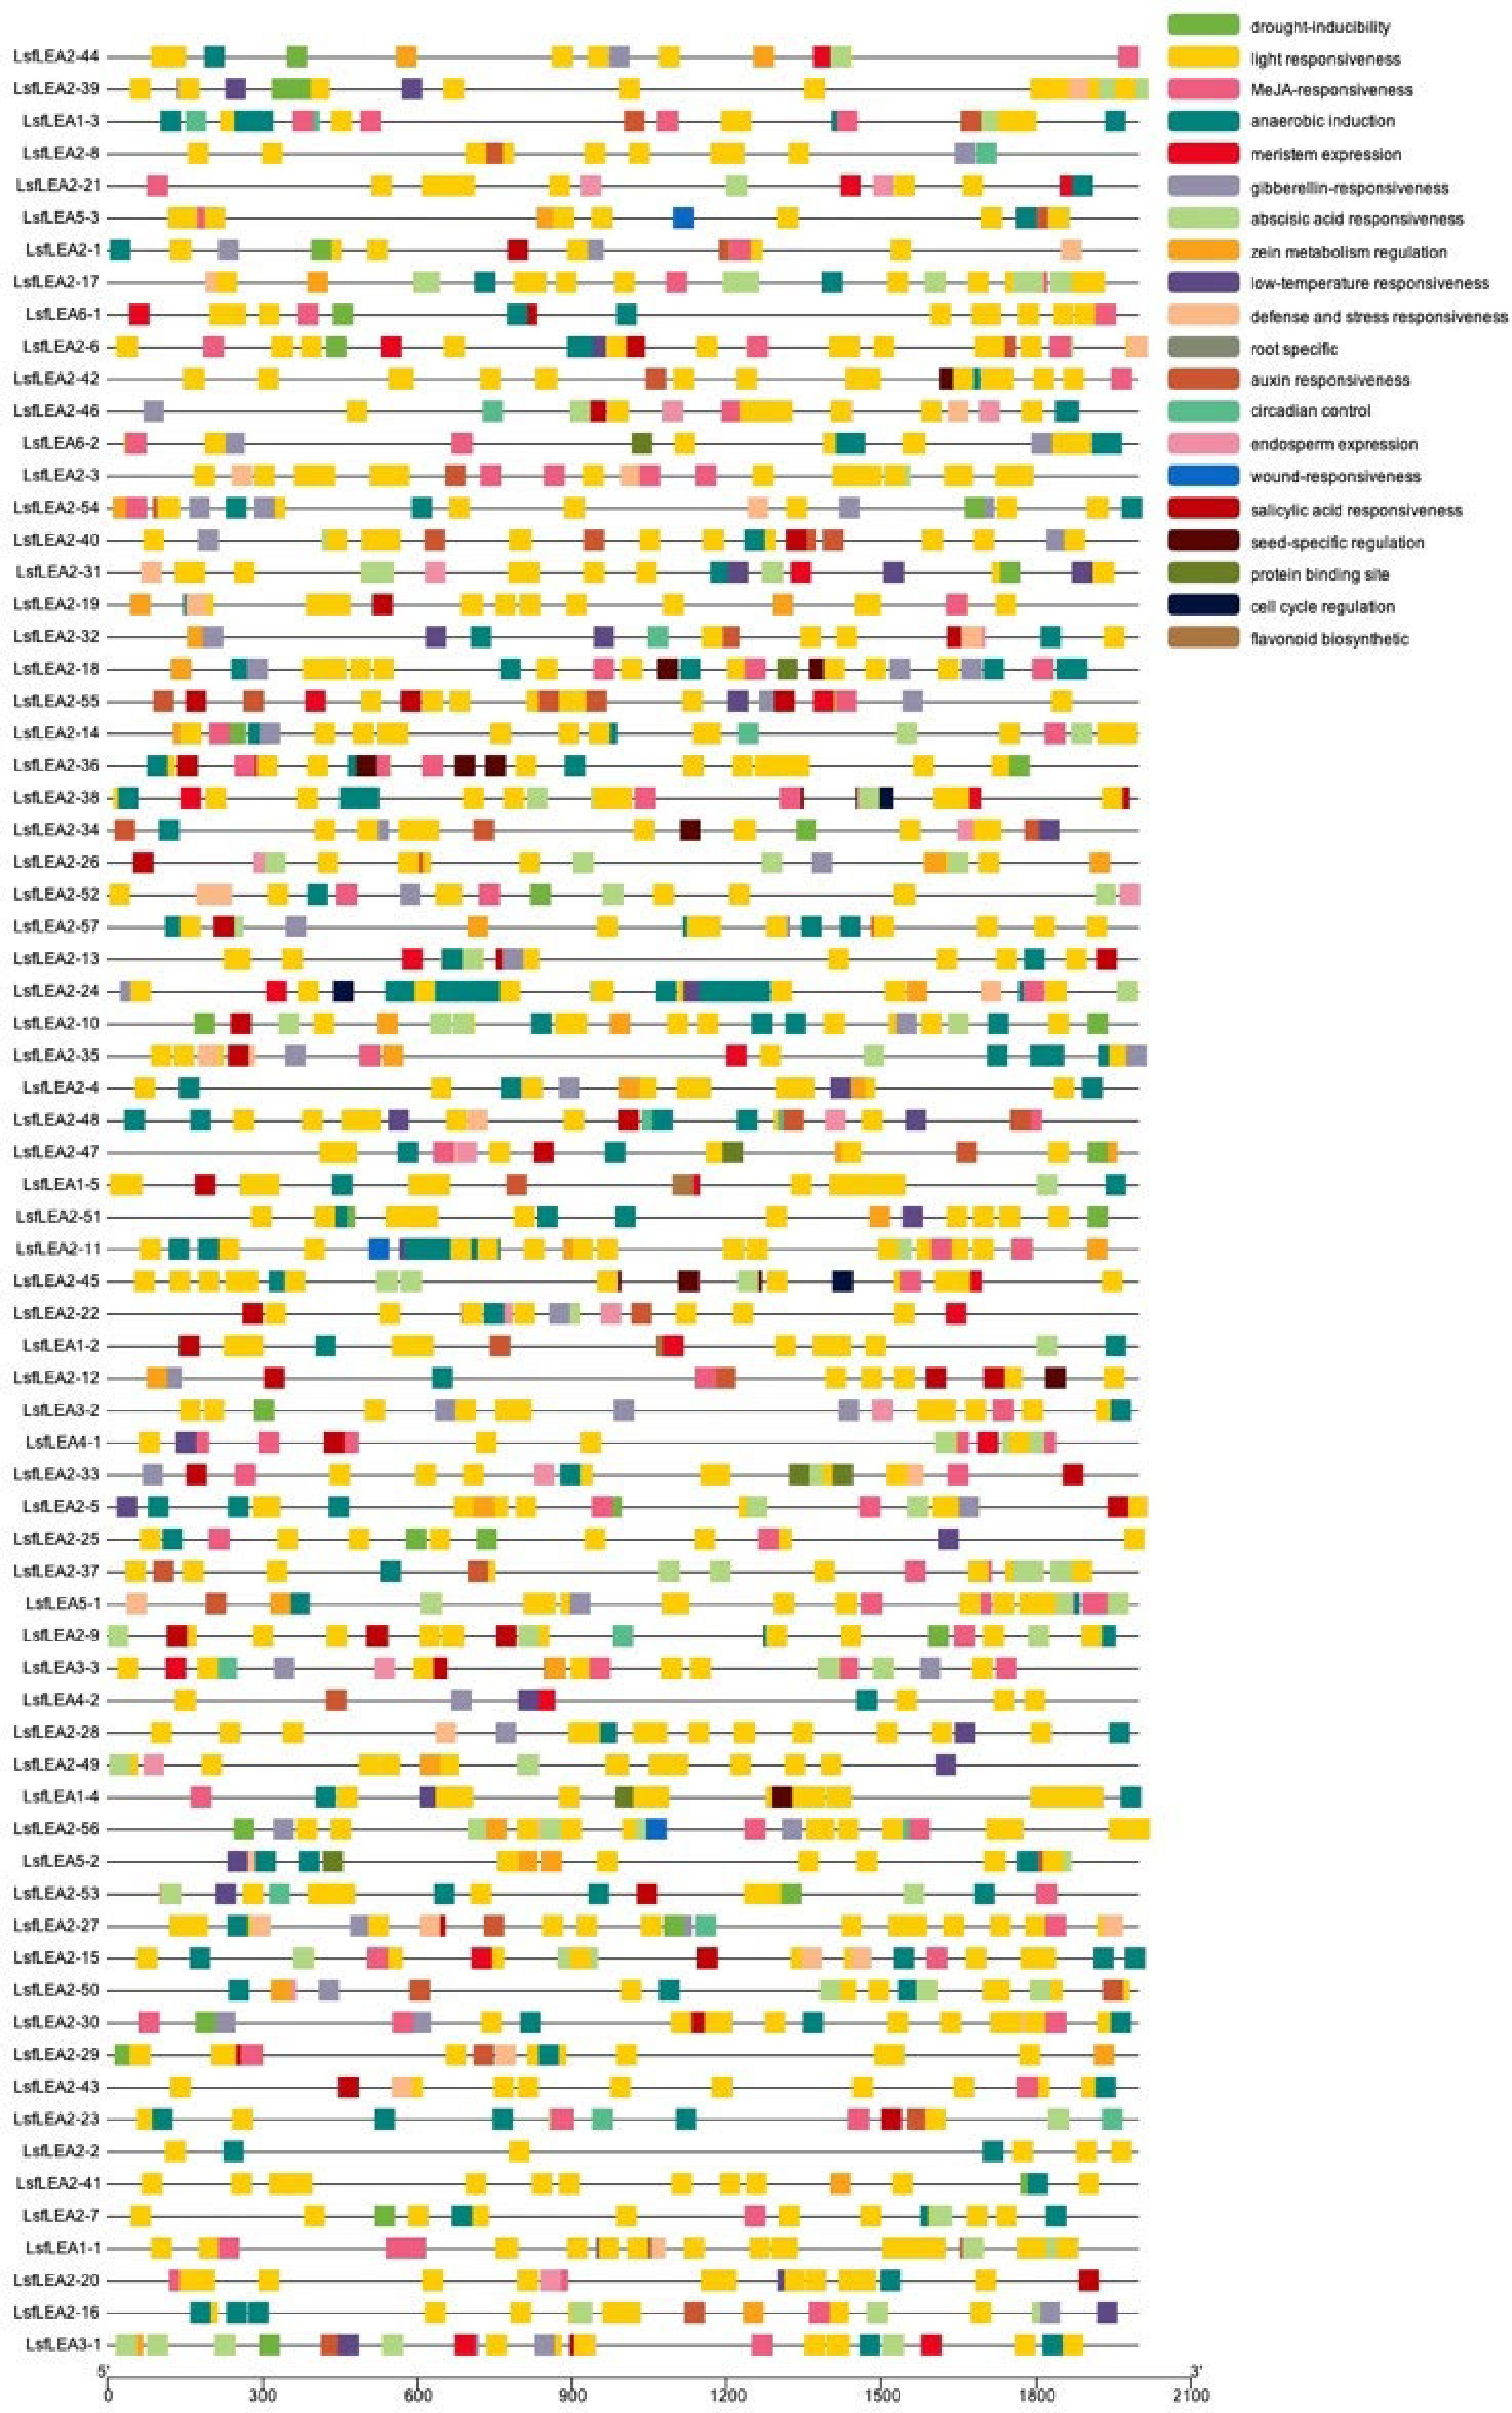
Figure 4.
Cis-acting elements analysis of LsfLEA genes. The patterns in different colors on the right represent different cis-elements.
-
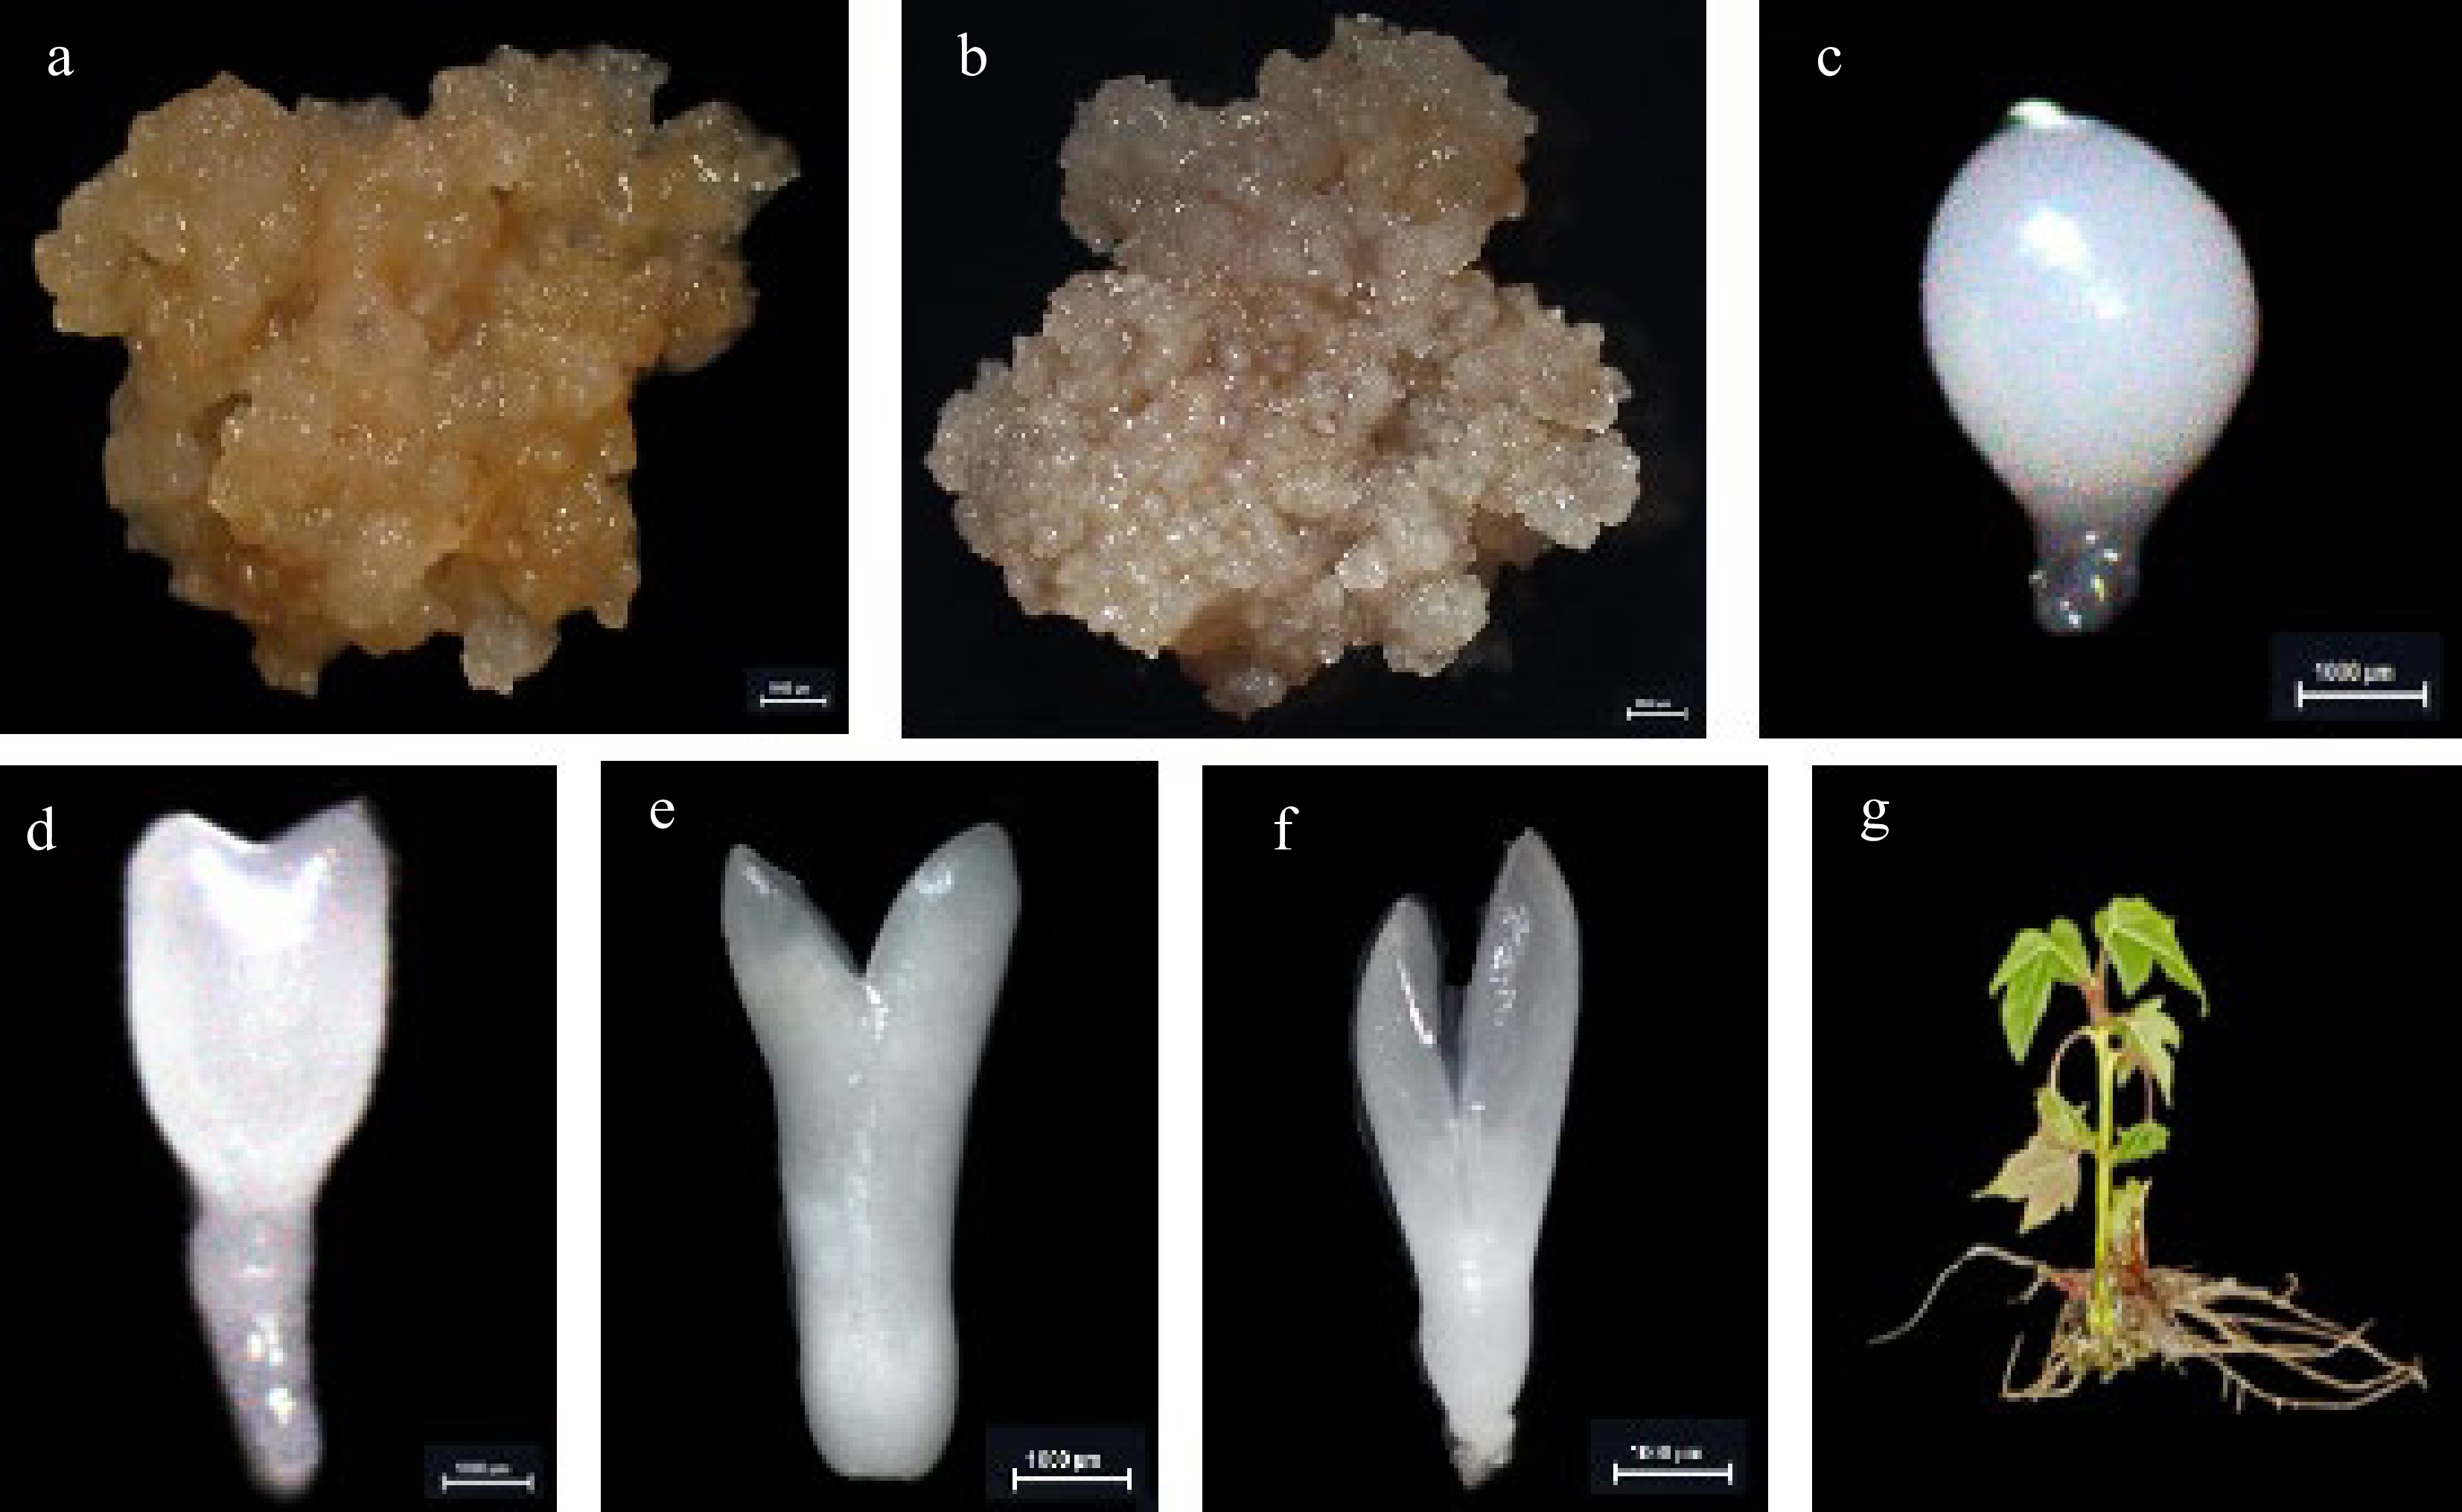
Figure 5.
The cultures during hybrid sweetgum somatic embryogenesis and different tissues. (a) NEC: non-embryogenic callus. (b) EC: friable-embryogenic callus. (c)-(f) Somatic embryos at different developmental stages globular embryo (GE), heart-shaped embryo (HE), torpedo-shaped embryo (TE), cotyledonal embryo (CE). (a)-(f) Bars = 1000 μm. (g) Different tissues in root (R), stem (S), and leaf (L) of hybrid sweetgum.
-
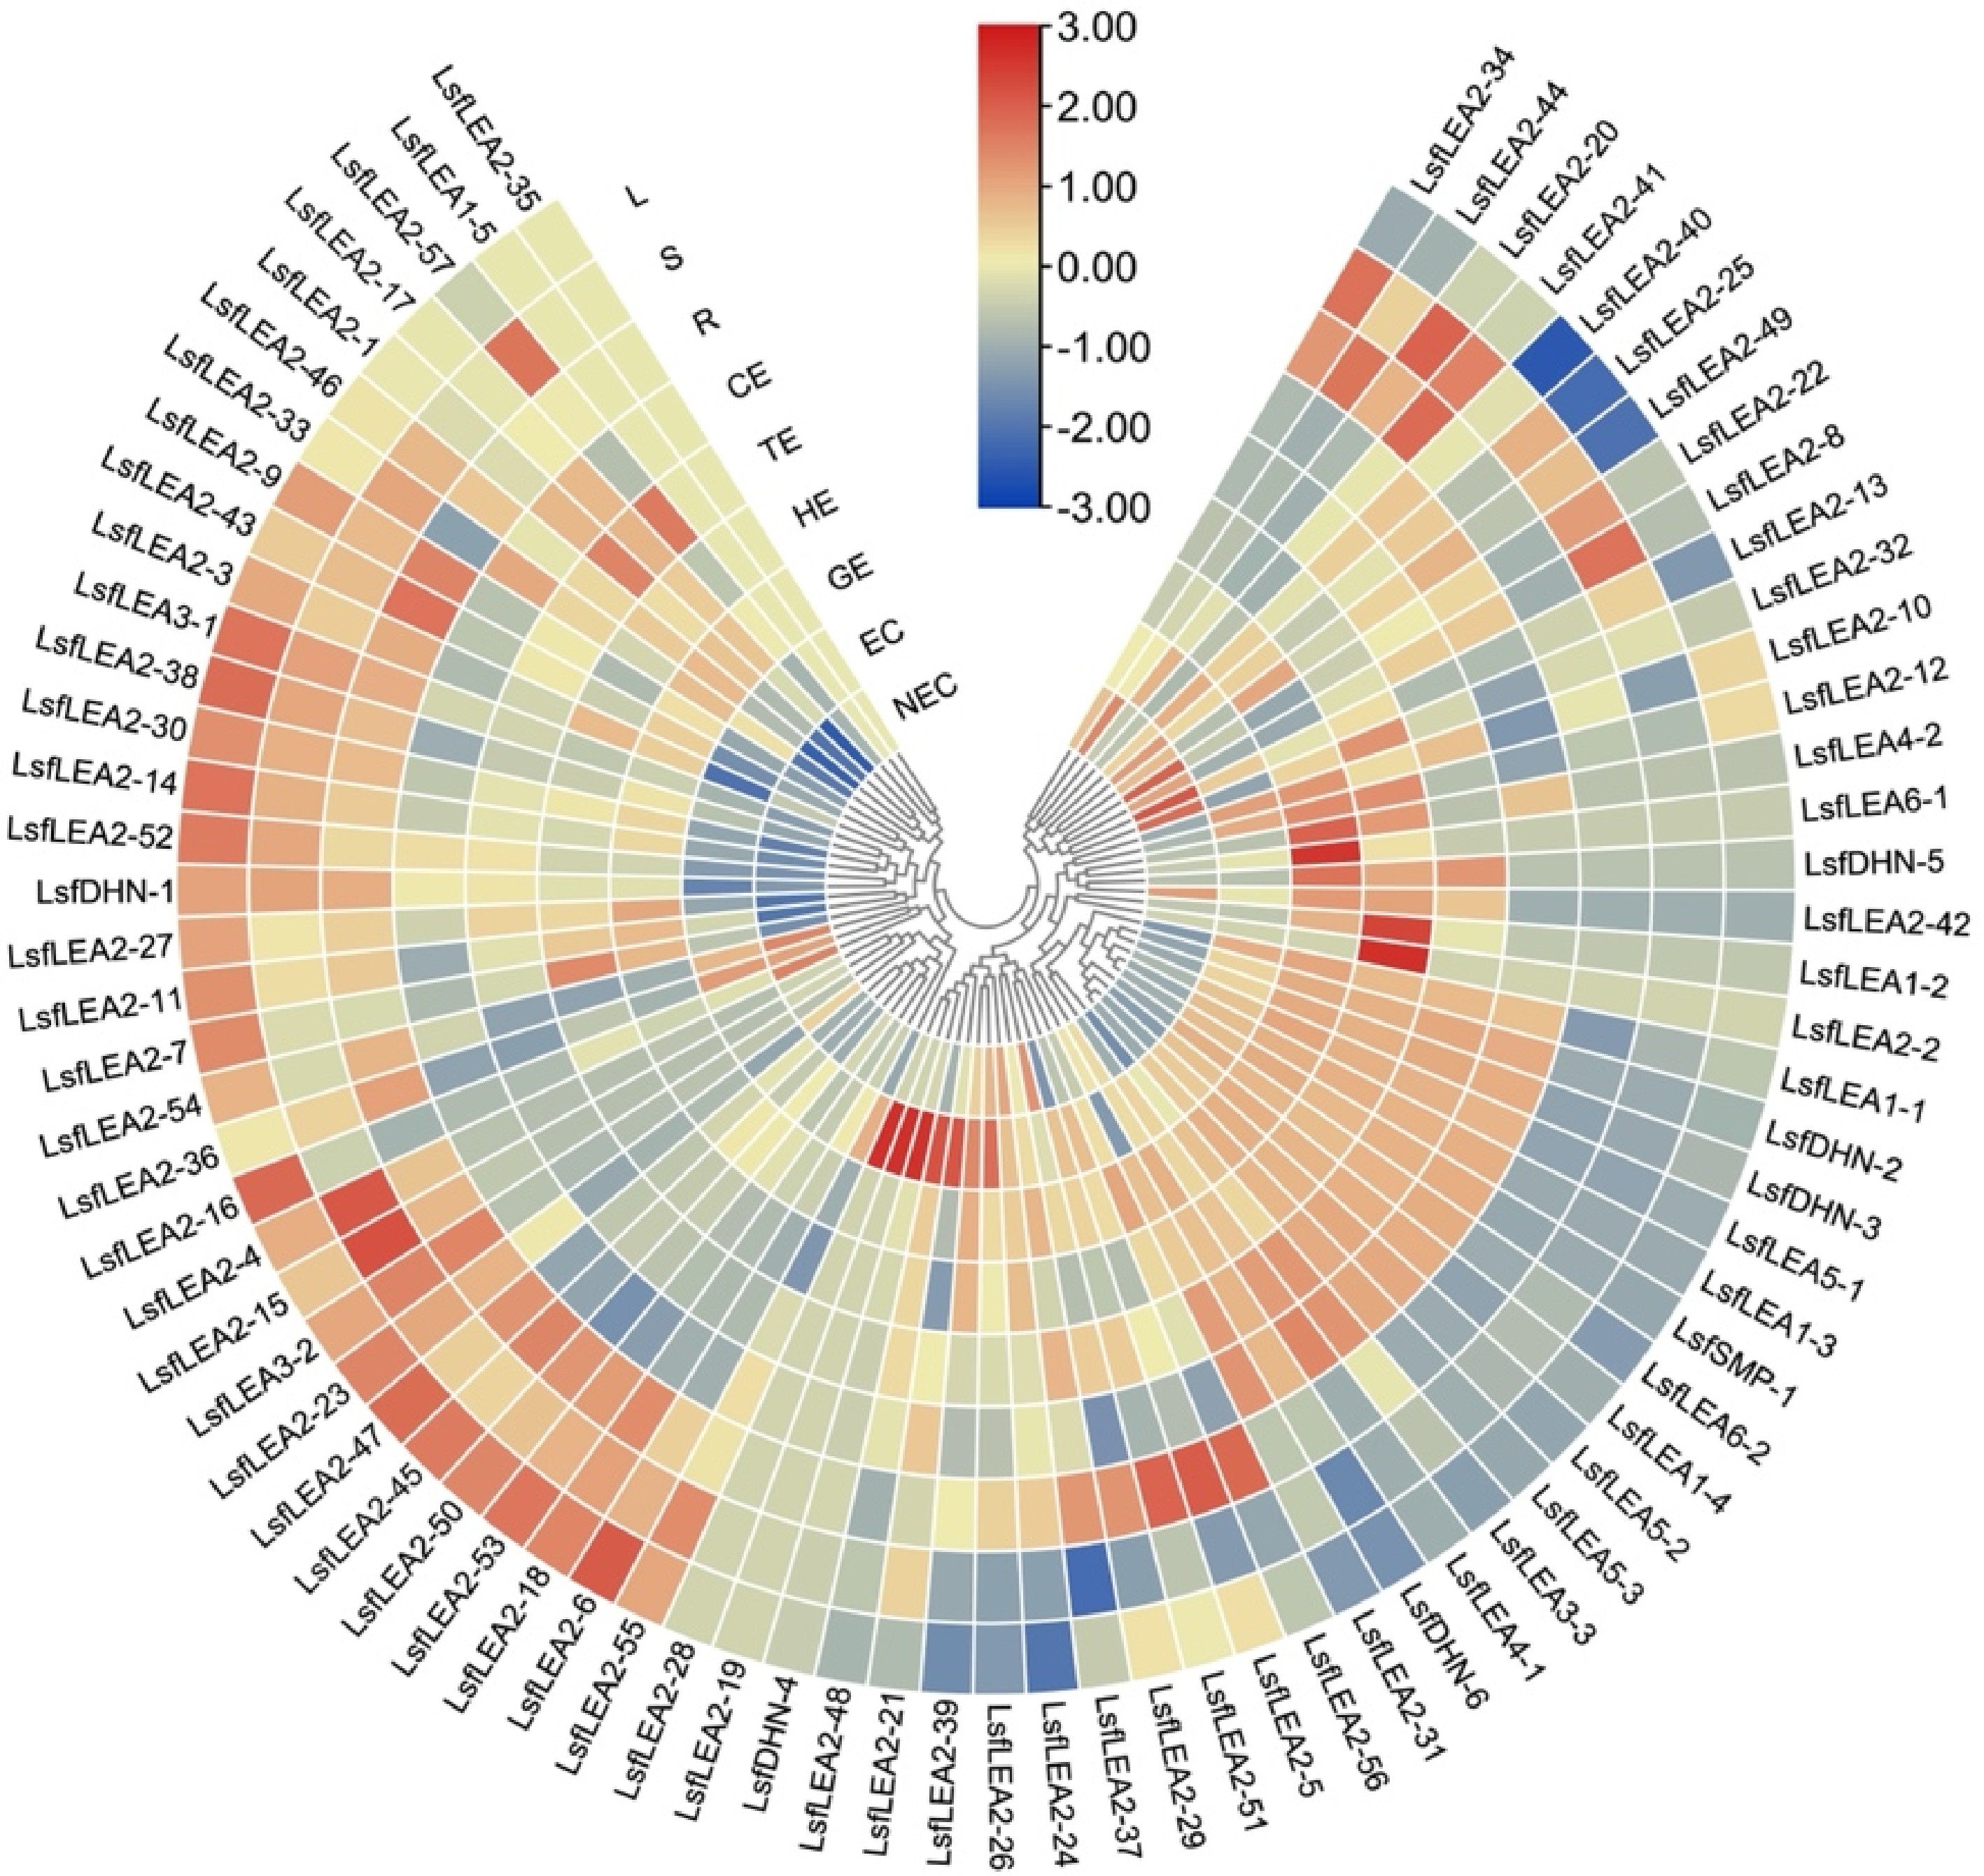
Figure 6.
Heatmap of the differentially expressed 79 LsfLEA genes during hybrid sweetgum SE and different tissues. The heatmap was clustered by TBtools software. The heatmap indicates the gene expression level by Log2[FPKM] with a color scale, each row represents a single gene, the IDs are indicated to the outside of fan, and each circle represents a sample. NEC: non-embryogenic callus; EC: friable-embryogenic callus; GE: globular embryo; HE: heart-shaped embryo; TE: torpedo-shaped embryo; CE: cotyledonal embryo; R: root; S: stem; L: leaf.
-
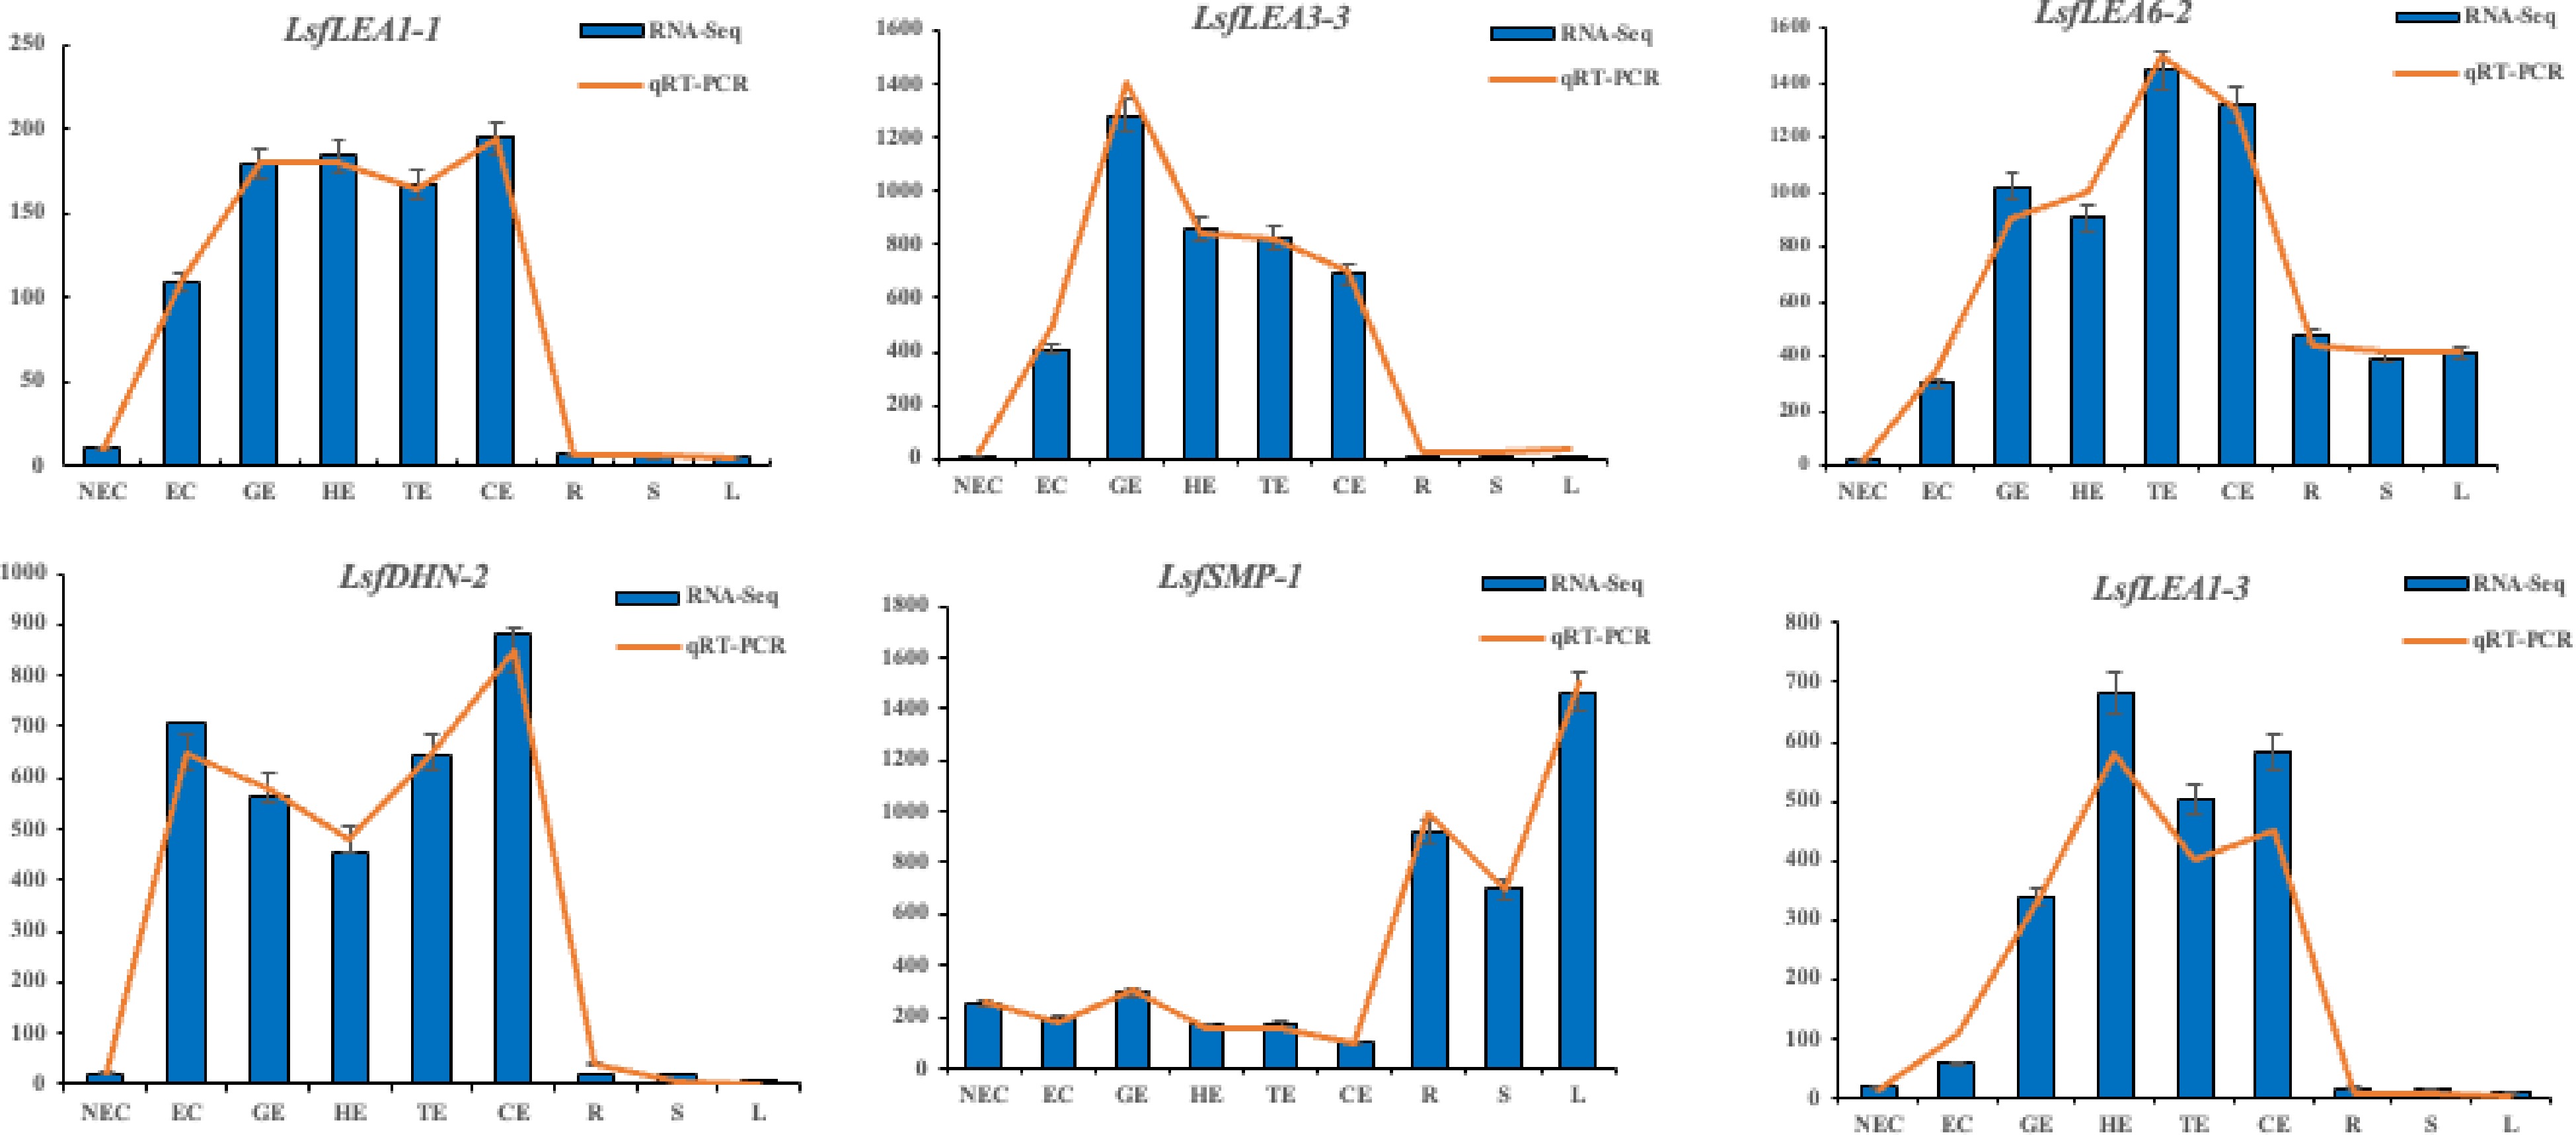
Figure 7.
Transcriptome expression (FPKM value) and qRT-PCR value of six LEA family genes in hybrid sweetgum at different stages during somatic embryogenesis. Relative expression values were calculated using the 2−ΔΔCᴛ method with apple EF1-α as a housekeeping gene. NEC: non-embryogenic callus; EC: friable-embryogenic callus; GE: globular embryo; HE: heart-shaped embryo; TE: torpedo-shaped embryo; CE: cotyledonal embryo; R: root; S: stem; L: leaf.
-
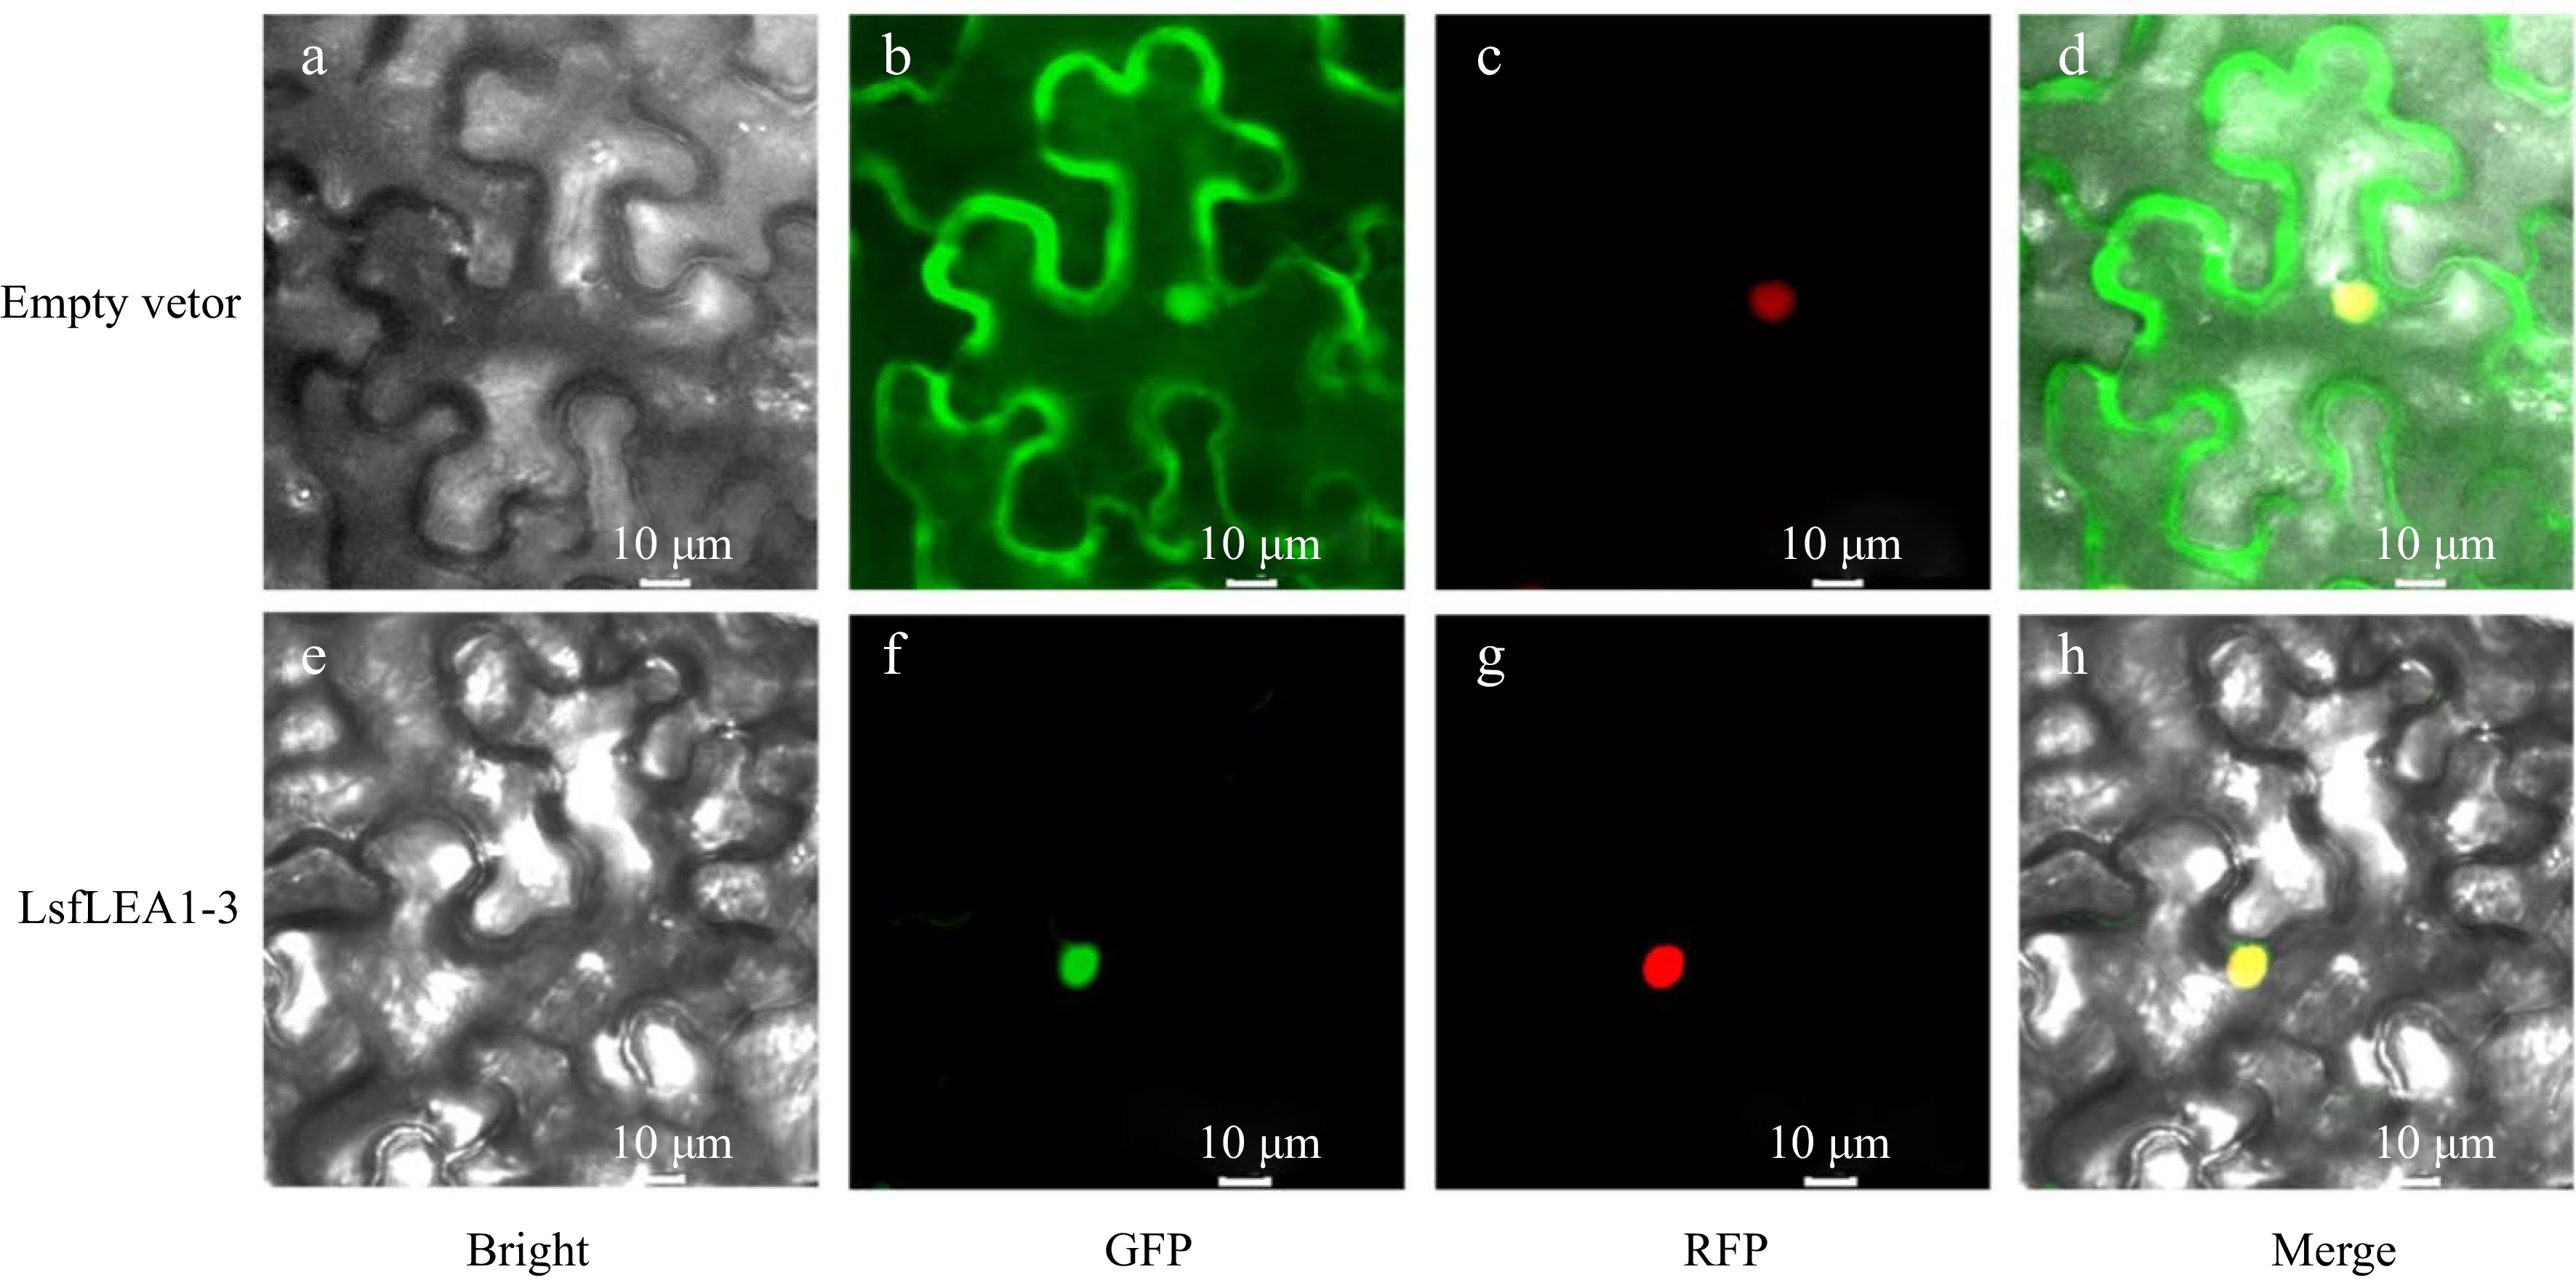
Figure 8.
Subcellular localization of LsfLEA 1-3 protein in N. benthamiana leaves. (a) GFP empty vector in bright field. (b) Empty vector in GFP green fluorescence. (c) Empty vector in RFP red fluorescence. (d) Empty vector in merge. (e) LsfLEA 1-3 protein in bright field. (f) LsfLEA 1-3 protein in GFP green fluorescence. (g) LsfLEA 1-3 protein in RFP red fluorescence. (h) LsfLEA 1-3 protein in merge.
-
Medium Composition Induction/
proliferationBasic medium[37] + 1 mg 2, 4-D + 0.5 mg 6-BA + 40 g/L sucrose + 1 g/L enzymatic hydrolyzed casein 2.6−2.7 g/L vegetable gel, pH adjusted to 5.6~5.7 Mature Basic medium + 40 g/L sucrose + 6 g/L vegetable gel +5% PEG, pH was adjusted to 5.6~5.7 Germination Basic medium + 40 g/L sucrose + 2.6-2.7 g /L vegetable gel, pH was adjusted to 5.6~5.7 Table 1.
Medium used in the experiment.
-
Gene_ name Gene_id Primer sequence LsfLEA1-1 EVM0027957 F: TATTGGGGTGATGACGGTCC
R: TTCCTCTGCGTGGCCATATCLsfLEA3-3 EVM0021267 F: ATACTCGGCGGCATCACAAG
R: ACGTCAATCTCTTCCGCACGLsfLEA6-2 EVM0005932 F: TGGAGGACTACAAGCGTCAAG
R: CACCACCGGAAAGAGTGGGLsfDHN-2 EVM0003818 F: CCAATTGGGTTGGAAACCGTC
R: TCACCGAGCTAGAGCTTGAACLsfLEA1-3 EVM0000925 F: AGGAGAAGTTGAGCGACATGG
R: TTTGCTTGAGCTTCCTTCGCLsfSMP-1 EVM0023588 F: ATCGTGATCTGACCGGCATC
R: CATCAACCACCACCACATGCEF1-r-07041 / F: ACTGCACGGTCATTGATGCT
R: AAAGCATGCTCACGGGTCTGTable 2.
Primer sequence information of qRT-PCR.
-
Name Gene ID Family Pfam ID Length kD pI GRAVY Subcellular localization LsfLEA1-1 EVM0027957 LEA1 PF03760 191 19.36702 6.8 −0.865 Cytoplasm. Nucleus. LsfLEA1-2 EVM0018353 LEA1 PF03760 120 13.7979 9.25 −0.863 Nucleus. LsfLEA1-3 EVM0000925 LEA1 PF03760 169 18.18858 8.77 −0.731 Nucleus. LsfLEA1-4 EVM0022193 LEA1 PF03760 164 16.51795 8.83 −0.946 Cytoplasm. Nucleus. LsfLEA1-5 EVM0016558 LEA1 PF03760 107 12.32725 9.33 −0.769 Nucleus. LsfLEA2-1 EVM0002770 LEA2 PF03168 239 26.42419 10 −0.094 Cell membrane. Cell wall. LsfLEA2-2 EVM0027034 LEA2 PF03168 205 22.97259 9.84 −0.017 Chloroplast. LsfLEA2-3 EVM0005964 LEA2 PF03168 177 19.27253 10.27 0.042 Chloroplast. LsfLEA2-4 EVM0015809 LEA2 PF03168 190 21.8101 10.03 −0.482 Chloroplast. LsfLEA2-5 EVM0019694 LEA2 PF03168 214 23.44119 9.91 −0.121 Cell membrane. Nucleus. LsfLEA2-6 EVM0004956 LEA2 PF03168 210 23.12978 9.97 −0.186 Chloroplast. LsfLEA2-7 EVM0027836 LEA2 PF03168 219 24.18402 9.73 −0.195 Chloroplast. LsfLEA2-8 EVM0001803 LEA2 PF03168 237 27.18655 9.15 −0.103 Chloroplast. LsfLEA2-9 EVM0020637 LEA2 PF03168 178 19.33671 10.25 0.086 Chloroplast. LsfLEA2-10 EVM0015055 LEA2 PF03168 184 19.86985 9.92 −0.223 Chloroplast. Nucleus. LsfLEA2-11 EVM0017871 LEA2 PF03168 212 23.53223 10 −0.157 Chloroplast. Nucleus. LsfLEA2-12 EVM0018801 LEA2 PF03168 260 28.41312 9.01 0.133 Chloroplast. LsfLEA2-13 EVM0013310 LEA2 PF03168 198 21.34478 9.37 0.407 Cell membrane. LsfLEA2-14 EVM0010683 LEA2 PF03168 215 23.44427 9.88 −0.083 Cell membrane. Nucleus. LsfLEA2-15 EVM0023593 LEA2 PF03168 201 22.72988 10.05 0.109 Chloroplast. Nucleus. LsfLEA2-16 EVM0028234 LEA2 PF03168 188 20.34671 10.27 −0.001 Chloroplast. LsfLEA2-17 EVM0003550 LEA2 PF03168 151 16.49626 5.58 0.077 Chloroplast. Nucleus LsfLEA2-18 EVM0008005 LEA2 PF03168 265 29.16785 9.35 −0.066 Chloroplast. LsfLEA2-19 EVM0007435 LEA2 PF03168 267 29.08778 8.38 −0.215 Cell membrane. Cell wall. Nucleus. LsfLEA2-20 EVM0028118 LEA2 PF03168 223 25.25915 10.05 −0.122 Chloroplast. Mitochondrion. LsfLEA2-21 EVM0001898 LEA2 PF03168 215 23.68493 10.14 −0.021 Nucleus. LsfLEA2-22 EVM0018273 LEA2 PF03168 232 24.94073 9.3 0.113 Cell membrane. Chloroplast. LsfLEA2-23 EVM0025800 LEA2 PF03168 189 20.97945 10.01 −0.074 Chloroplast. Nucleus. Peroxisome. LsfLEA2-24 EVM0013583 LEA2 PF03168 264 29.43273 8.93 −0.048 Cell wall. Nucleus. LsfLEA2-25 EVM0020355 LEA2 PF03168 306 34.40006 9.47 −0.383 Cell membrane. Chloroplast. LsfLEA2-26 EVM0011840 LEA2 PF03168 214 23.38122 10.14 −0.056 Chloroplast. LsfLEA2-27 EVM0023465 LEA2 PF03168 215 23.46828 9.91 −0.064 Cell membrane. Nucleus. LsfLEA2-28 EVM0021483 LEA2 PF03168 262 29.00554 6.51 −0.288 Cell wall. LsfLEA2-29 EVM0024390 LEA2 PF03168 213 23.36631 9.94 −0.035 Nucleus. LsfLEA2-30 EVM0024154 LEA2 PF03168 215 23.32817 9.88 −0.031 Chloroplast. LsfLEA2-31 EVM0007128 LEA2 PF03168 244 27.2663 10.2 −0.063 Chloroplast. LsfLEA2-32 EVM0007725 LEA2 PF03168 259 28.26897 9.17 0.09 Chloroplast. LsfLEA2-33 EVM0019270 LEA2 PF03168 223 24.39271 9.61 0.041 Cell wall. Chloroplast. LsfLEA2-34 EVM0011791 LEA2 PF03168 210 23.90993 9.78 0.129 Cell membrane. Chloroplast. LsfLEA2-35 EVM0015677 LEA2 PF03168 191 20.8606 9.28 0.33 Chloroplast. LsfLEA2-36 EVM0011399 LEA2 PF03168 209 22.83086 9.98 0.197 Chloroplast. LsfLEA2-37 EVM0020583 LEA2 PF03168 151 16.45712 5.04 0.054 Cell membrane. Nucleus. LsfLEA2-38 EVM0011512 LEA2 PF03168 213 23.27806 9.97 −0.17 Chloroplast. Nucleus LsfLEA2-39 EVM0000290 LEA2 PF03168 251 28.02687 9.56 −0.076 Chloroplast. LsfLEA2-40 EVM0006920 LEA2 PF03168 269 29.83144 10.03 −0.246 Nucleus. LsfLEA2-41 EVM0027367 LEA2 PF03168 253 27.51712 10.3 −0.089 Cell membrane. Cell wall. LsfLEA2-42 EVM0005315 LEA2 PF03168 311 34.5181 9.07 −0.186 Cell wall. Nucleus. LsfLEA2-43 EVM0025389 LEA2 PF03168 178 19.27267 10.25 0.108 Chloroplast. LsfLEA2-44 EVM0000222 LEA2 PF03168 186 21.21822 7.87 −0.163 Cell membrane. Chloroplast. LsfLEA2-45 EVM0018178 LEA2 PF03168 212 23.1178 9.91 −0.134 Cell membrane. Cell wall. LsfLEA2-46 EVM0005757 LEA2 PF03168 178 19.26954 10.06 0.087 Chloroplast. LsfLEA2-47 EVM0016553 LEA2 PF03168 209 22.80349 10.14 −0.098 Chloroplast. LsfLEA2-48 EVM0016432 LEA2 PF03168 210 23.00723 9.83 0.226 Mitochondrion. Nucleus. LsfLEA2-49 EVM0021824 LEA2 PF03168 308 34.60045 9.64 −0.337 Cell membrane. Chloroplast. LsfLEA2-50 EVM0023803 LEA2 PF03168 214 23.29603 9.88 −0.102 Cell membrane. Cell wall. LsfLEA2-51 EVM0017004 LEA2 PF03168 197 21.68226 10.22 −0.131 Chloroplast. LsfLEA2-52 EVM0012352 LEA2 PF03168 217 24.03337 10.21 0.105 Chloroplast. LsfLEA2-53 EVM0023248 LEA2 PF03168 225 24.9939 9.55 −0.009 Cell membrane. Chloroplast. LsfLEA2-54 EVM0006284 LEA2 PF03168 213 23.40402 9.56 −0.175 Chloroplast. Cytoplasm. Nucleus. LsfLEA2-55 EVM0008344 LEA2 PF03168 315 34.64837 4.75 −0.403 Nucleus. LsfLEA2-56 EVM0022790 LEA2 PF03168 253 28.07601 10.17 −0.1 Cell membrane. Cell wall. LsfLEA2-57 EVM0012837 LEA2 PF03168 191 21.15586 9.58 0.26 Chloroplast. LsfLEA3-1 EVM0028438 LEA3 PF03242 101 10.79223 9.88 −0.222 Chloroplast. Nucleus. LsfLEA3-2 EVM0019119 LEA3 PF03242 94 10.47005 9.37 −0.418 Chloroplast. LsfLEA3-3 EVM0021267 LEA3 PF03242 121 13.48961 10.28 −0.668 Chloroplast. LsfLEA4-1 EVM0019164 LEA4 PF02987 212 23.759 5.42 −1.533 Nucleus. LsfLEA4-2 EVM0021387 LEA4 PF02987 323 36.9282 9.53 −1.53 Nucleus. LsfLEA5-1 EVM0020631 LEA5 PF00477 94 9.93673 5.48 −1.26 Nucleus. LsfLEA5-2 EVM0022920 LEA5 PF00477 114 12.14812 5.53 −1.278 Nucleus. LsfLEA5-3 EVM0002005 LEA5 PF00477 114 12.07605 5.91 −1.251 Nucleus. LsfLEA6-1 EVM0004641 LEA6 PF10714 89 9.40021 4.75 −0.939 Nucleus. LsfLEA6-2 EVM0005932 LEA6 PF10714 89 9.37028 5.77 −1 Nucleus. LsfSMP-1 EVM0023588 SMP PF04927 259 26.66671 4.66 −0.253 Nucleus. LsfDHN-1 EVM0028566 Dehydrin PF00257 290 32.91761 5.23 −1.388 Nucleus. LsfDHN-2 EVM0003818 Dehydrin PF00257 174 18.52736 8.01 −1.126 Cytoplasm. LsfDHN-3 EVM0011412 Dehydrin PF00257 174 18.62131 9.45 −1.31 Cytoplasm. LsfDHN-4 EVM0018312 Dehydrin PF00257 193 21.77947 5.56 −1.388 Nucleus. LsfDHN-5 EVM0008852 Dehydrin PF00257 1891 21.36301 5.46 −1.348 Nucleus. LsfDHN-6 EVM0003289 Dehydrin PF00257 155 16.54385 9.1 −1.369 Cytoplasm. Table 3.
The characteristics of LsfLEA genes.
-
Motif number Motif sequences 1 NTRFVAQVTVKNTNFGPYKFDNTTATFTYGGMTVGZVVIPKGKAGARSTK 2 SDISSGILKLSSQAKLSGKVELMFVMKKKKSAEMNCTLTFBLSAKALQAL 3 RRIKIAAYIVAFVVFQSIIIAIFAVTVMKYRTPKFRLGKVTVETLTSTPA 4 VVALJLWLVFRPKRPKFTVNSVSVSSFNL 5 DEESATLQSKEFRRK 6 RNPNKKJSIYYDSIEASVYY 7 KIBVTVDLNSDALTS 8 QQILSSGSLPPFYQGRKNTTVLSTTLAG 9 FBVKVDARVRFKVGRWKTKRVGVRVSCDG 10 MAEKNQQVYPAAP 11 SAAEKKKGMKEKIKEKLPGYKAKAEEEKE 12 HEGRKAKEAQAKMEMHEAKARHAEEKLNAKQSHLYGHQVHE 13 PKRERRRGCCCCGCL 14 KGGQTRKEQLGTEGYQEMGRKGGLSTTDQSGGERAAELGVDIDESKF 15 HHPEEKKGILEKIKEKLPGQH 16 GNREQREELEARARQGETVVPGGTGGGSLEAQEHLAEGRS 17 PHHYHCSPIHHSRESSTSRFSASLKNAHHHKHSAPWKKMHRVVDVDDDD 18 RDEYGNPIQLTDERGNPVQLTDEYGNPMHLSGVATTHGTTA 19 LNLTFVMRSRAYILGKLVKSKFYKRIRCSVTLRGNQLGKLQNLTDSCIYQ 20 NDITMLDVGLKVPHNVLVTLVKDIGADWDIDYELEVGLTIDLPIIGNFTI 21 HIIGTMNQWWVSMDTMGRSLLELRPLYLY 22 WVPDPVTGYYRPENRAGEIDVAELRD 23 MHAKSDSEVTSLDASSPPRSPRRPLYYVQSPSQHDVEKMSY 24 NFMVEKVANIKKPEASVEDVDLKDVSRECIDYNAKVAVKNPYGHALPICE 25 MADQHFQCHEKEPRDRGMFDF 26 GTMVGGPRECKVRL 27 MADSAIRKTEDSPPSSKPSPNPTSKPVRHVVFSEIPCRPHK 28 IQQSQVDIGQEPKCSVKMFSFRLHTFLFI 29 EGGEEKKKKKGLKEKIKEKMACQGEEEVTEIPVDKCDNIVDAET 30 GMDKTKATMQZKVEKMTARDPIZKEMATZKKEAKKTEAELNKQEAREHNA 31 CCAWGCMIGF 32 EPQEKKEVEKPTLVEELRRSGSSSSSSSD 33 GLPLESSPYVKNSDLEDYKRKGYGTEGHLDPKPGRGAGGTDAP 34 SSQITGNWNVSFYV 35 CKVDLRIKIWKWTF 36 GHPTGGHQMSAMPGEGTWQPTW 37 YQVPLYGGVSVLGGARNHYEN 38 MEDQKKPVIGYPVQFYHP 39 NTAAAHVVQPPPVVHHQQQ 40 GKVGEYKDYAAEKAKETKDSALEKAREYKD Table 4.
The motif sequences of LsfLEA genes.
Figures
(8)
Tables
(4)