-
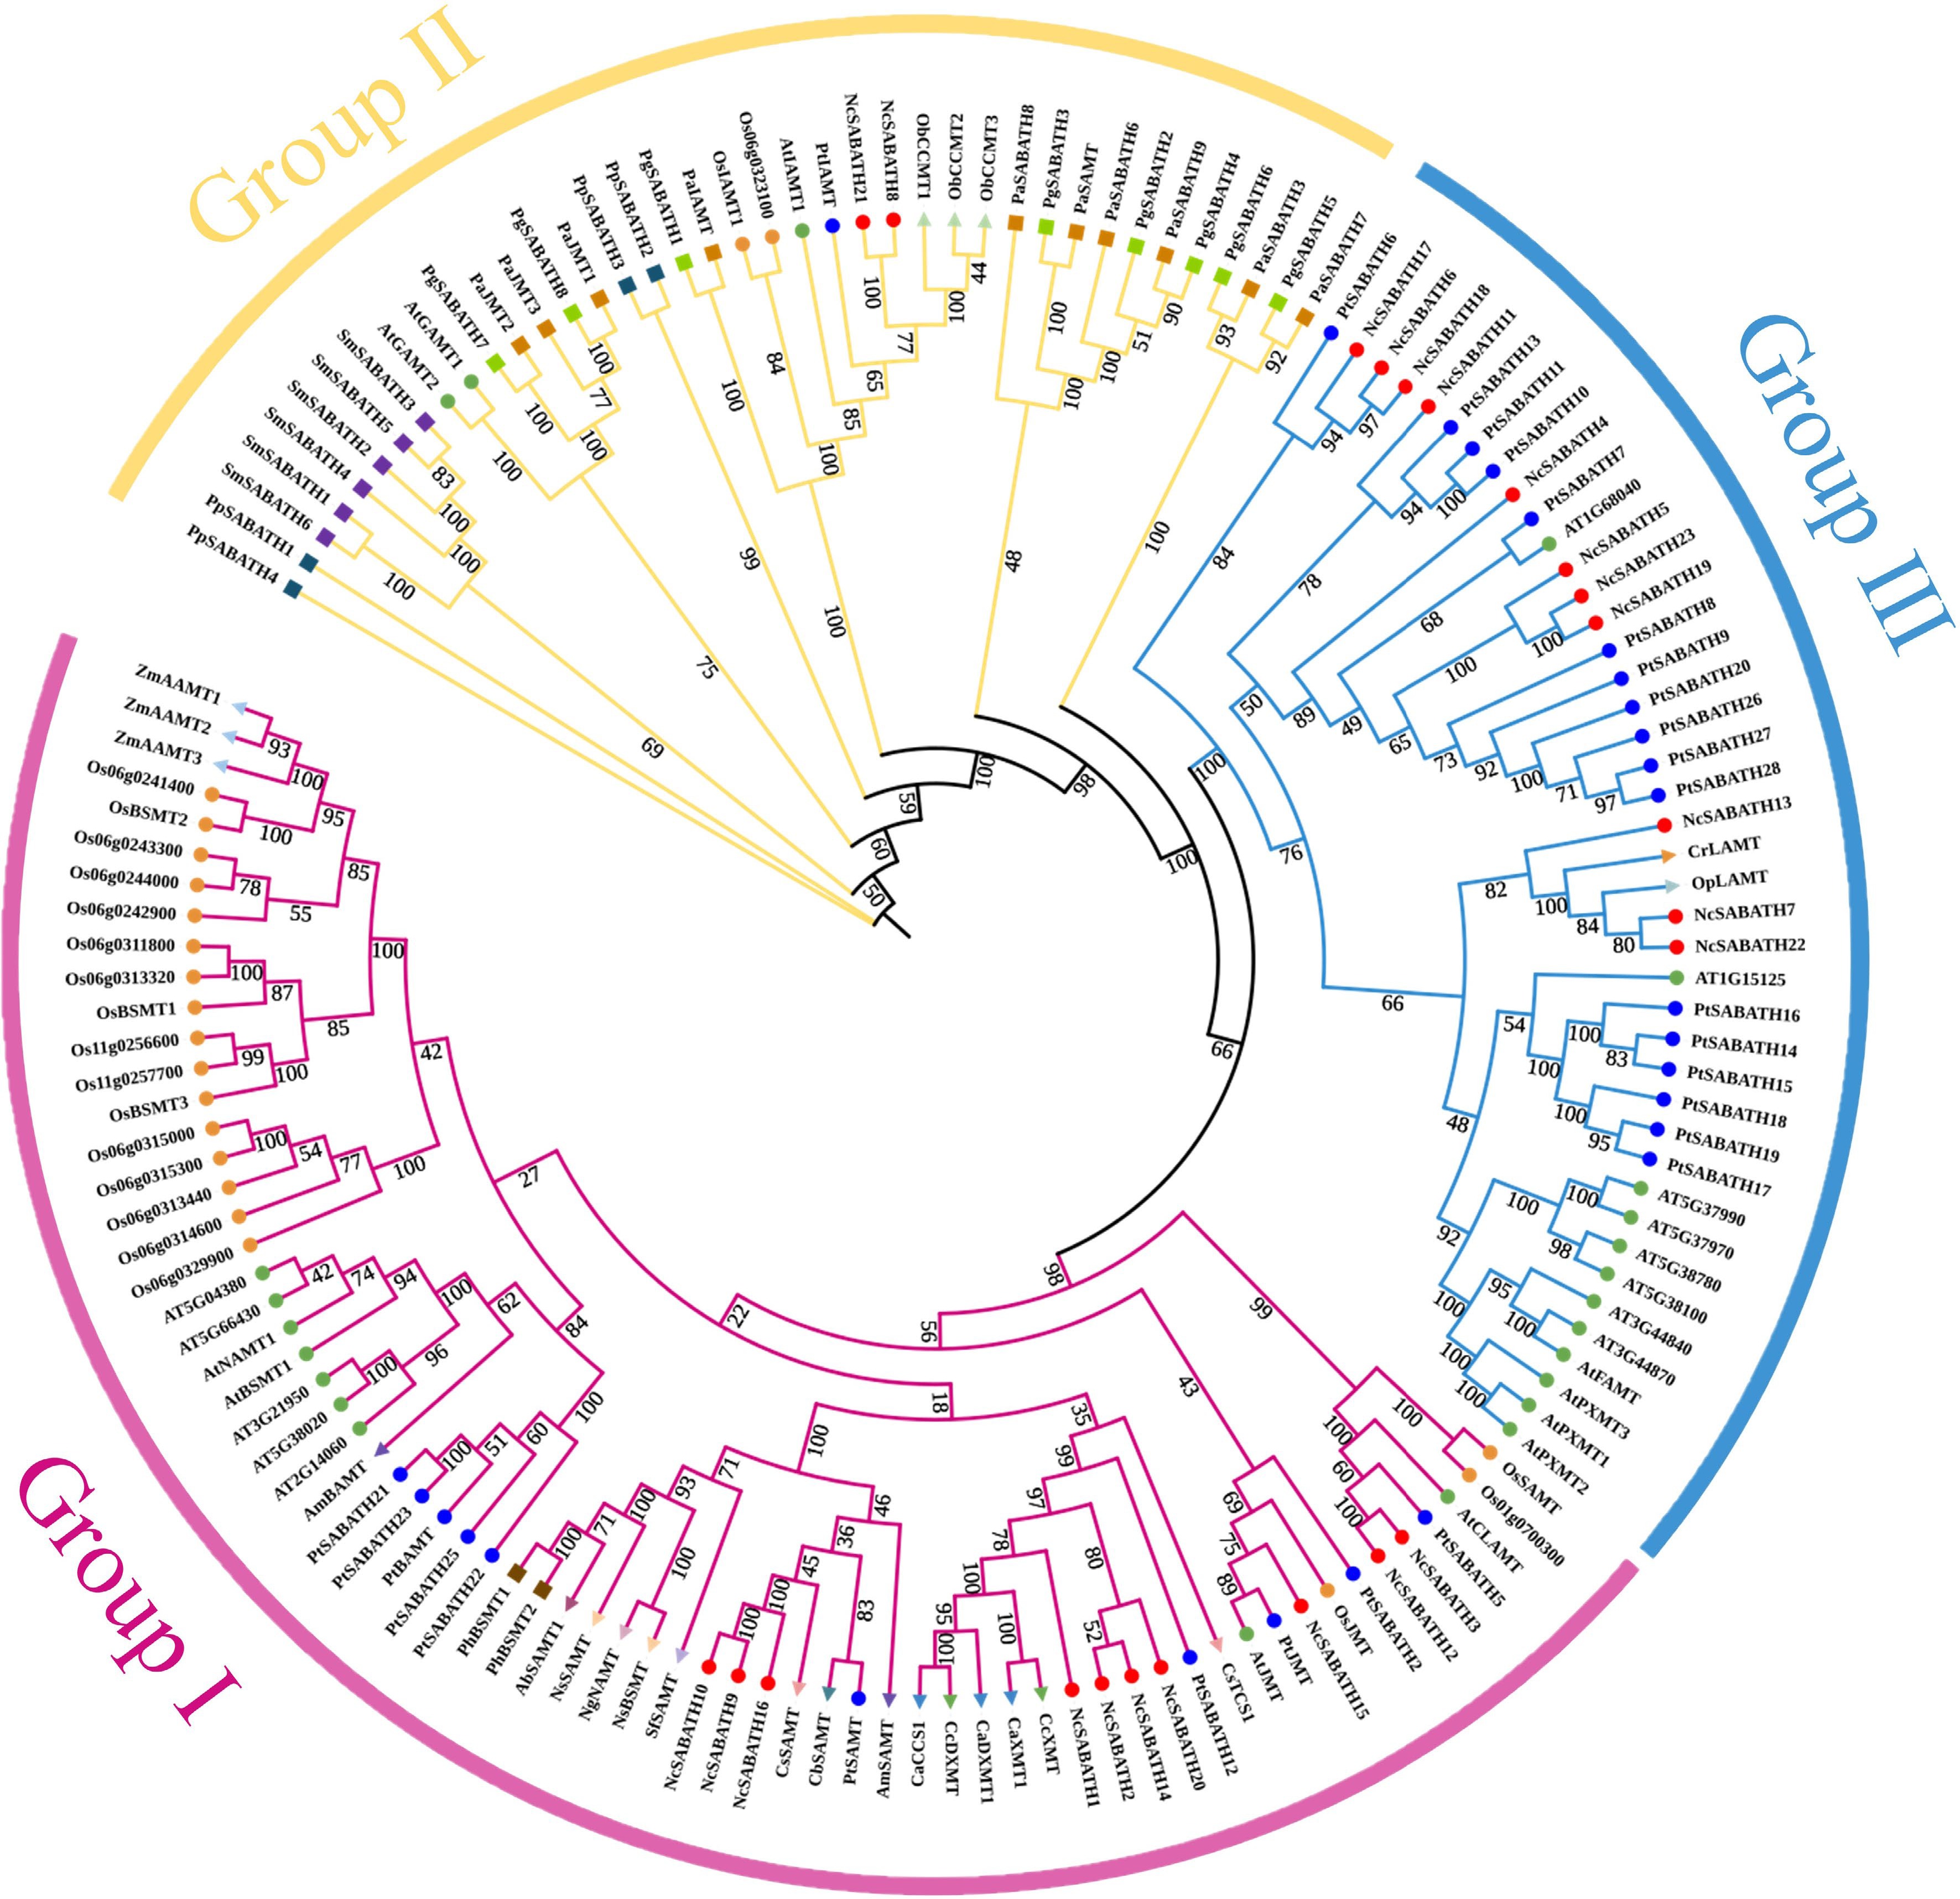
Figure 1.
Phylogenetic analysis of SABATH proteins among 25 different plant species using the maximum likelihood method with 1,000 bootstrap replicates. The subfamilies of NcSABATH, group I, II, and III are marked with red, yellow, and blue, respectively. Details of all SABATH proteins are listed in Supplemental Table S2.
-
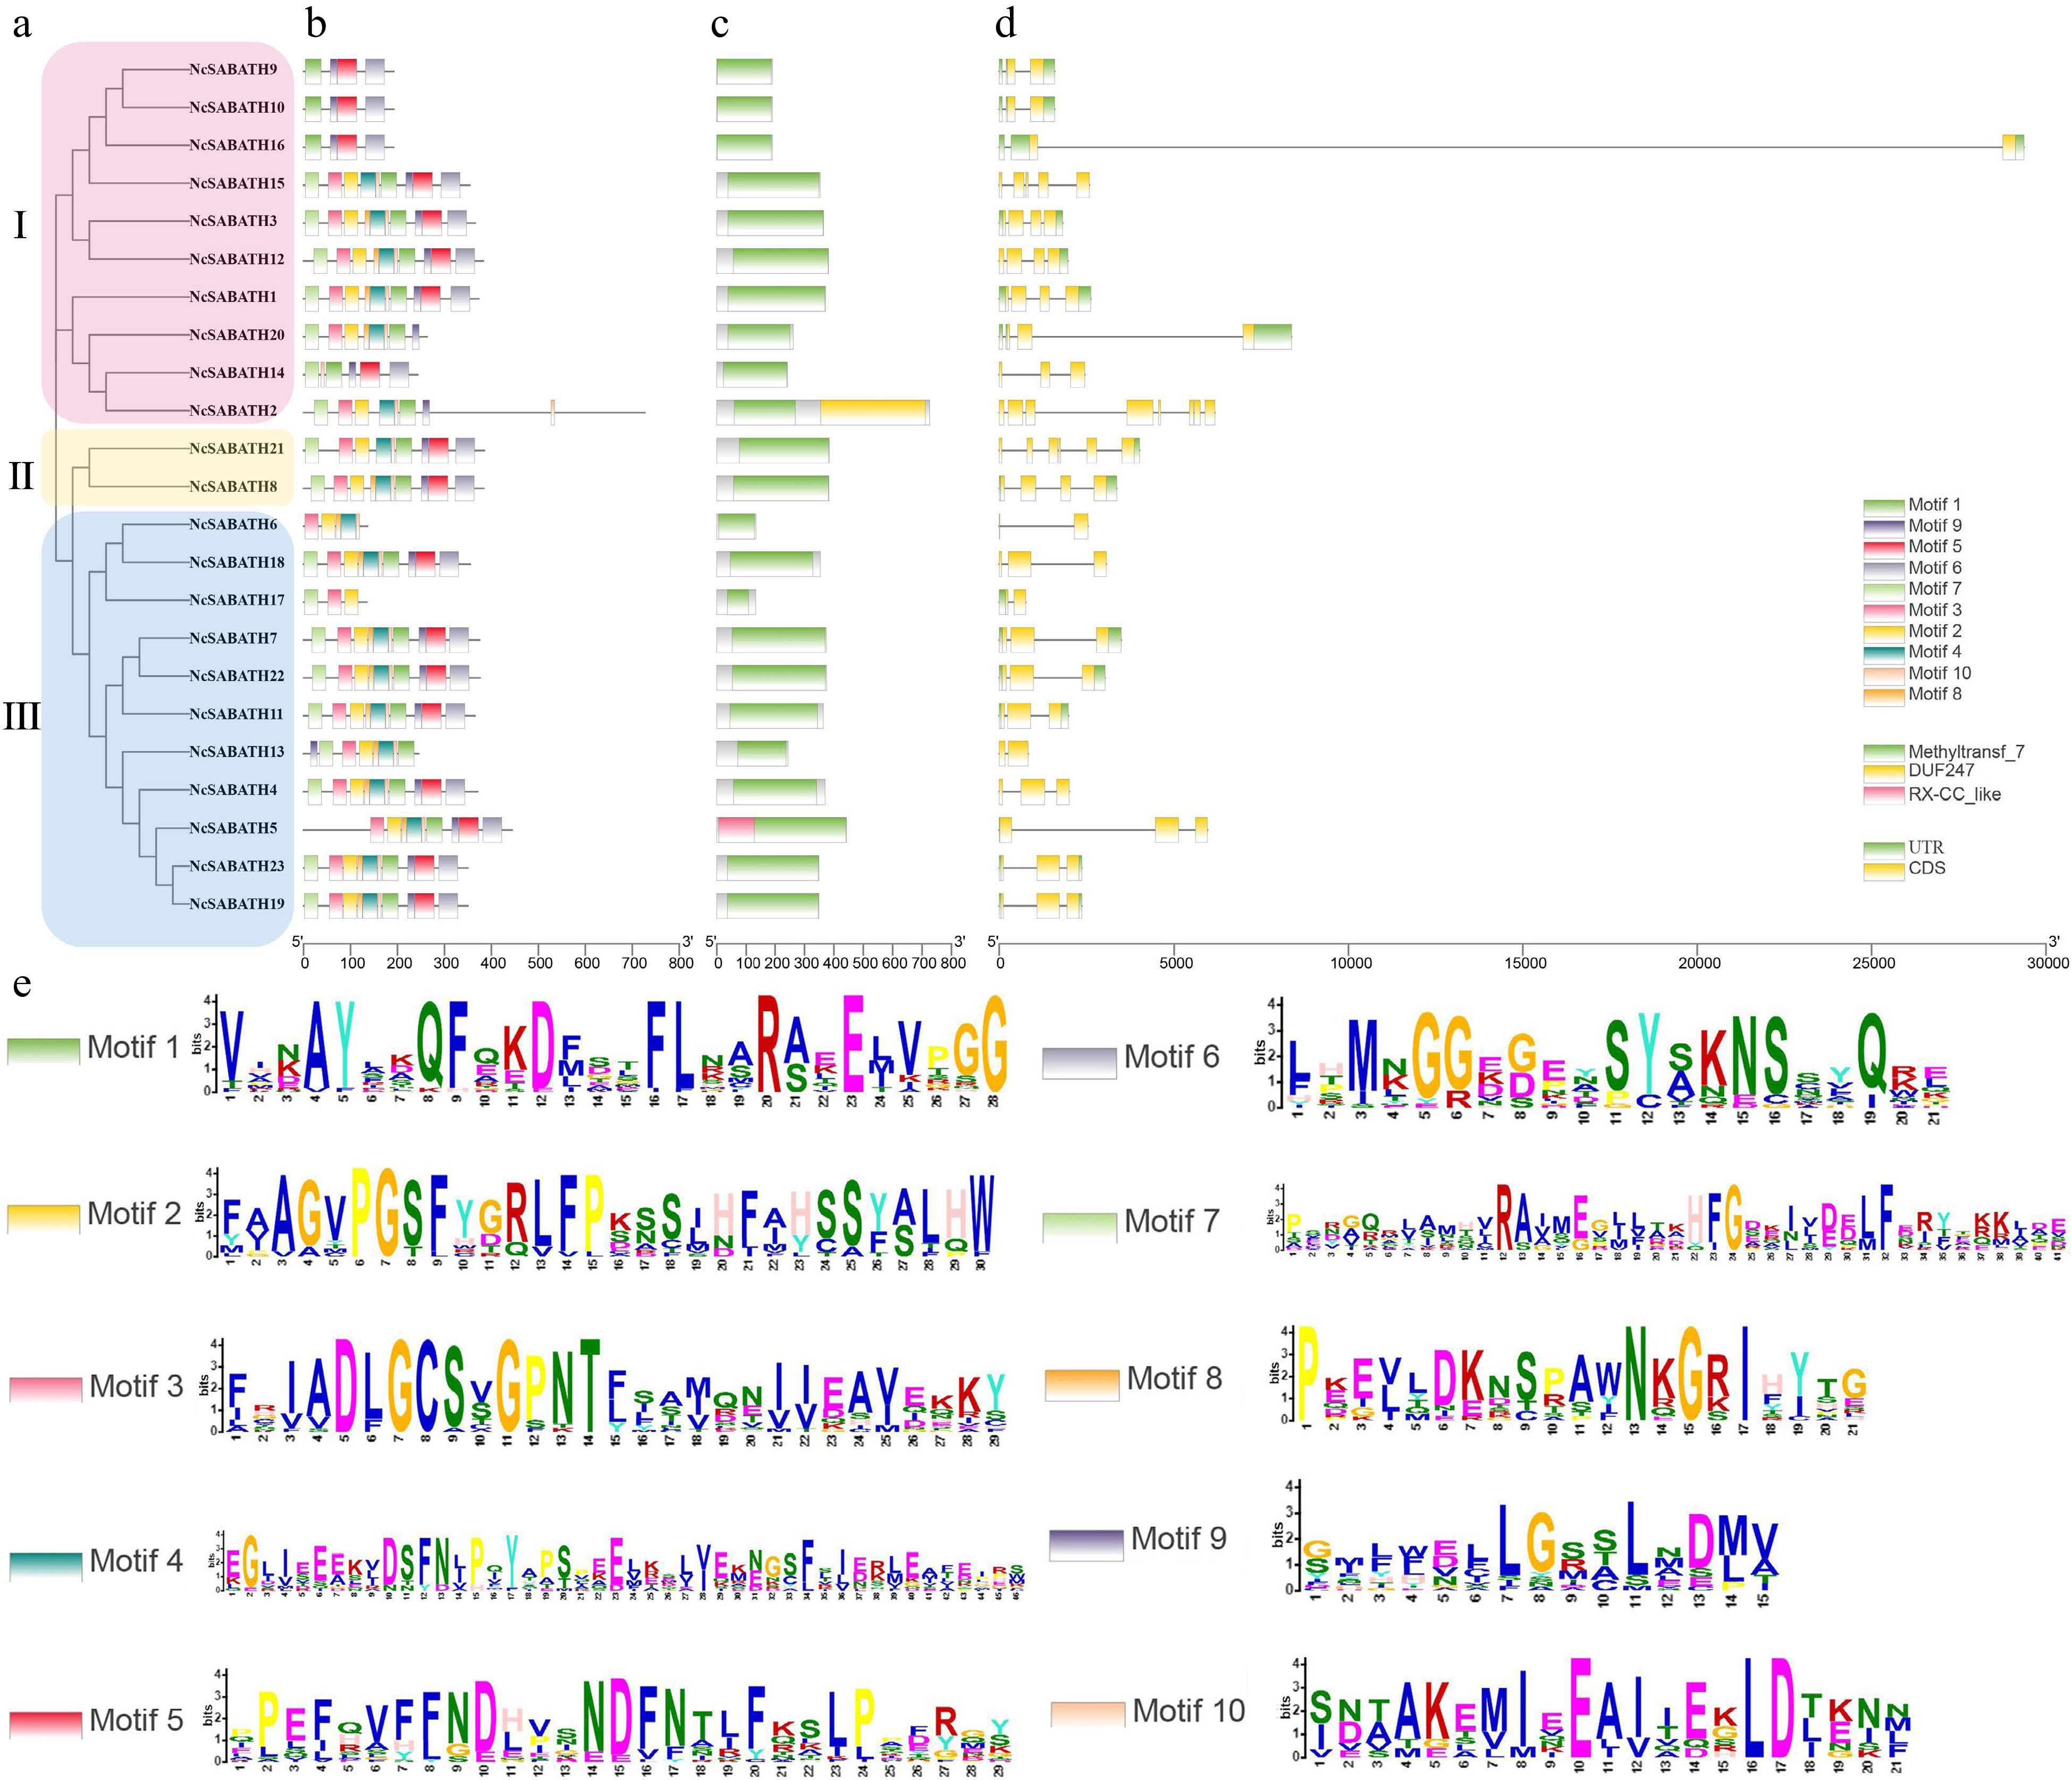
Figure 2.
Phylogenetic tree, gene structure, conserved domain, and motif analysis of NcSABATH proteins from N. cadamba. (a) Phylogenetic tree of all NcSABATH proteins was constructed using the neighbor-joining method with 1000 bootstraps. (b) Conserved motifs in the NcSABATH proteins were identified by the MEME program. Different motifs numbered 1-10 have different colors, of which sequence logos are shown in (e). (c) The conserved domain of NcSABATH proteins. (d) The UTR, CDS, and intron organization of NcSABATH genes.
-
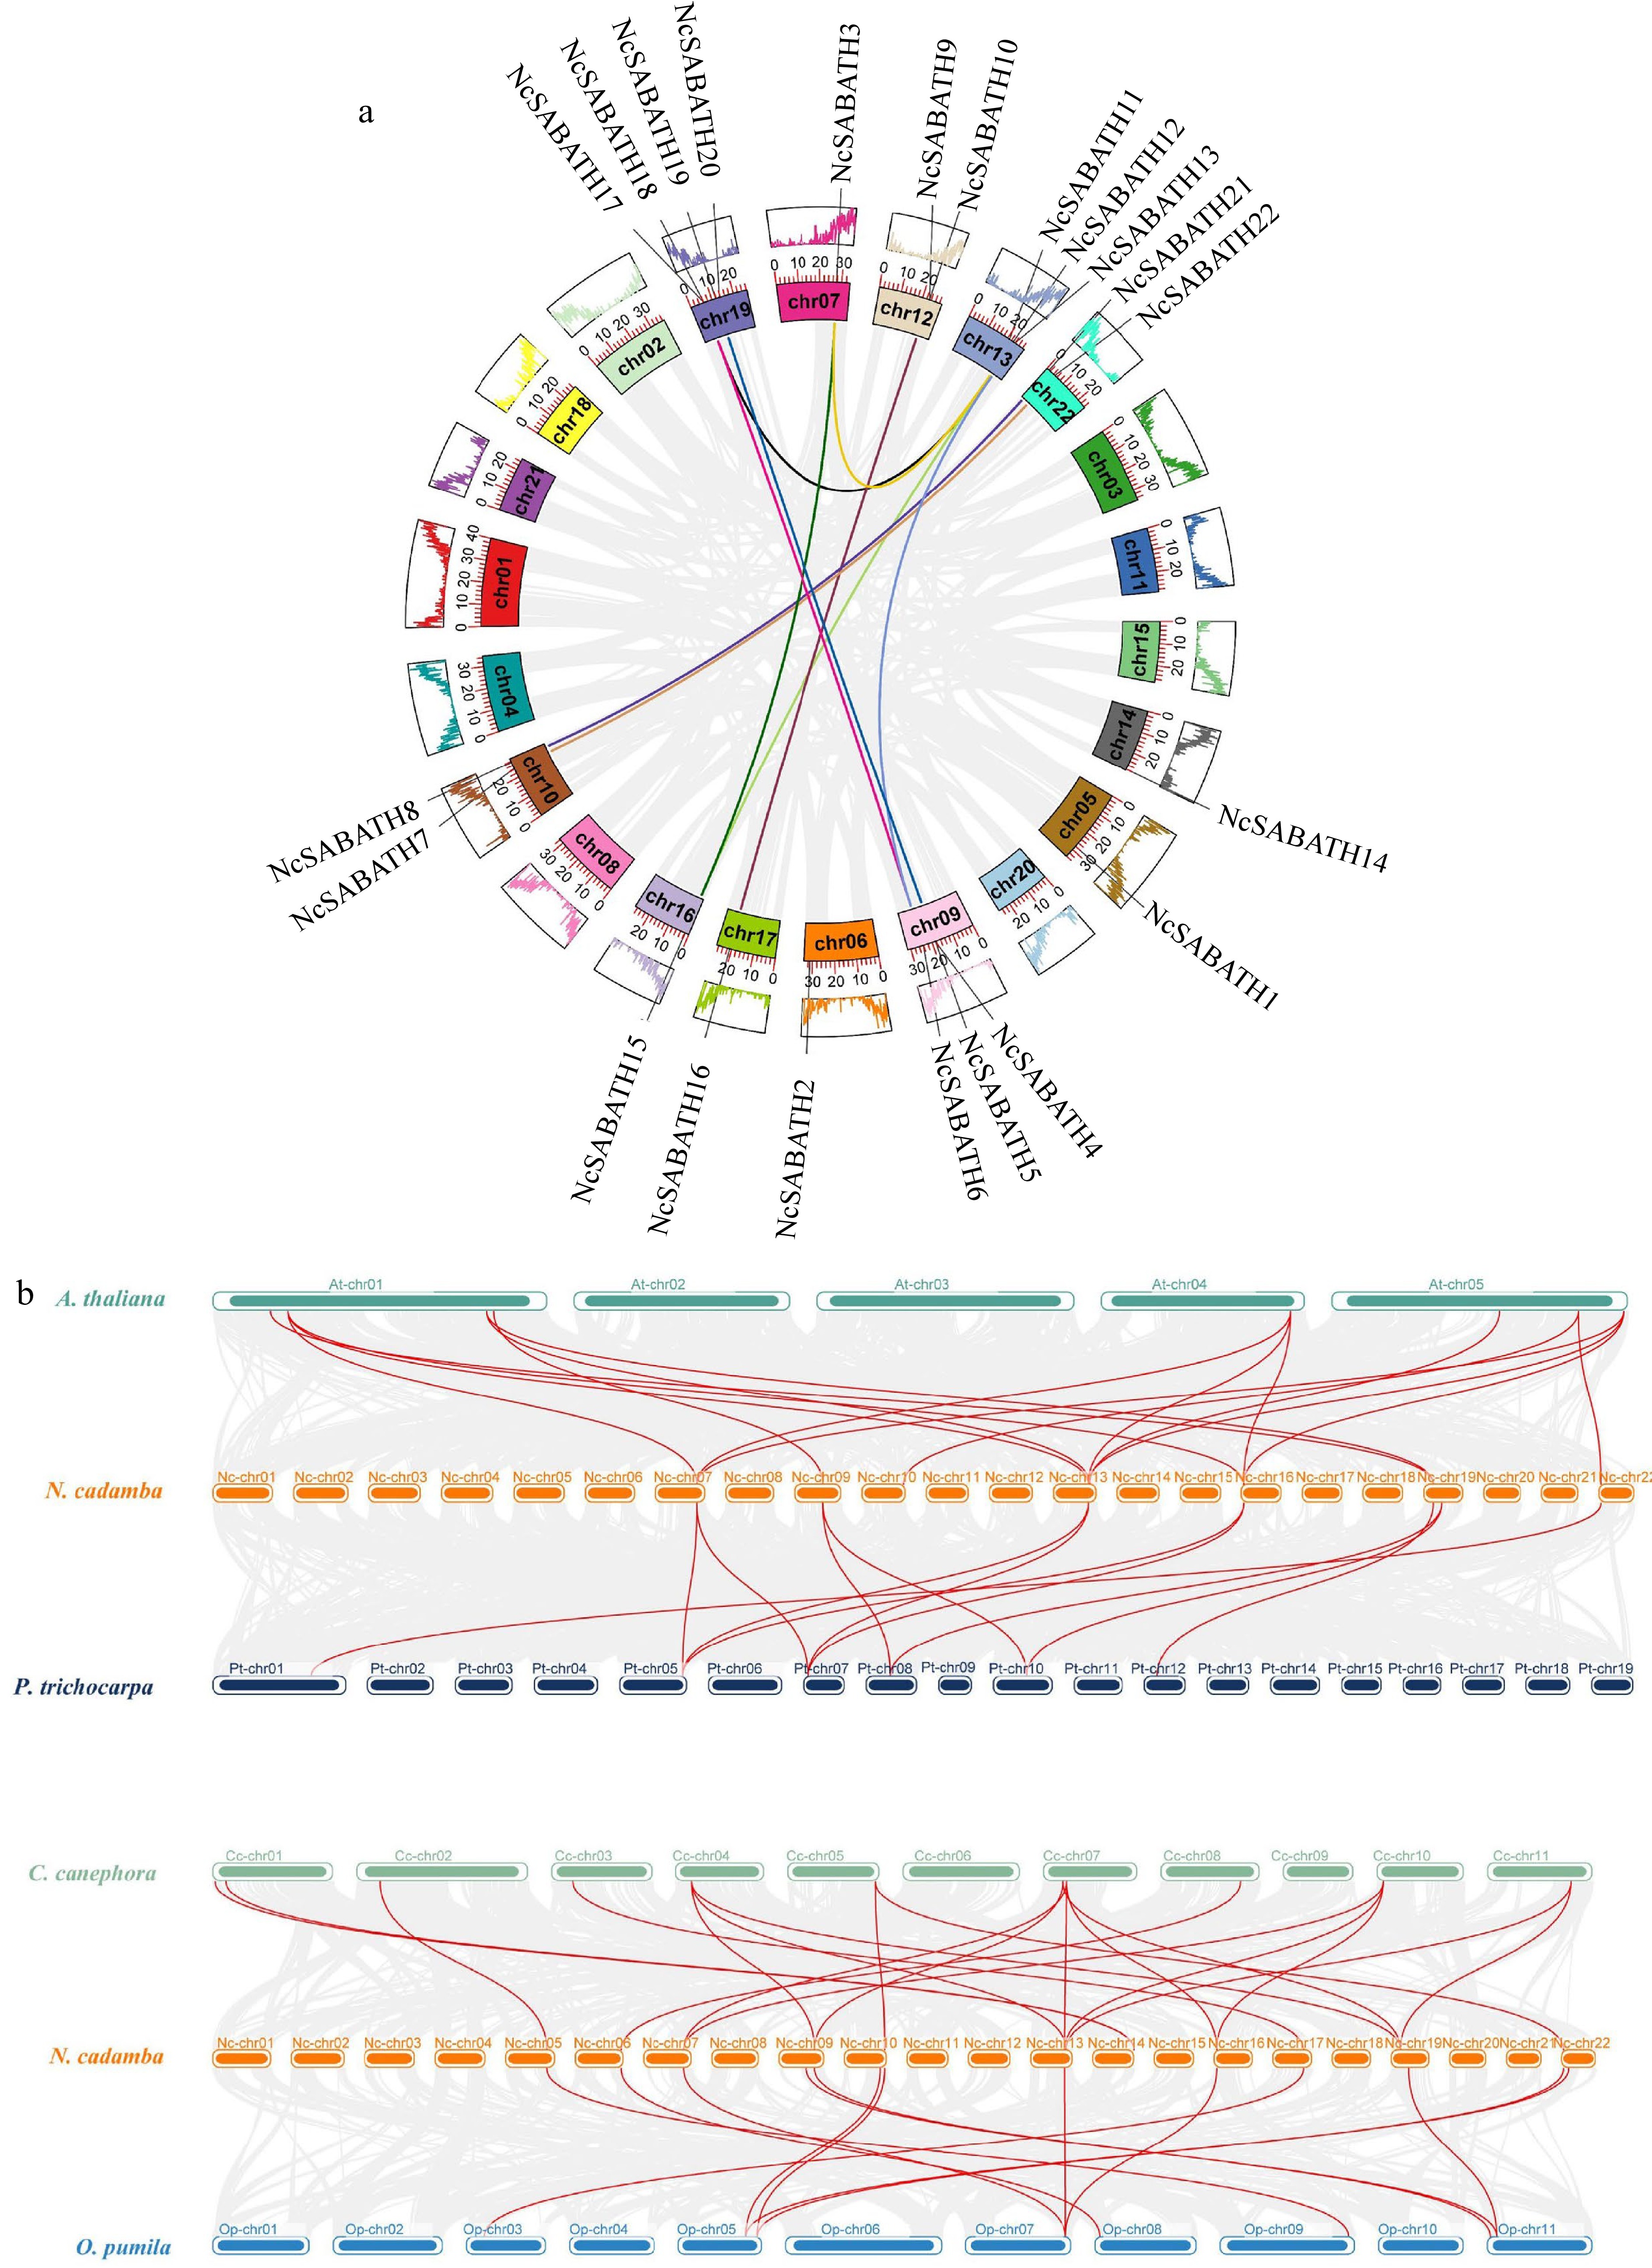
Figure 3.
Collinearity analysis of NcSABATH genes. (a) Intraspecies collinearity analysis of NcSABATHs. Each segmental duplication gene pair was connected with the same color lines. (b) Collinearity analysis of SABATHs between N. cadamba and the other four species. Arabidopsis thaliana (At), Populus trichocarpa (Pt), Coffea canephora (Cc), Ophiorrhiza pumila (Op). Synteny blocks were represented by gray lines, and duplicated gene pairs of SABATH are represented by red lines.
-
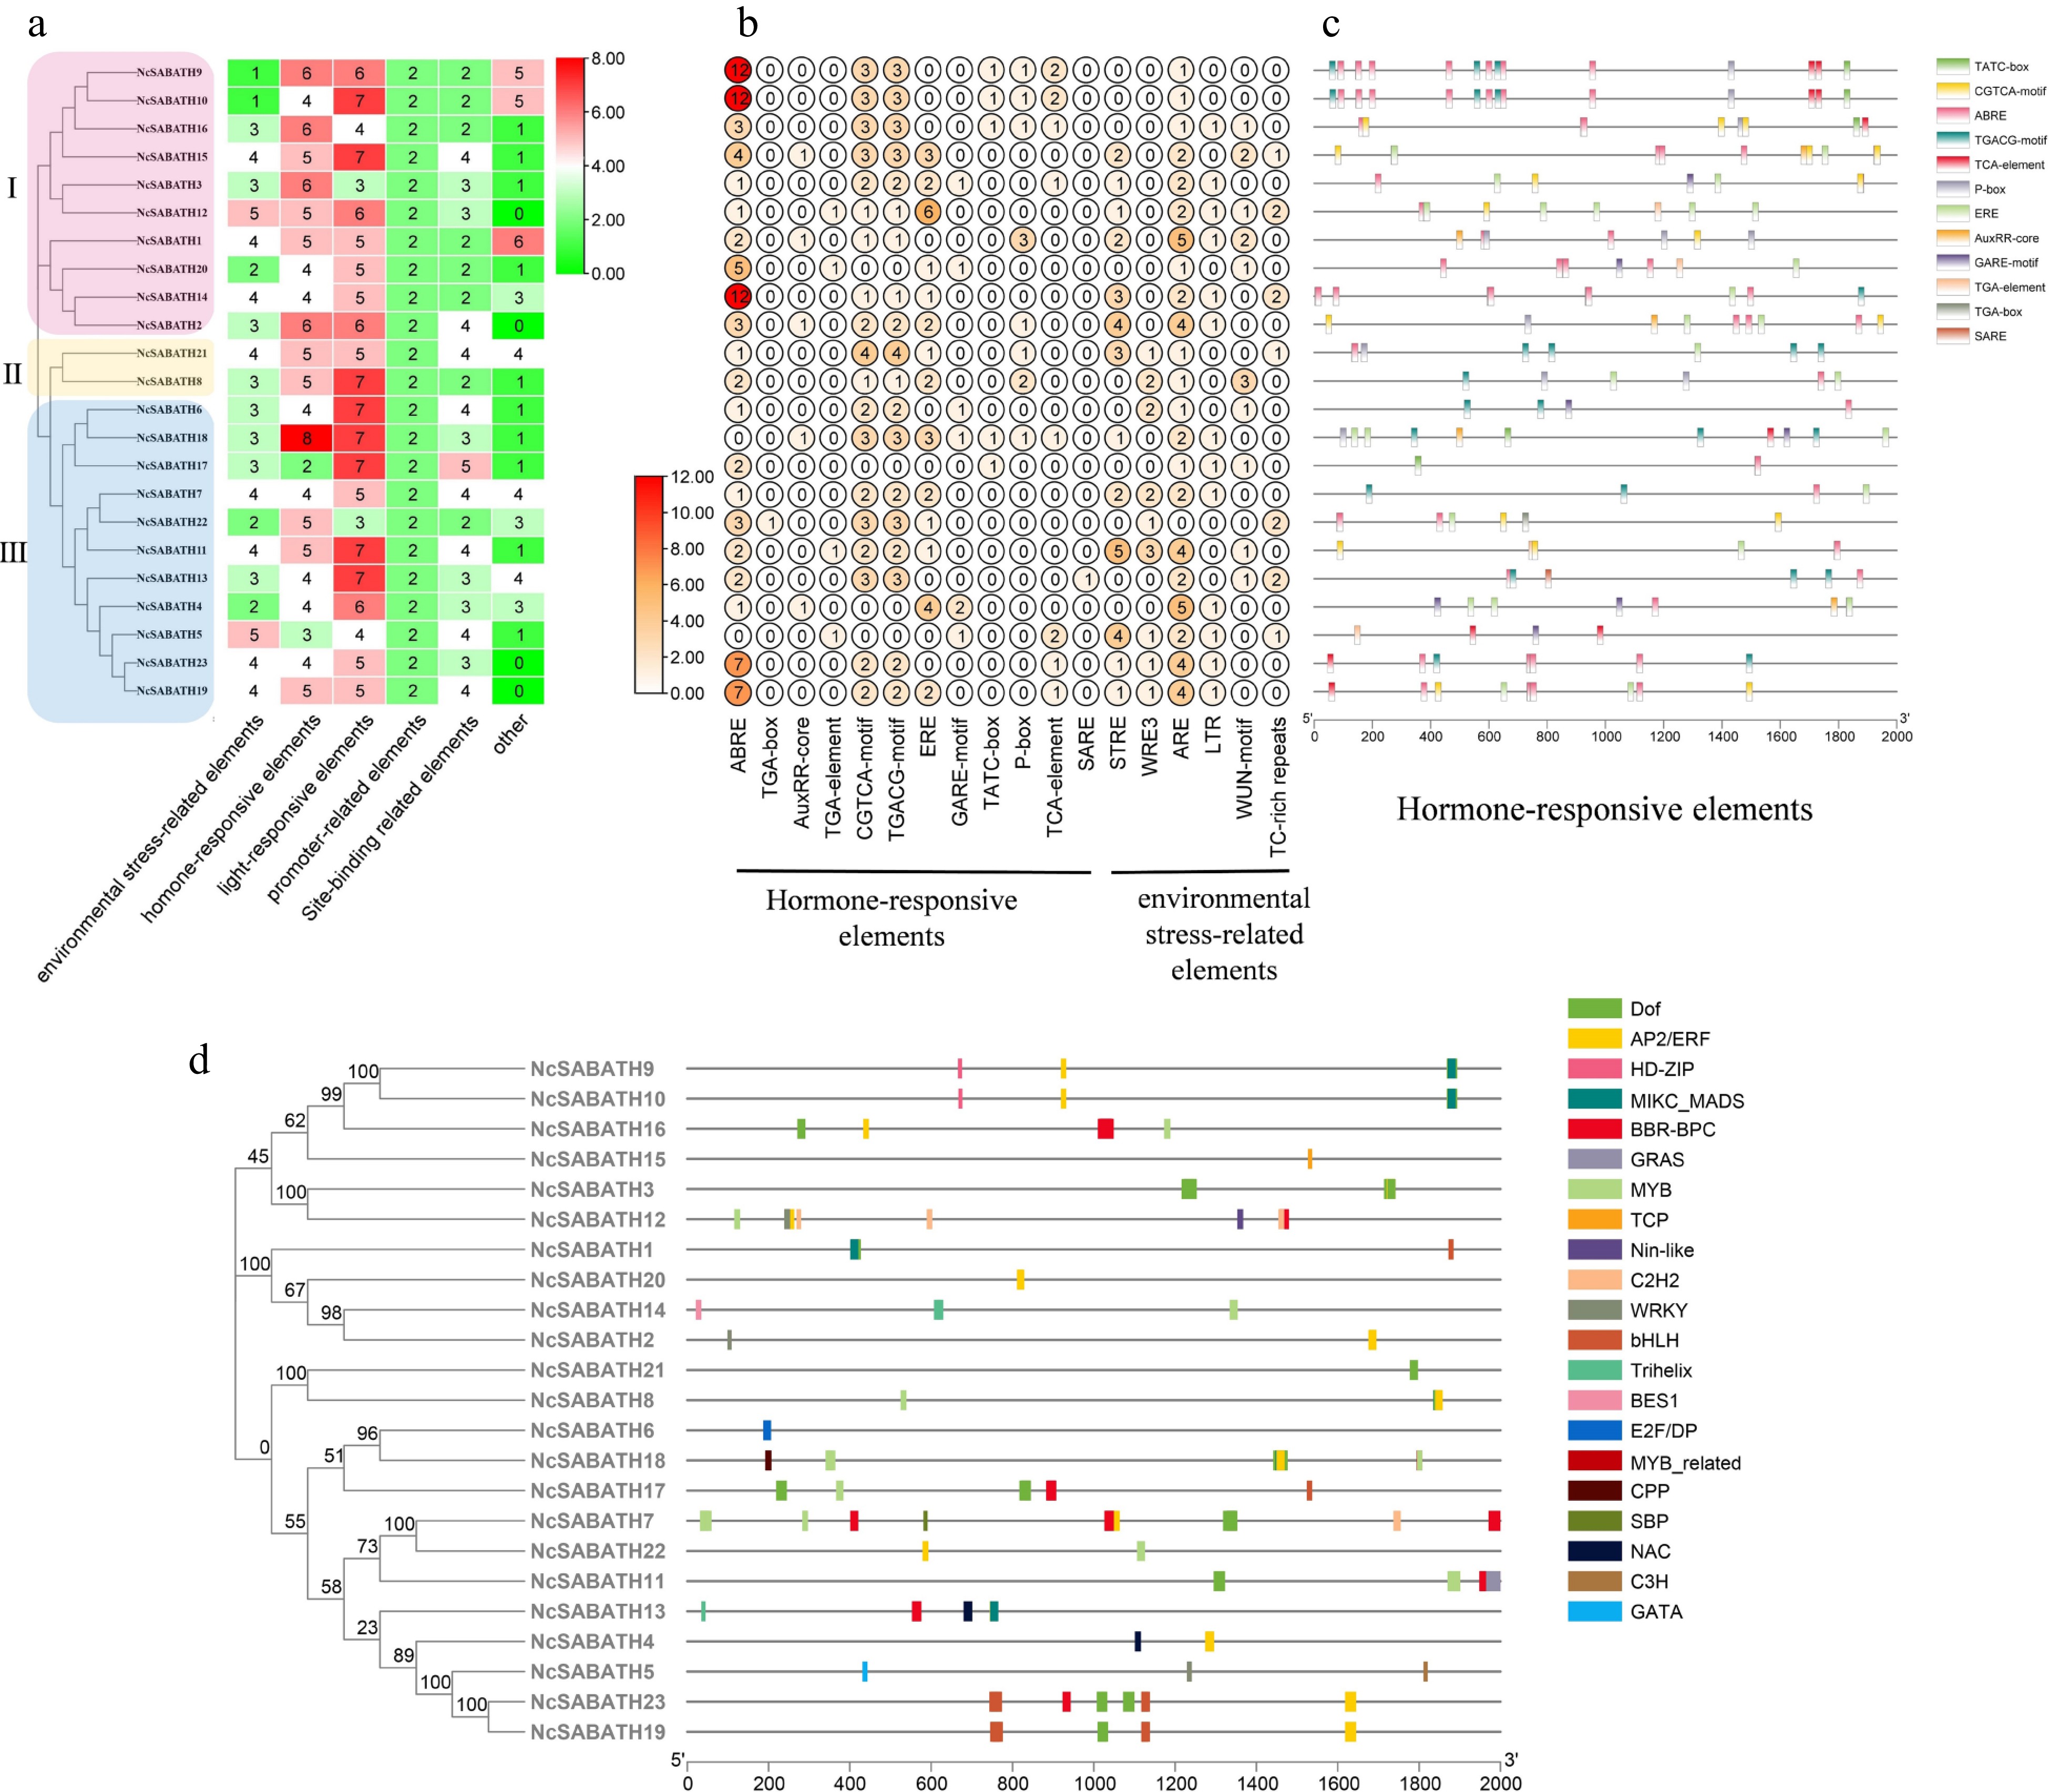
Figure 4.
Prediction of cis-acting elements and transcription factor binding sites in the promoters of NcSABATH genes. (a) Each NcSABATH promoter contains the number of cis-acting elements detected which were divided into six types. (b) The number of different elements in hormone-responsive and environmental stress-related elements. (c) Visualization of hormone-responsive elements in NcSABATH promoters by TBtools, including position, kind, and quantity of elements. (d) Visualization of the number, type, and position of transcription factor binding sites in NcSABATH promoters by TBtools.
-
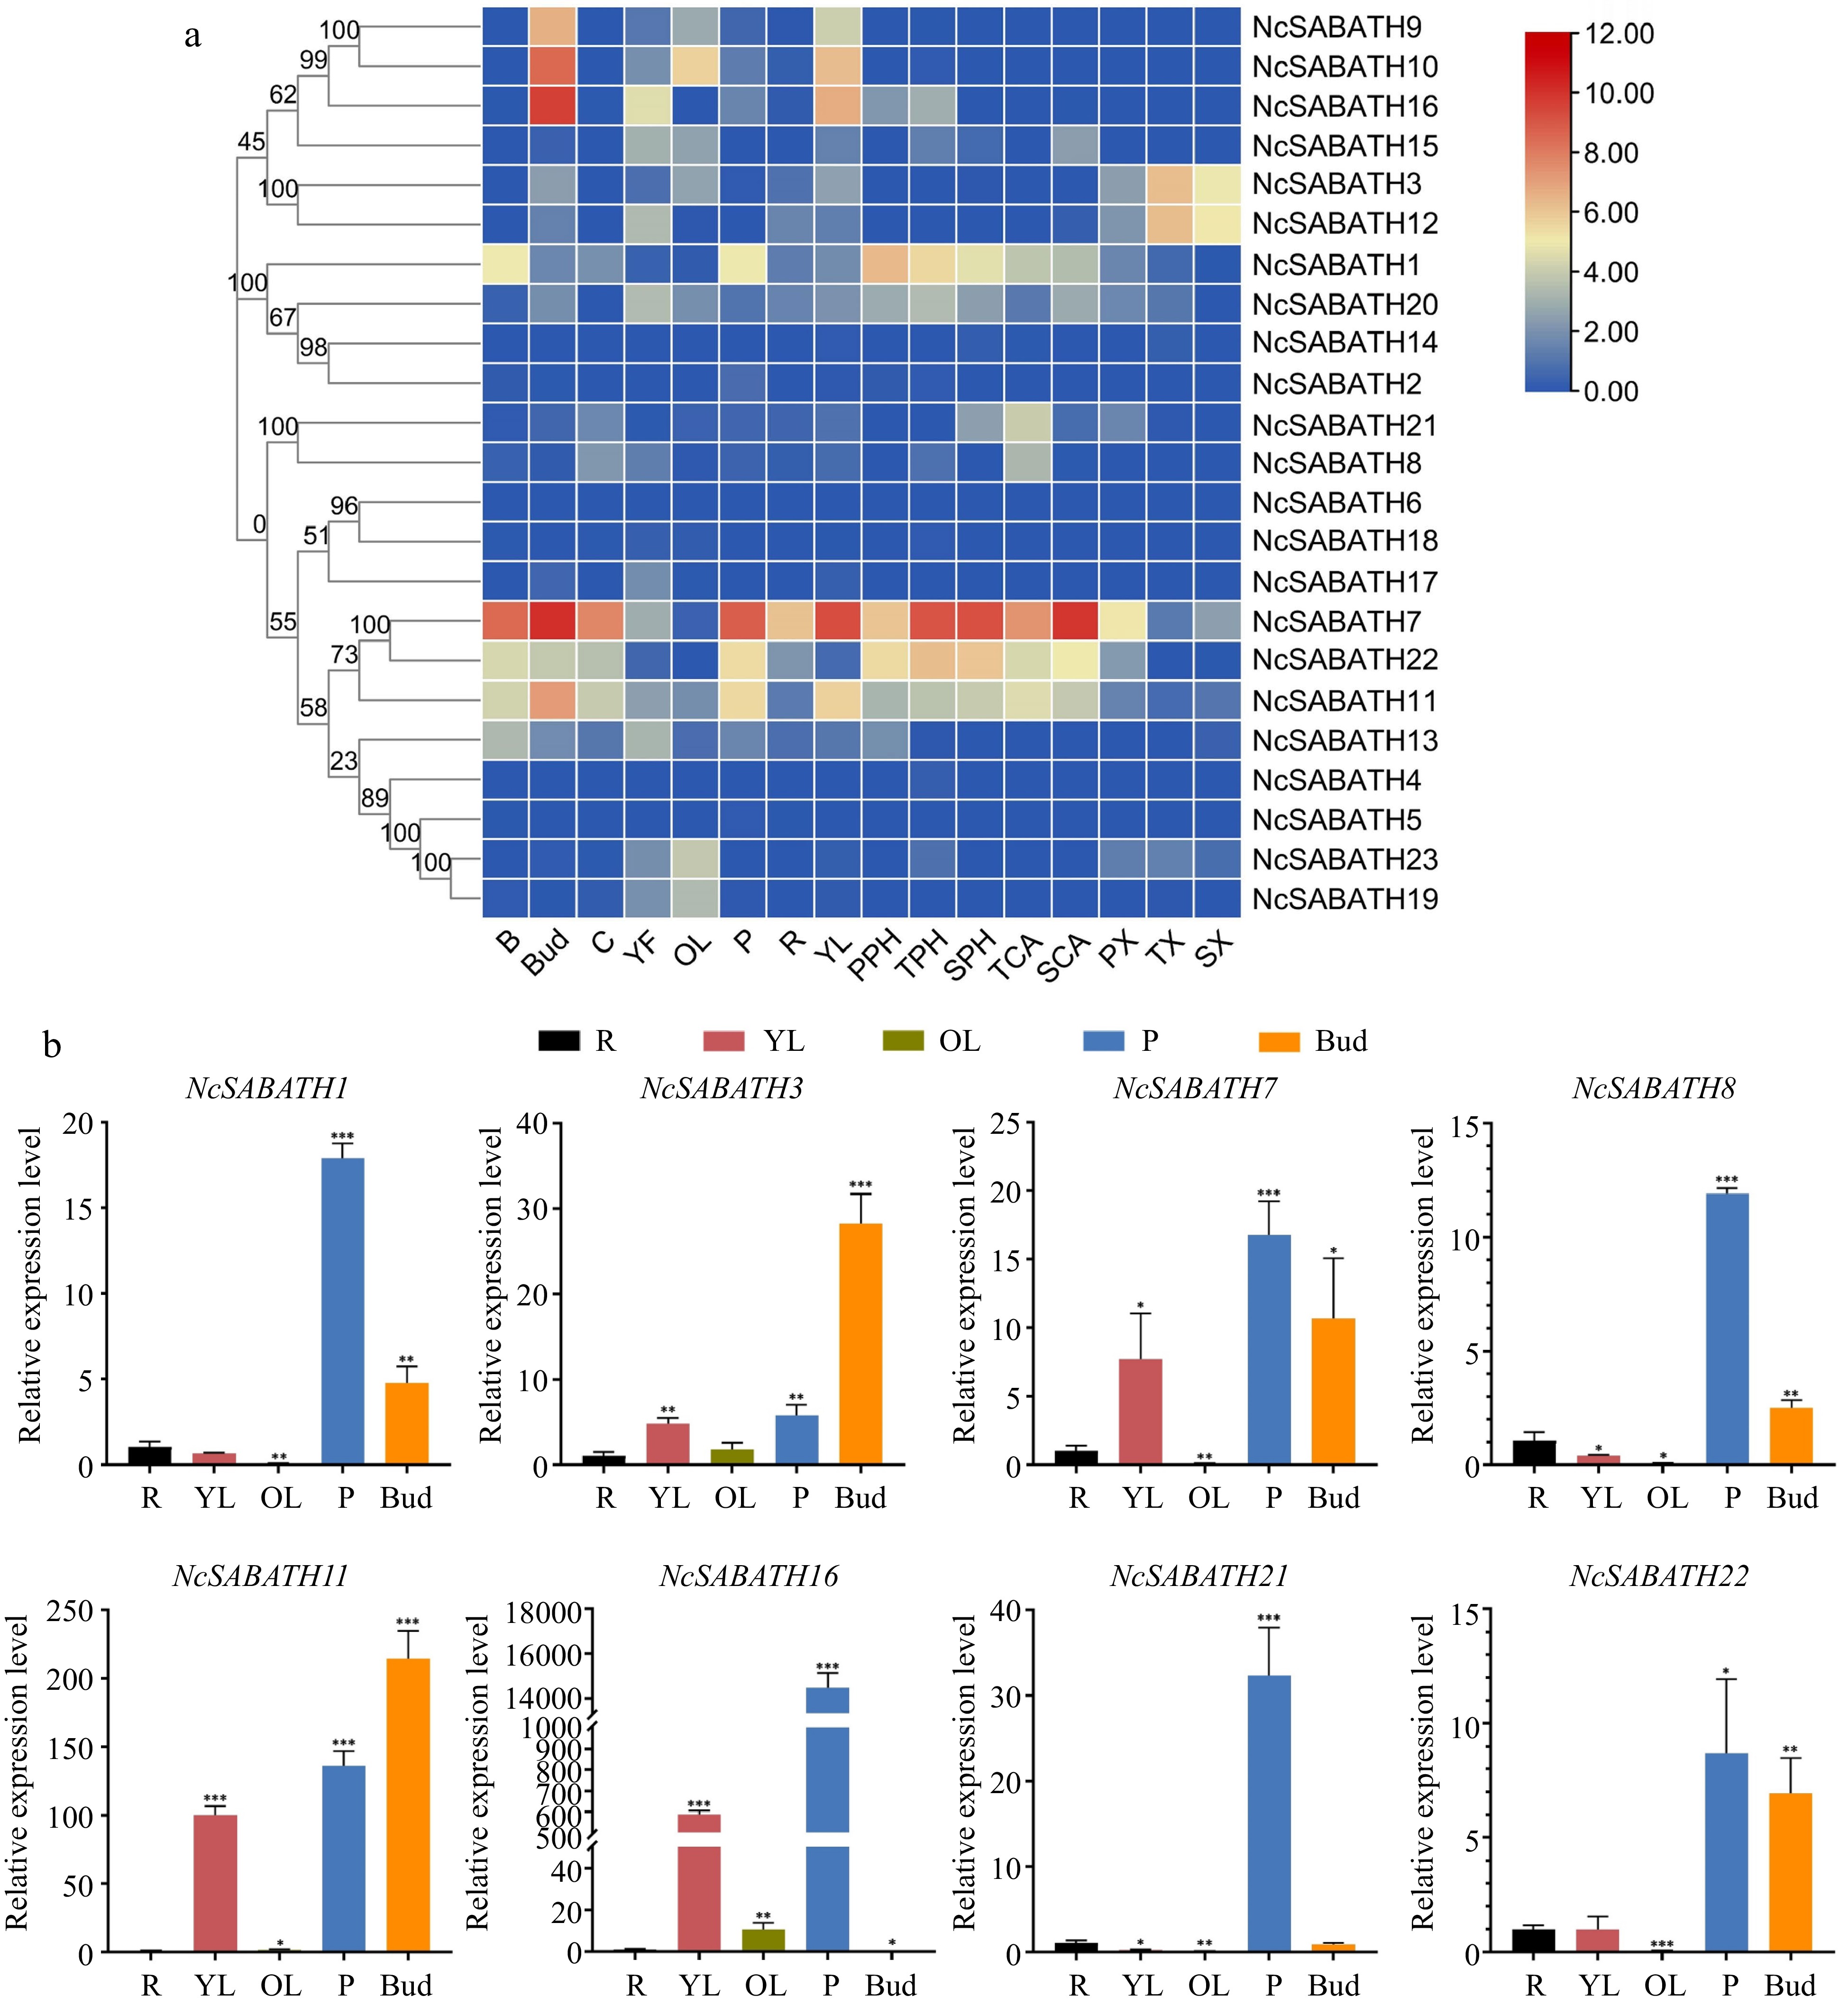
Figure 5.
The expression patterns of NcSABATH genes in different tissues. (a) The expression patterns of NcSABATH genes in 16 tissues based on transcriptome data. Bark (B), cambium (C), bud (Bud), young fruit (YF), old leaves (OL), phloem (P), root (R), young leaves (YL), xylem (primary xylem, PX; transitional xylem, TX; secondary xylem, SX), cambium (transitional cambium, TCA; secondary, SCA) and phloem (primary phloem, PPH; transitional phloem, TPH; secondary phloem, SPH) from the first, second and fourth internodes. The second internode of a 1-year-old seedling was identified as the transition. The color scale represents relative expression levels from high (red color) to low (blue color). (b) QRT-PCR results of the eight selected NcSABATHs in roots (R), young leaves (YL), old leaves (OL), phloem (P), and bud of N. cadamba. Error bars represent ± SD of the means of three biological replicates (p < 0.05).
-
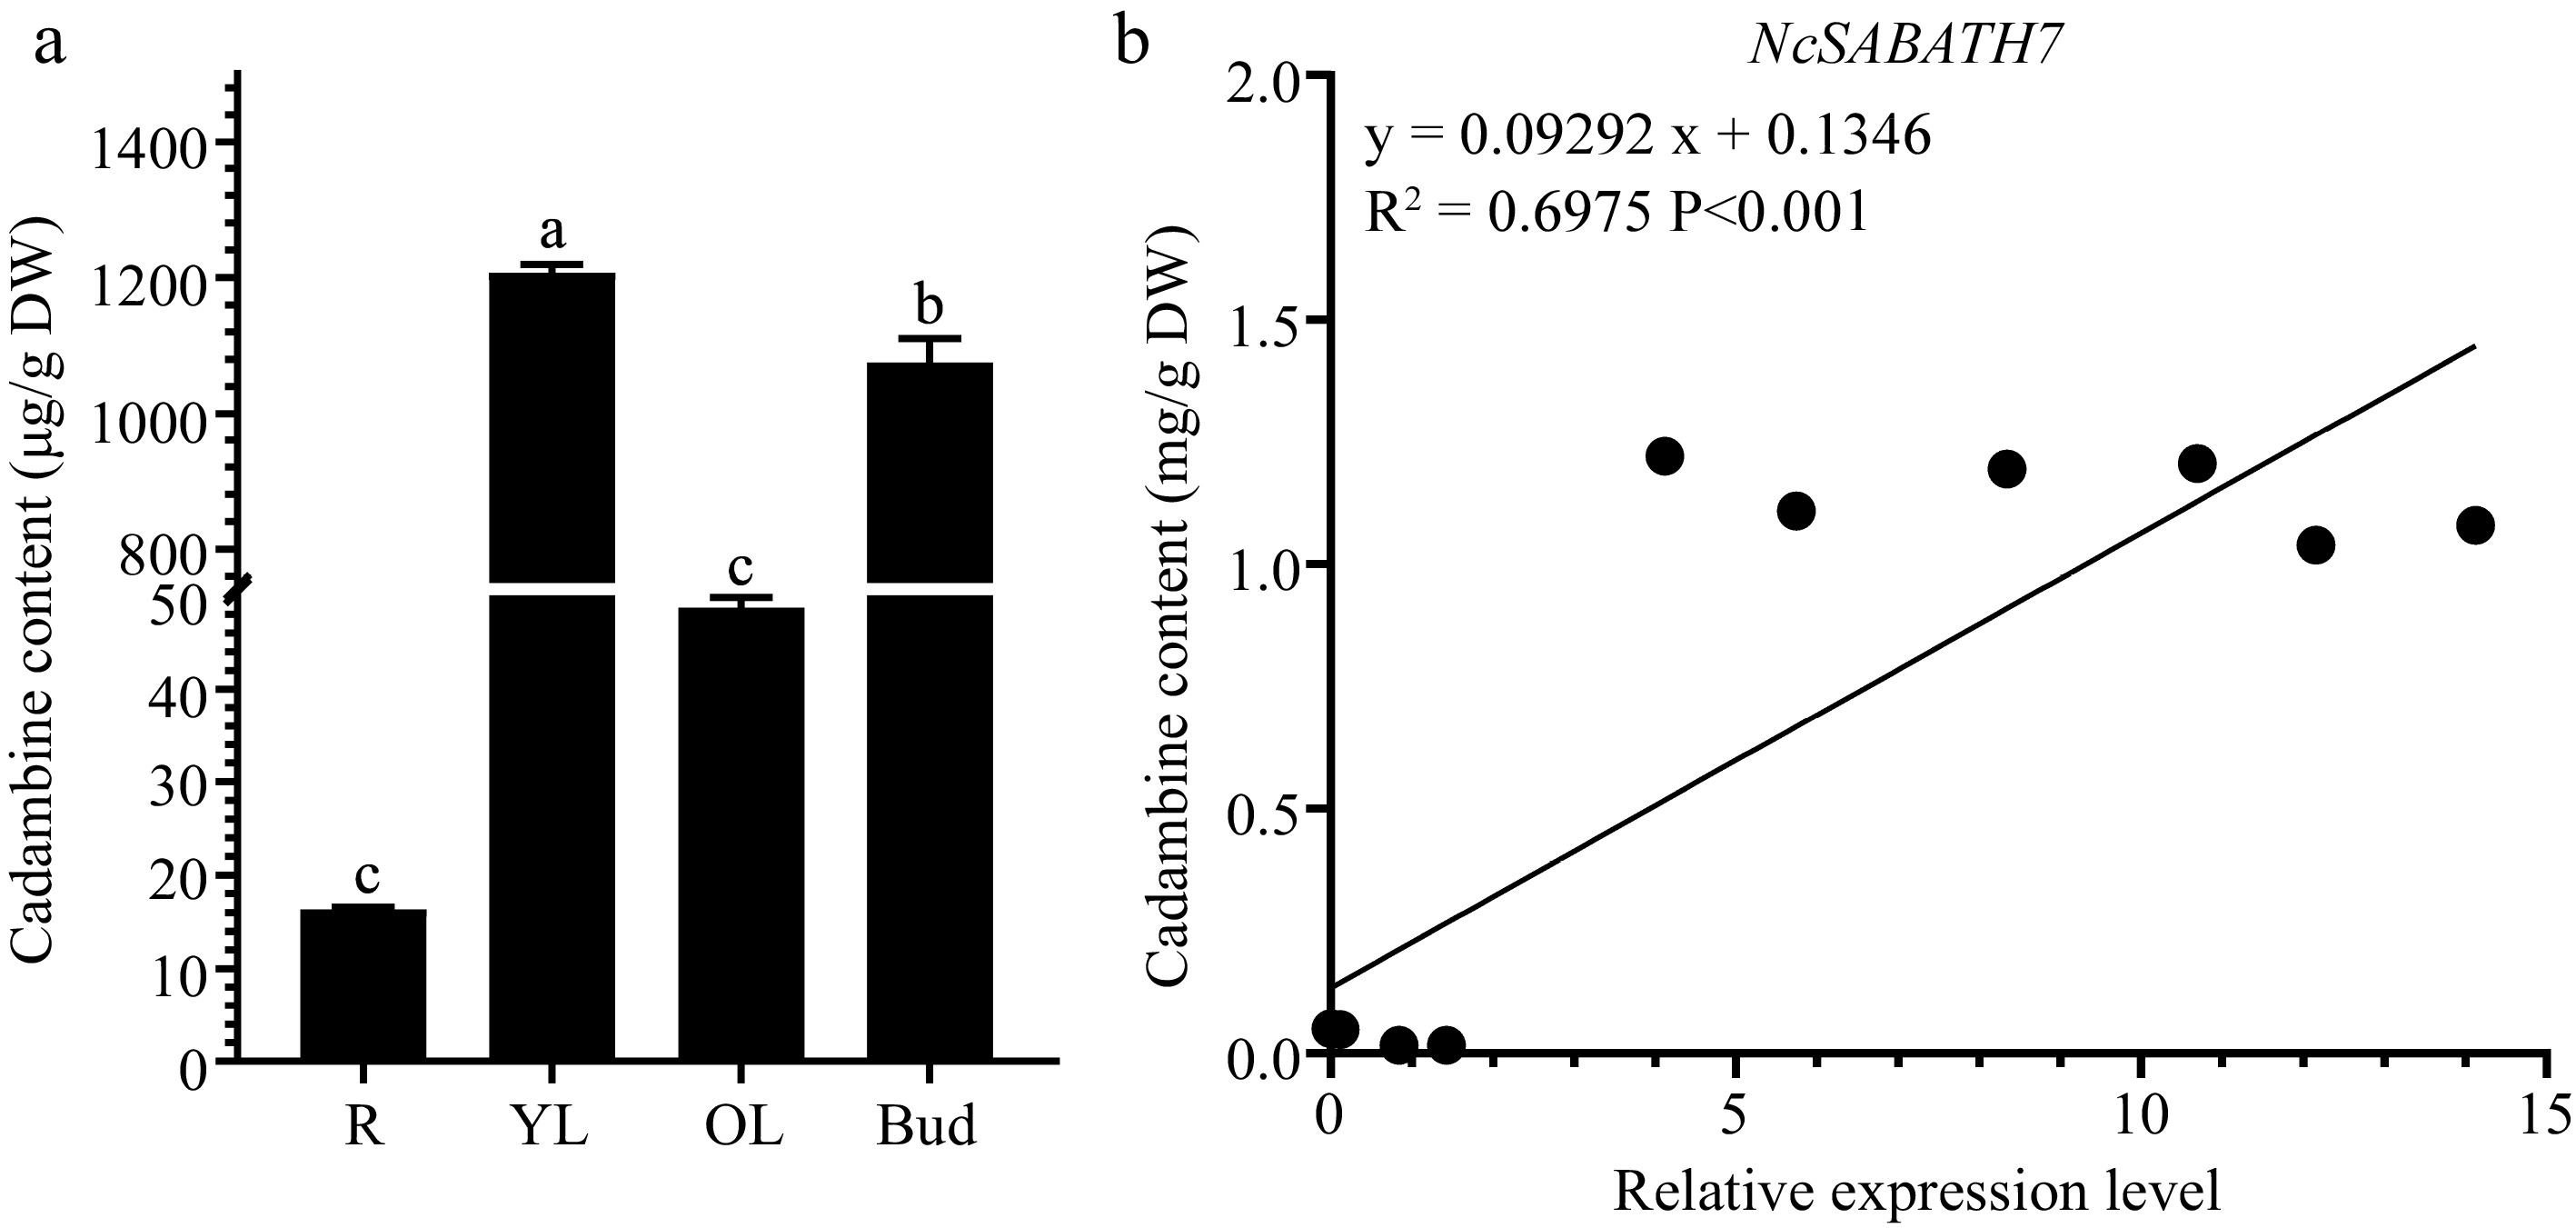
Figure 6.
The content of cadambine in different tissues and correlation analysis between NcSABATH7 gene expression level and cadambine content in different tissues of N. cadamba. (a) The content of cadambine in old leaves (OL), young leaves (YL), buds, and roots (R). One-way ANOVA (p < 0.05) was used to test significance, and different columns with the same letter showed no differences. (b) Correlation analysis between the expression level of NcSABATH7 and cadambine content in different tissues of N. cadamba. Error bars represent ± SD of the means of three biological replicates.
-
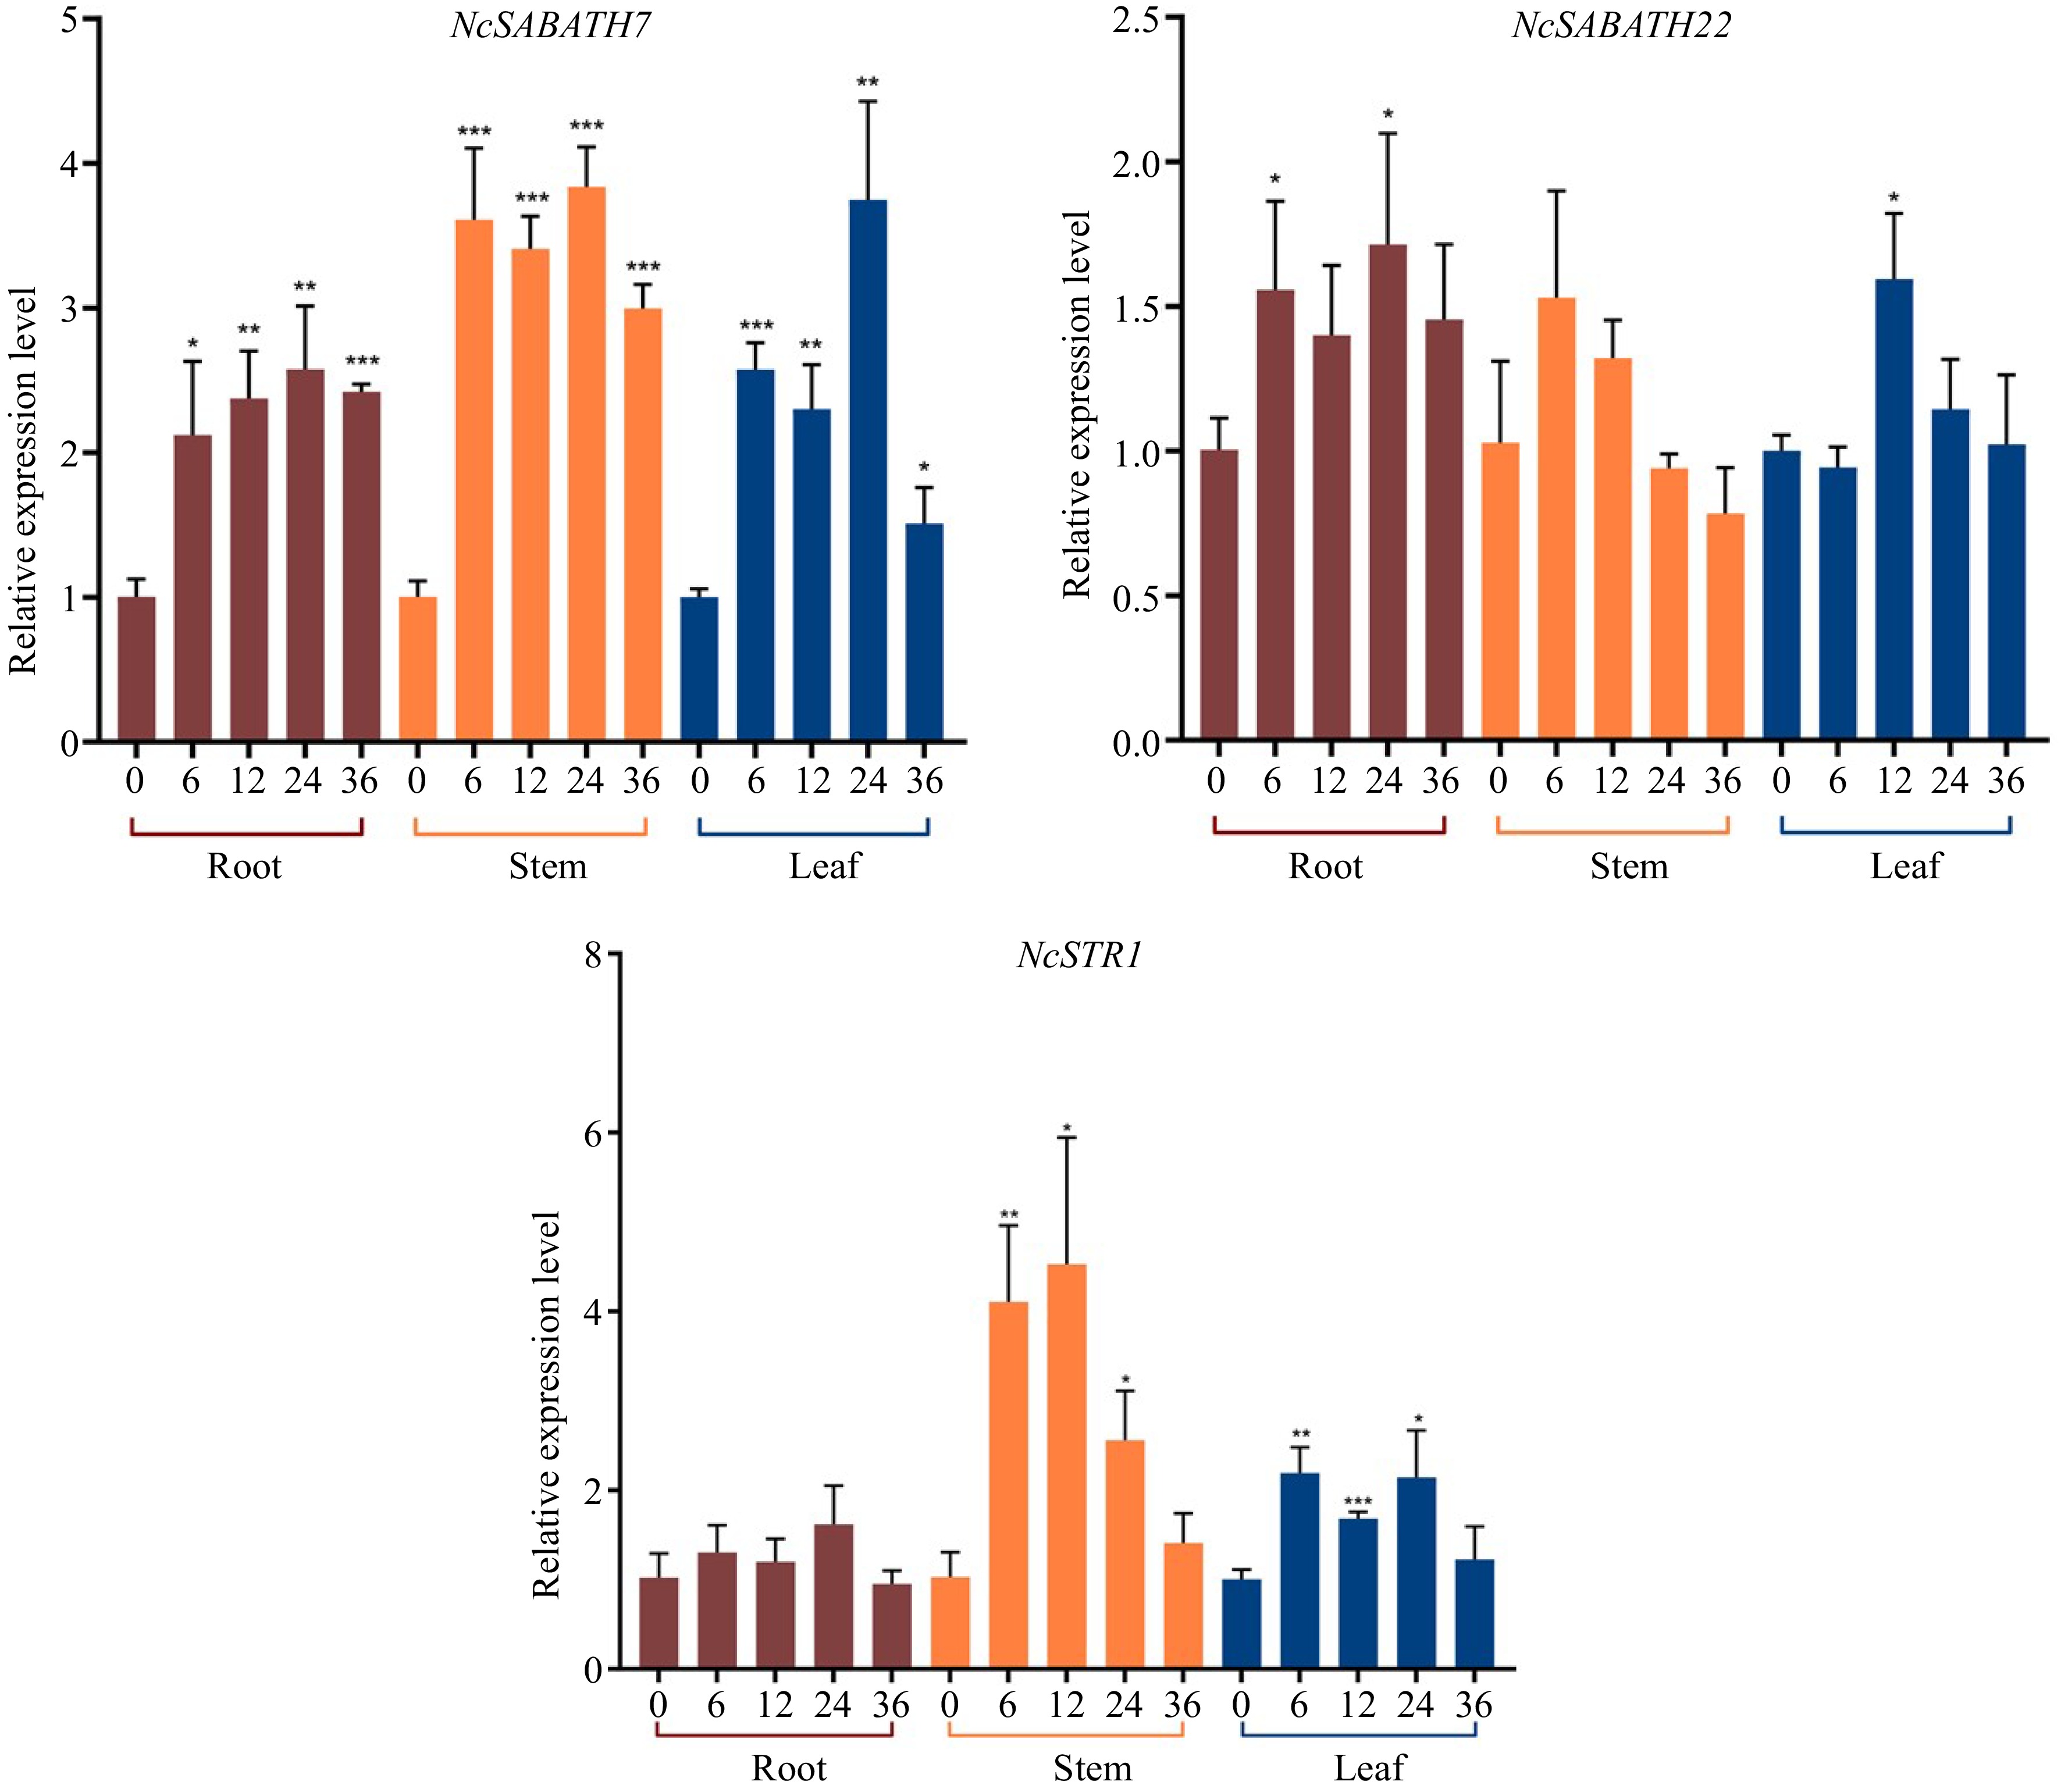
Figure 7.
Relative expression levels of NcSABATH7/22 and NcSTR1 under MeJA (100 μM) stress in 0, 6, 12, 24, and 36 h. The mean expression value was calculated from three independent biological replicates relative to 0 h. Error bars represent ± SD of the means of three biological replicates (p < 0.05).
-
Gene name Gene ID Strand Gene CDS Protein pI MW (kDa) Predict Length (bp) Length (bp) Length (aa) Subcellular localization NcSABATH1 evm.model.Contig81.1046 − 2,611 1,119 372 5.44 41.6 Cytoplasm/Nucleus NcSABATH2 evm.model.Contig54.5 + 6,169 2,181 726 7.05 82.6 Chloroplast/Nucleus NcSABATH3 evm.model.Contig394.265 + 1,806 1,098 365 5.42 41.4 Cytoplasm/Nucleus NcSABATH4 evm.model.Contig52.38 − 1,994 1,113 370 5.43 41.5 Cytoplasm NcSABATH5 evm.model.Contig52.39 − 5,955 1,332 443 5.57 50 Cytoplasm/Nucleus NcSABATH6 evm.model.Contig481.103 − 2,529 408 135 5.64 15.2 Cytoplasm NcSABATH7 evm.model.Contig267.36 + 3,483 1,125 374 5.96 42 Cytoplasm NcSABATH8 evm.model.Contig480.228 + 3,357 1,152 383 5.16 42.2 CytoplasmNucleus NcSABATH9 evm.model.Contig69.51 − 1,574 576 191 4.78 21.7 Cytoplasm/Nucleus NcSABATH10 evm.model.Contig69.50 − 1,574 576 191 4.78 21.7 Cytoplasm/Nucleus NcSABATH11 evm.model.Contig21.35 − 1,968 1,095 364 5.16 40.9 Cytoplasm/Nucleus NcSABATH12 evm.model.Contig45.442 + 1,953 1,149 382 5.97 42.9 Cytoplasm/Nucleus NcSABATH13 evm.model.Contig66.900 − 828 735 244 6.83 27.2 Cytoplasm NcSABATH14 evm.model.Contig154.585 − 2,437 729 242 5.4 27.3 Cytoplasm NcSABATH15 evm.model.Contig555.236 + 2,570 1,062 353 5.43 39.6 Cytoplasm/Nucleus NcSABATH16 evm.model.Contig437.21 − 29,372 576 191 4.71 21.7 Cytoplasm/Nucleus NcSABATH17 evm.model.Contig371.14 − 761 405 134 8.58 15.3 Cytoplasm NcSABATH18 evm.model.Contig371.16 − 3,054 1,065 354 5.98 40.6 Cytoplasm/Nucleus NcSABATH19 evm.model.Contig892.11 + 2,354 1,050 349 5.2 39.2 Cytoplasm NcSABATH20 evm.model.Contig139.120 + 8,367 789 262 6.46 29.9 Cytoplasm/Nucleus NcSABATH21 evm.model.Contig139.217 − 4,010 1,155 384 5.49 42.5 Cytoplasm NcSABATH22 evm.model.Contig625.59 + 3,023 1,128 375 6.07 42.3 Cytoplasm NcSABATH23 evm.model.Contig1.15 − 2,354 1,050 349 5.28 39.2 Cytoplasm Table 1.
Molecular characteristics of NcSABATH genes in N. cadamba.
Figures
(7)
Tables
(1)