-
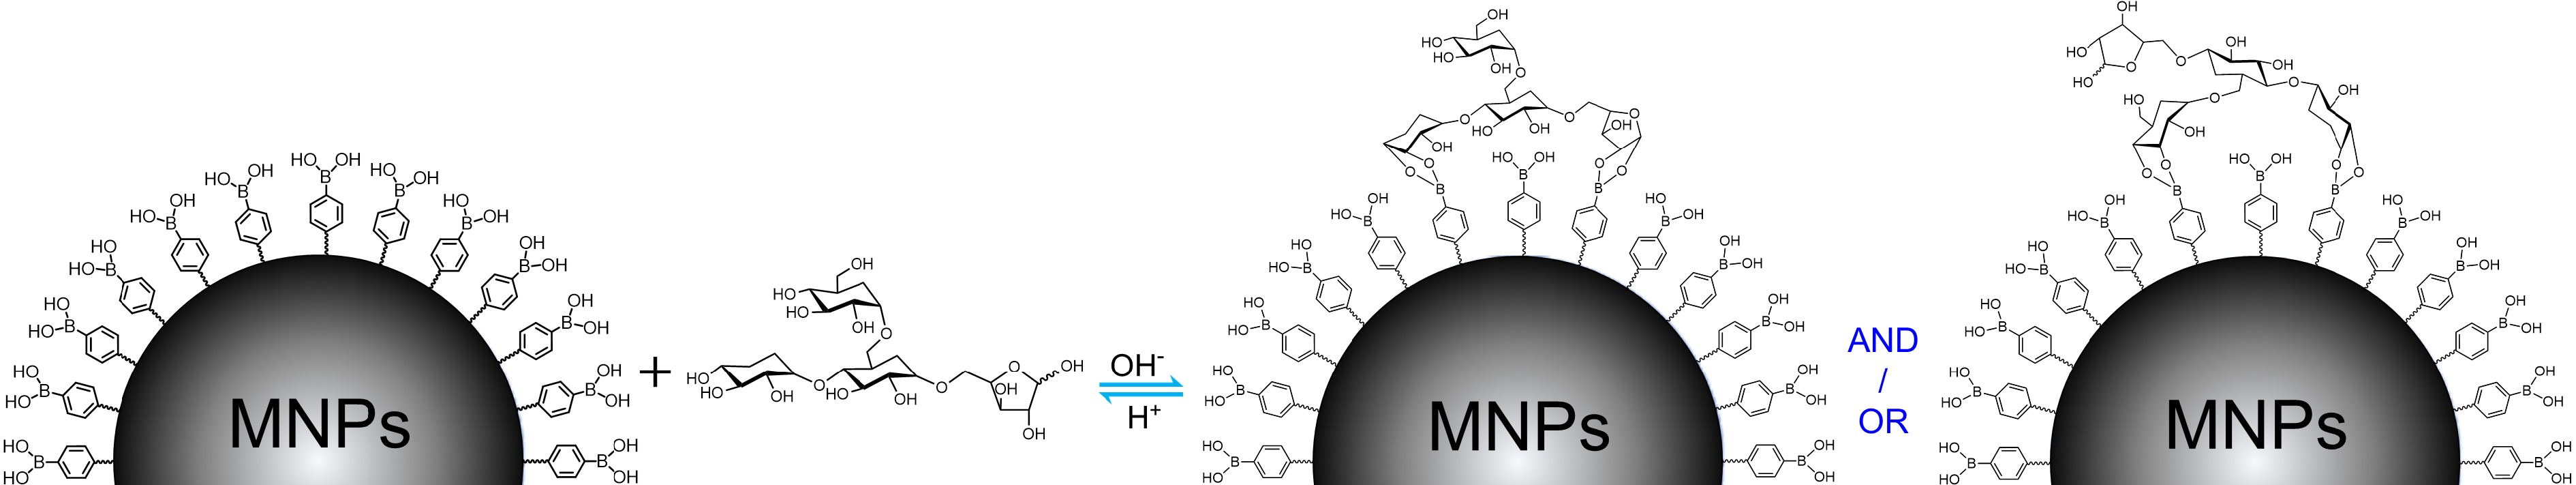
Figure 1.
The general binding mechanism for polysaccharide extraction by boronic acid-decorated MNPs using possible chemical structure of TPS as a representative.
-
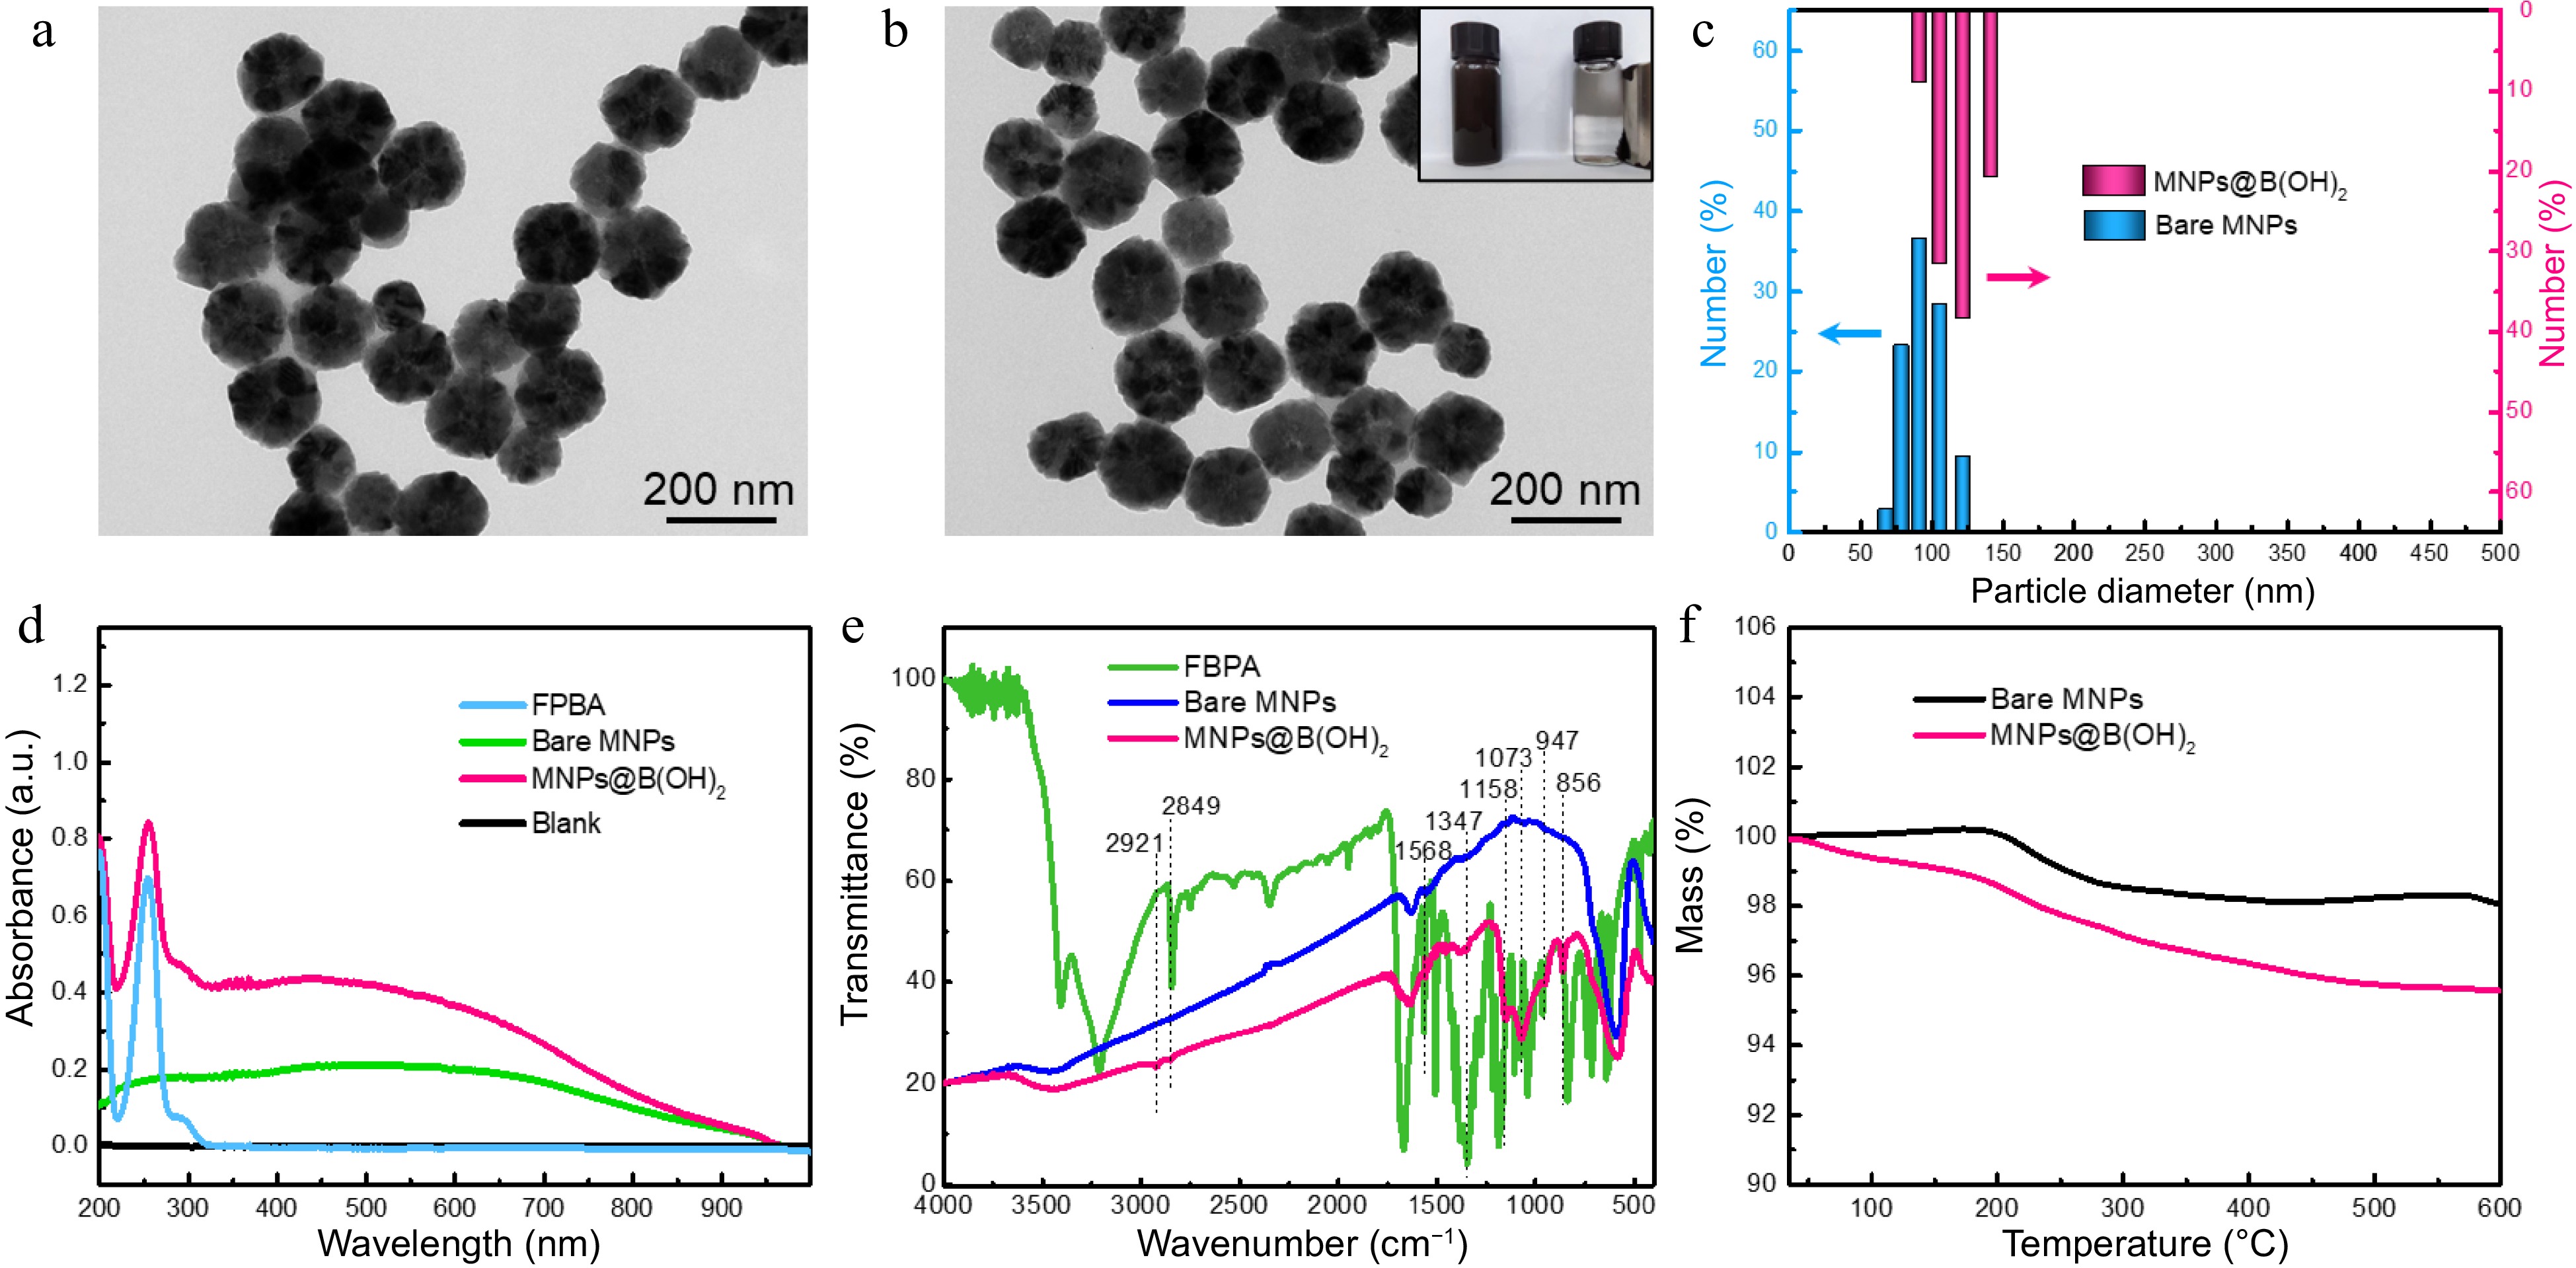
Figure 2.
TEM characterization of (a) bare MNPs and (b) boronic acid-grafted MNPs, along with their particle size distributions analyzed by (c) DLS; (d) UV-vis spectra, (e) FT-IR spectra, and (f) TGA tests of MNPs materials with or without modification by FPBA. Inset in (b) was the digital photo showing the magnetic separation behavior of MNPs@B(OH)2 by an external magnet.
-
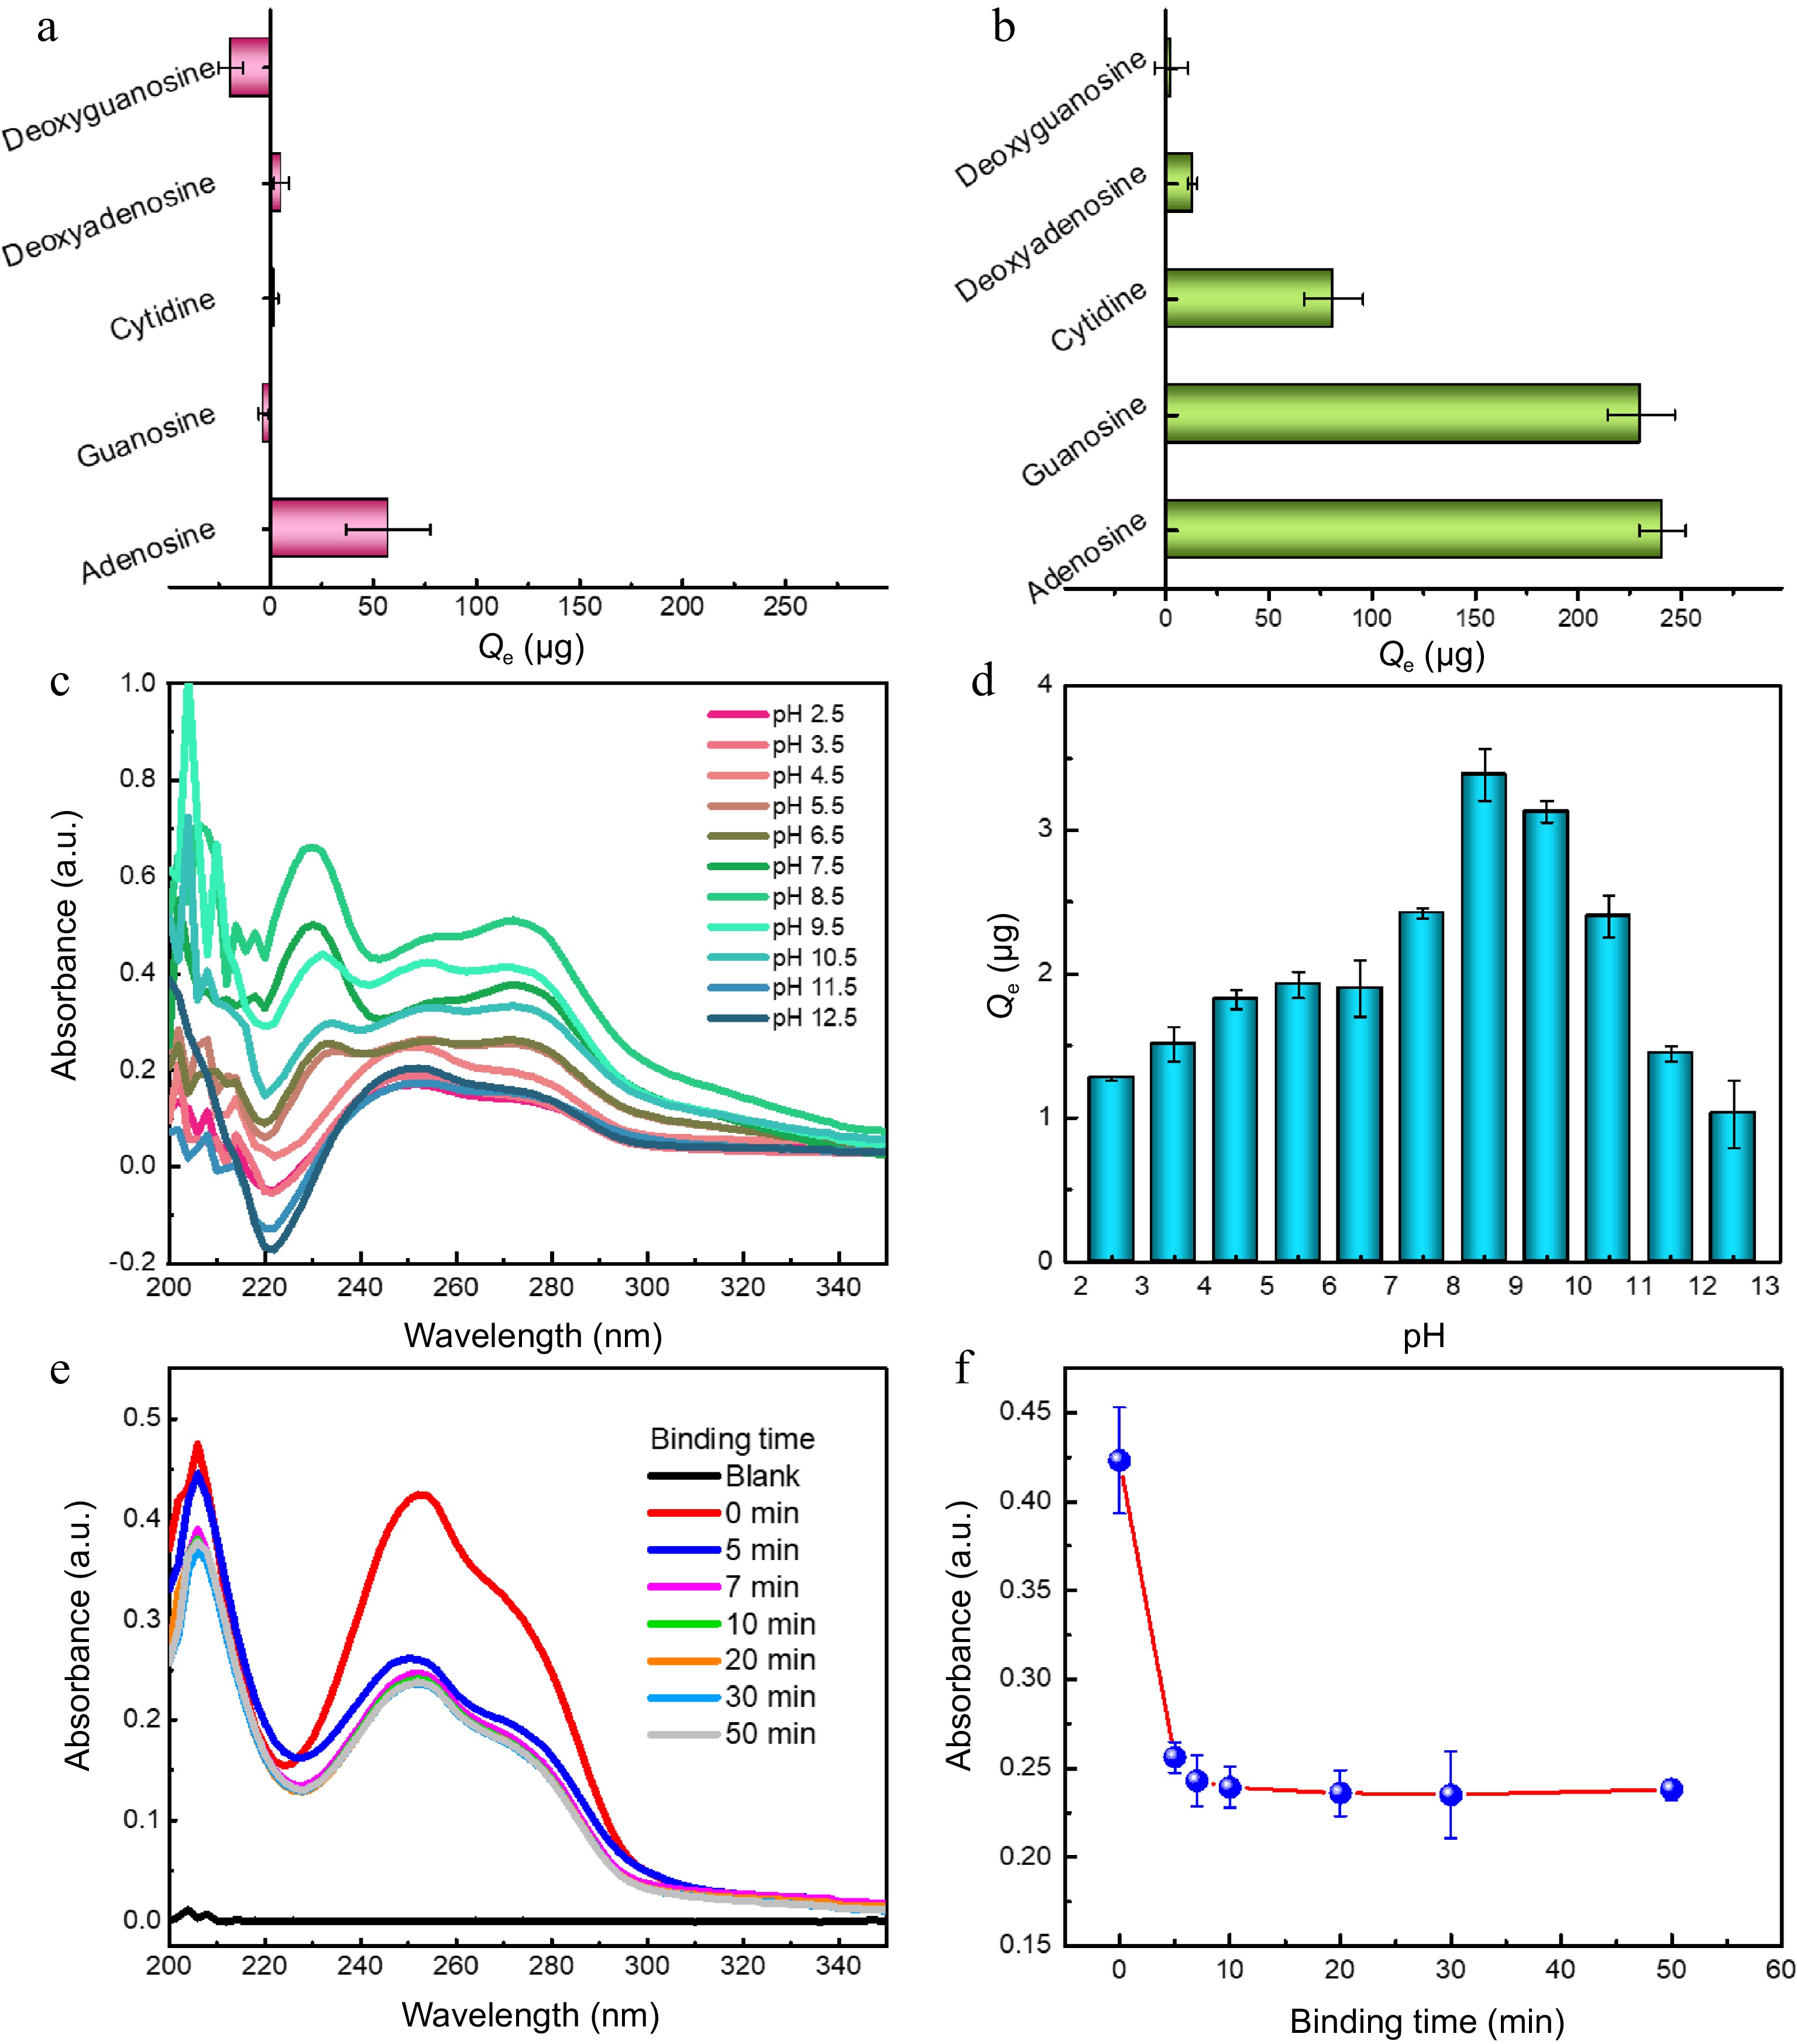
Figure 3.
Binding selectivity of (a) bare MNPs and (b0 MNPs@B(OH)2 toward five model compounds; Typical UV-vis spectra of guanosine extracted by MNPs@B(OH)2 at (c) different pH and their (d) quantitative comparison; (e) UV-vis spectra of guanosine in supernatants after extraction by MNPs@B(OH)2 at different extraction time, and (f) the absorbance of guanosine in supernatants as a function of extraction time. All tests were carried out at least three times in parallel.
-
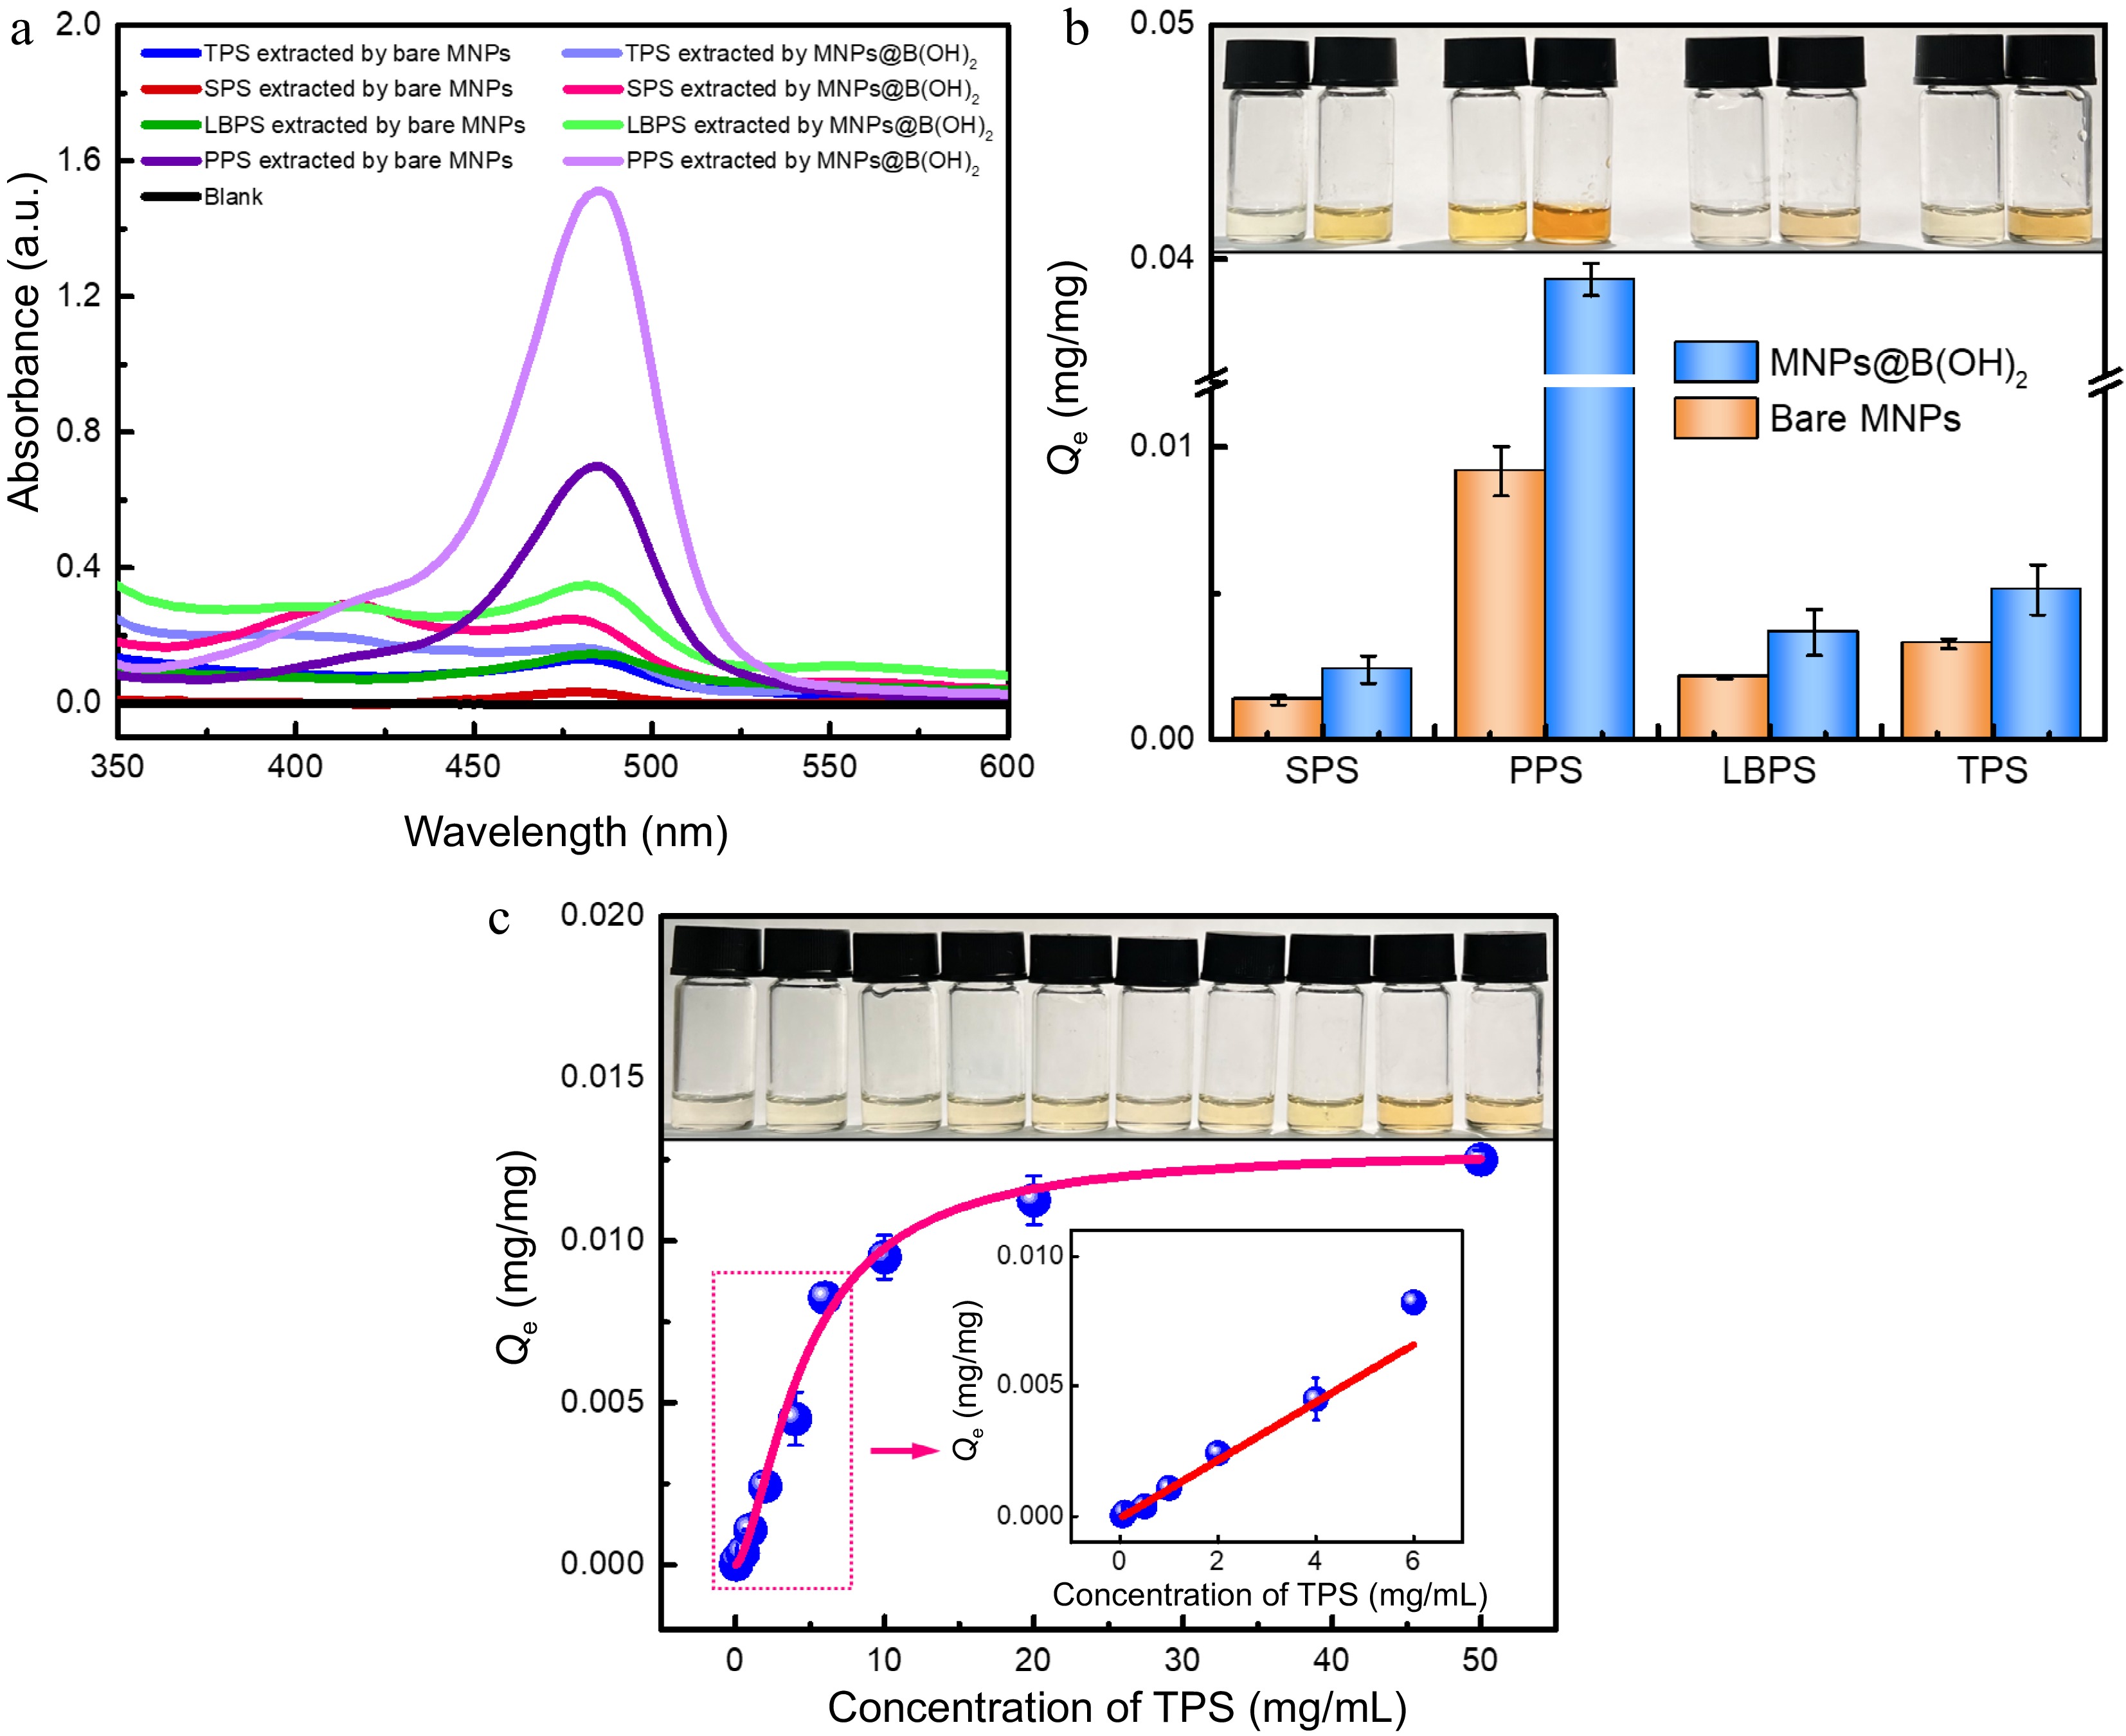
Figure 4.
UV-vis spectra of four polysaccharide extractives by different MNPs after (a) color development by the phenol-sulfuric acid method, and the (b) equilibrium binding capacity of bare MNPs and MNPs@B(OH)2 toward four model polysaccharides, all with a concentration of 1.0 mg/mL); (c) Adsorption isotherms for TPS binding to MNPs@B(OH)2. Insets in (b) and (c): digital photos of polysaccharide extractives (derived by phenol-sulfuric acid chromogenic reaction) with the same order as relevant horizontal axis. Diagrams inserted in (c): linear fitting in the working range of 0.05~6.0 mg/mL (y = 0.0445x − 0.0029, R2 = 0.9579). All measurements were repeated in triplicate at least for quantitative calculations.
-
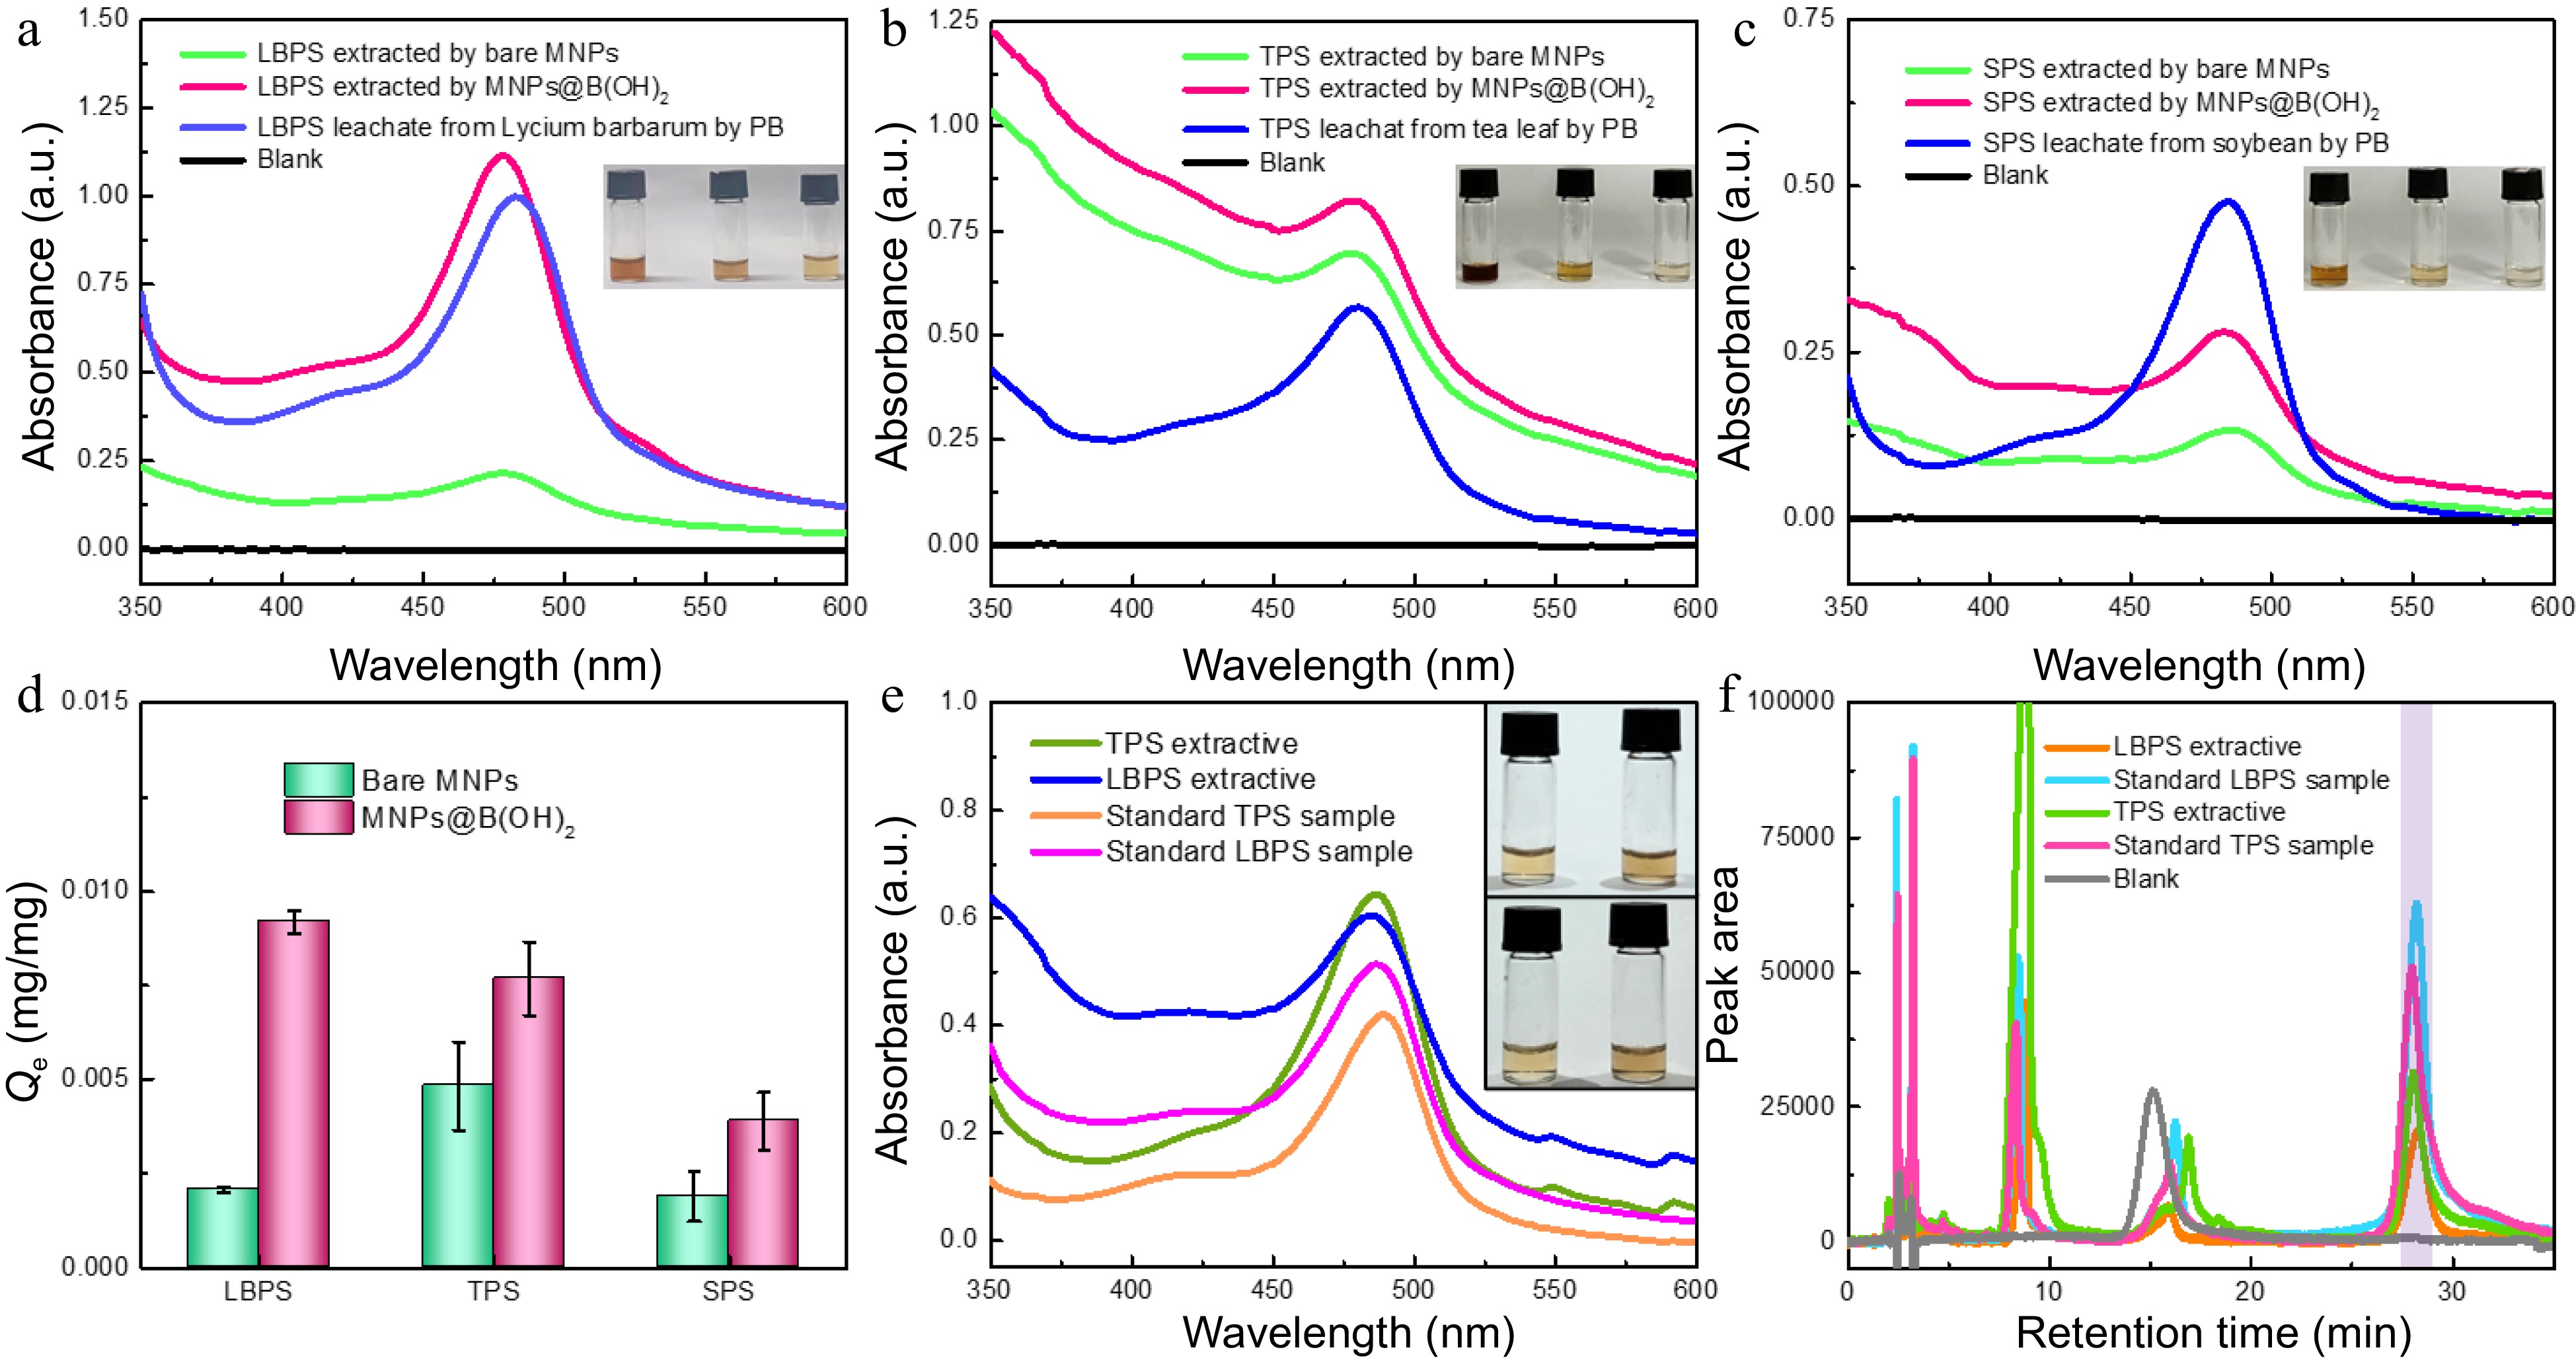
Figure 5.
UV-vis spectra of polysaccharide leaching liquors and extracts from (a) Lycium barbarum, (b) tea leaves and (c) soybeans by different materials. The comparison in extraction performance of bare MNPs and MNP@B(OH)2 (d, n = 3); (e) UV-vis spectra of TPS and LBPS extractives (1.0 mg/mL) and standard polysaccharide solutions (0.5 mg/mL); (f) HPLC chromatograms of TPS and LBPS extractives (1.0 mg/mL for TPS, and 0.5 mg/mL for LBPS) and standard polysaccharide solutions (0.5 mg/mL for TPS, and 0.3 mg/mL for LBPS) after labelling with PMP , in which light violet zone indicated the peak position of polysaccharides. Insets in (a)−(c) were, respectively, the digital photos of relevant polysaccharides obtained in different pathways after color development with phenol-sulfuric acid chromogenic method, and the order was leachates and the extractives by MNPs@B(OH)2 and bare MNPs from left to right. The inset in (e) was the photos of polysaccharide extractives (top) and standard polysaccharide samples (bottom) of TPS (left) and LBPS (right) with the same concentrations as UV-vis spectra tests. All UV-vis spectrograms were obtained after phenol-sulfuric acid chromogenic reaction.
-
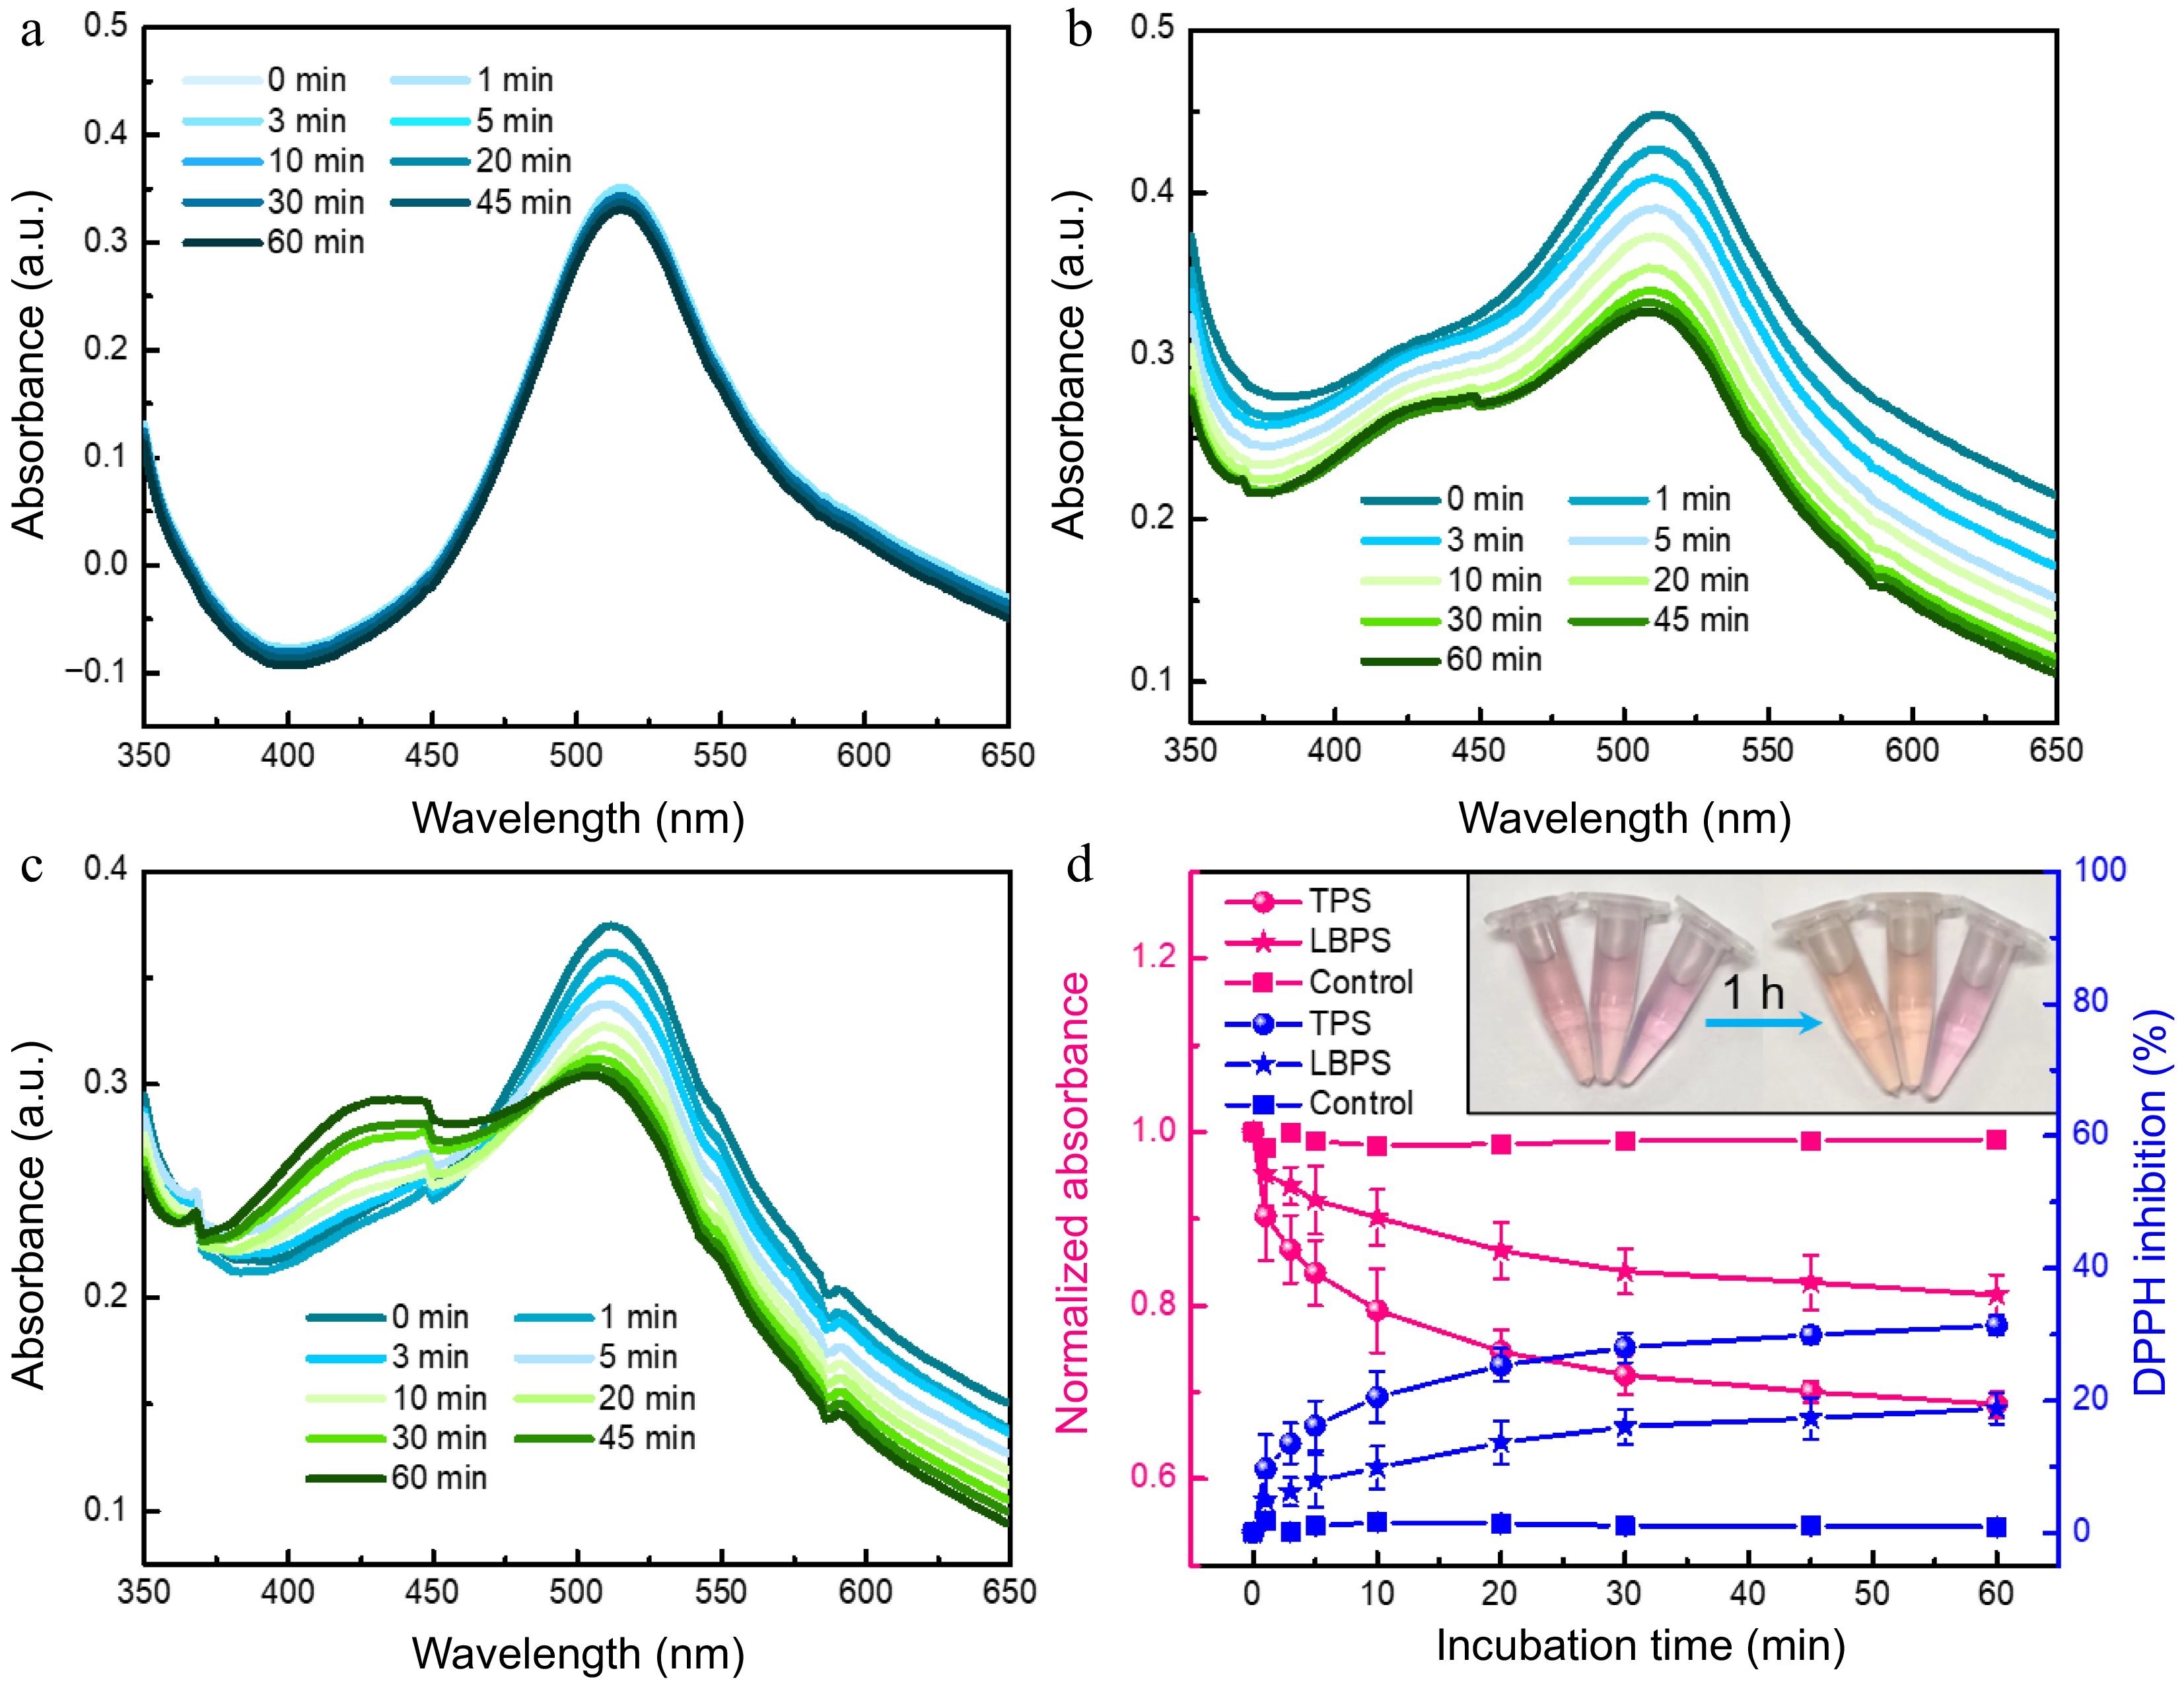
Figure 6.
UV-vis spectra of (a) DPPH, (b) TPS- and (c) LBPS- added DPPH obtained at incubation time ranging from 0 to 60 min. Antioxidant ability of TPS and LBPS assessed by DPPH scavenging activity assay (d, n = 3). The final concentration of both TPS and LBPS added in DPPH was 0.2 mg/mL.
-
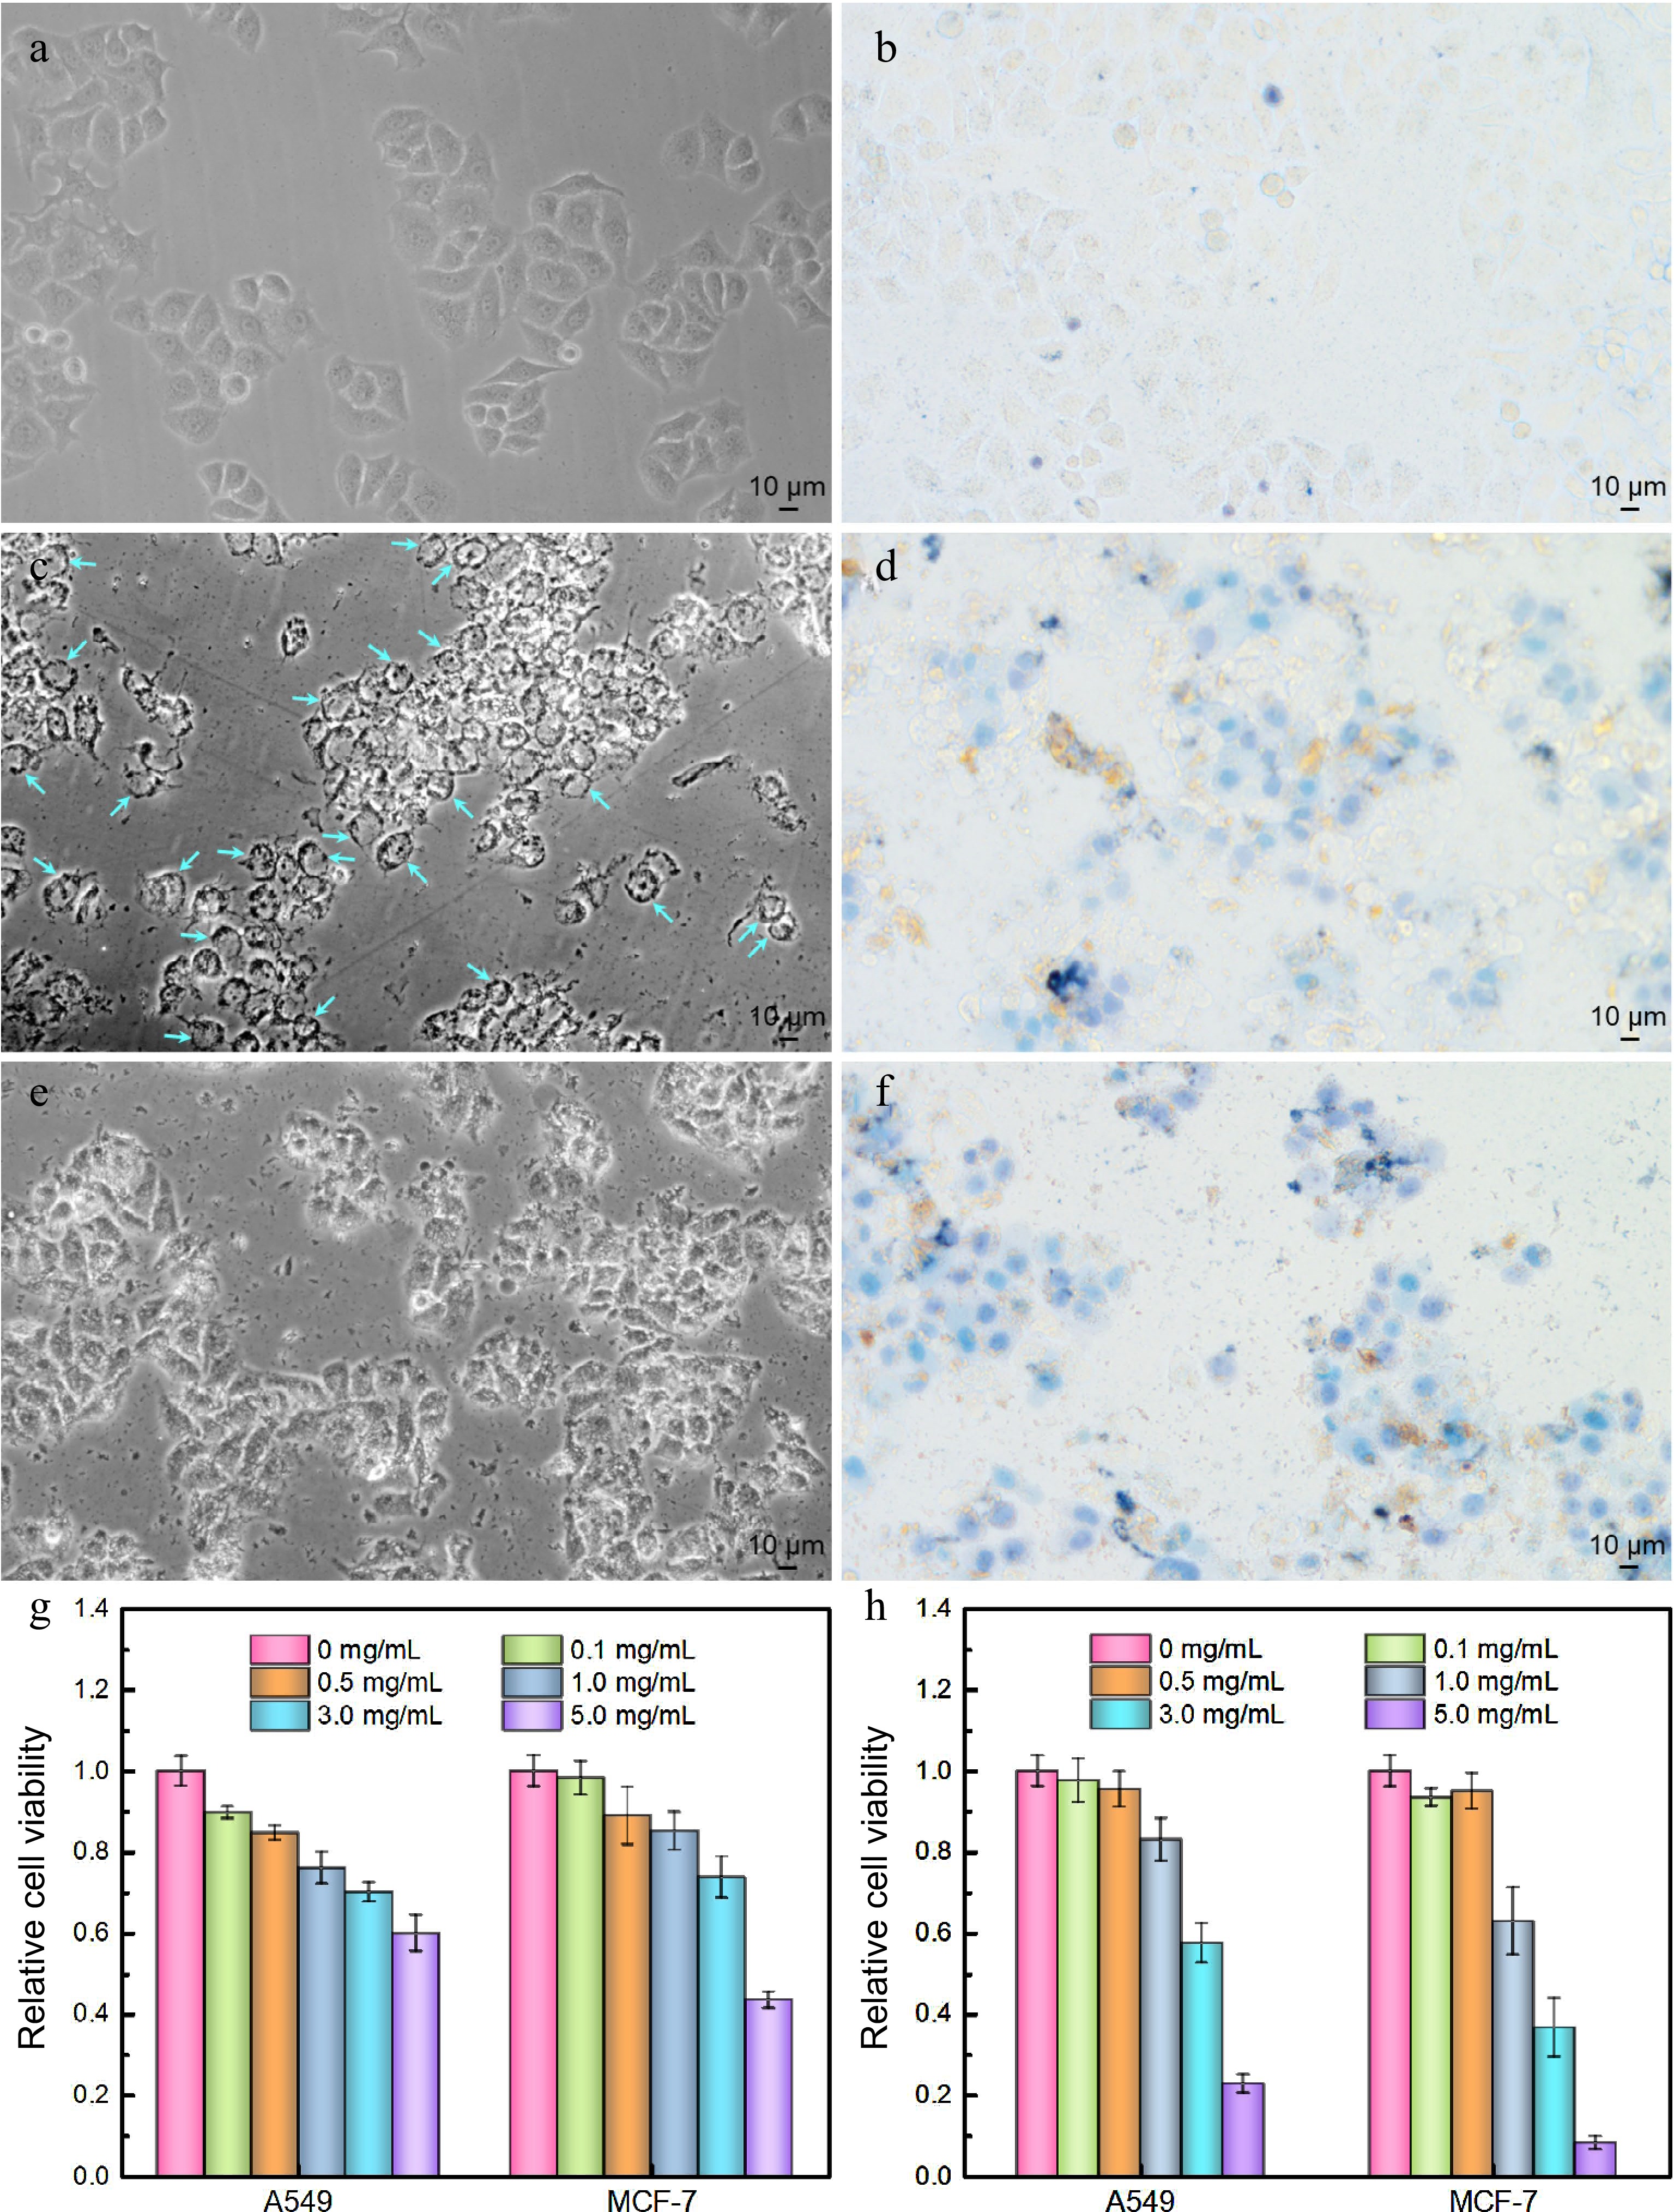
Figure 7.
Antitumor activities of polysaccharide extracts assessed by optical microscopic imaging (a) − (f) using MCF-7 cells as a model cell line and (g), (h) MTT assays. (a) Cell imaging of control group, (b) trypan blue stained control group, (c) LBPS-treated group, (d) trypan blue stained LBPS-treated group, (e) TPS-treated group, and (f) trypan blue stained TPS-treated group. The dosage of TPS and LBPS in (c) − (f) was set as 5.0 mg/mL. Relative cell viabilities of A549 and MCF-7 cells after administrating by (g) LBPS and (h) TPS by MTT assays. Blue arrows in (c) on behalf of the typical vacuolated cells.
Figures
(7)
Tables
(0)