-
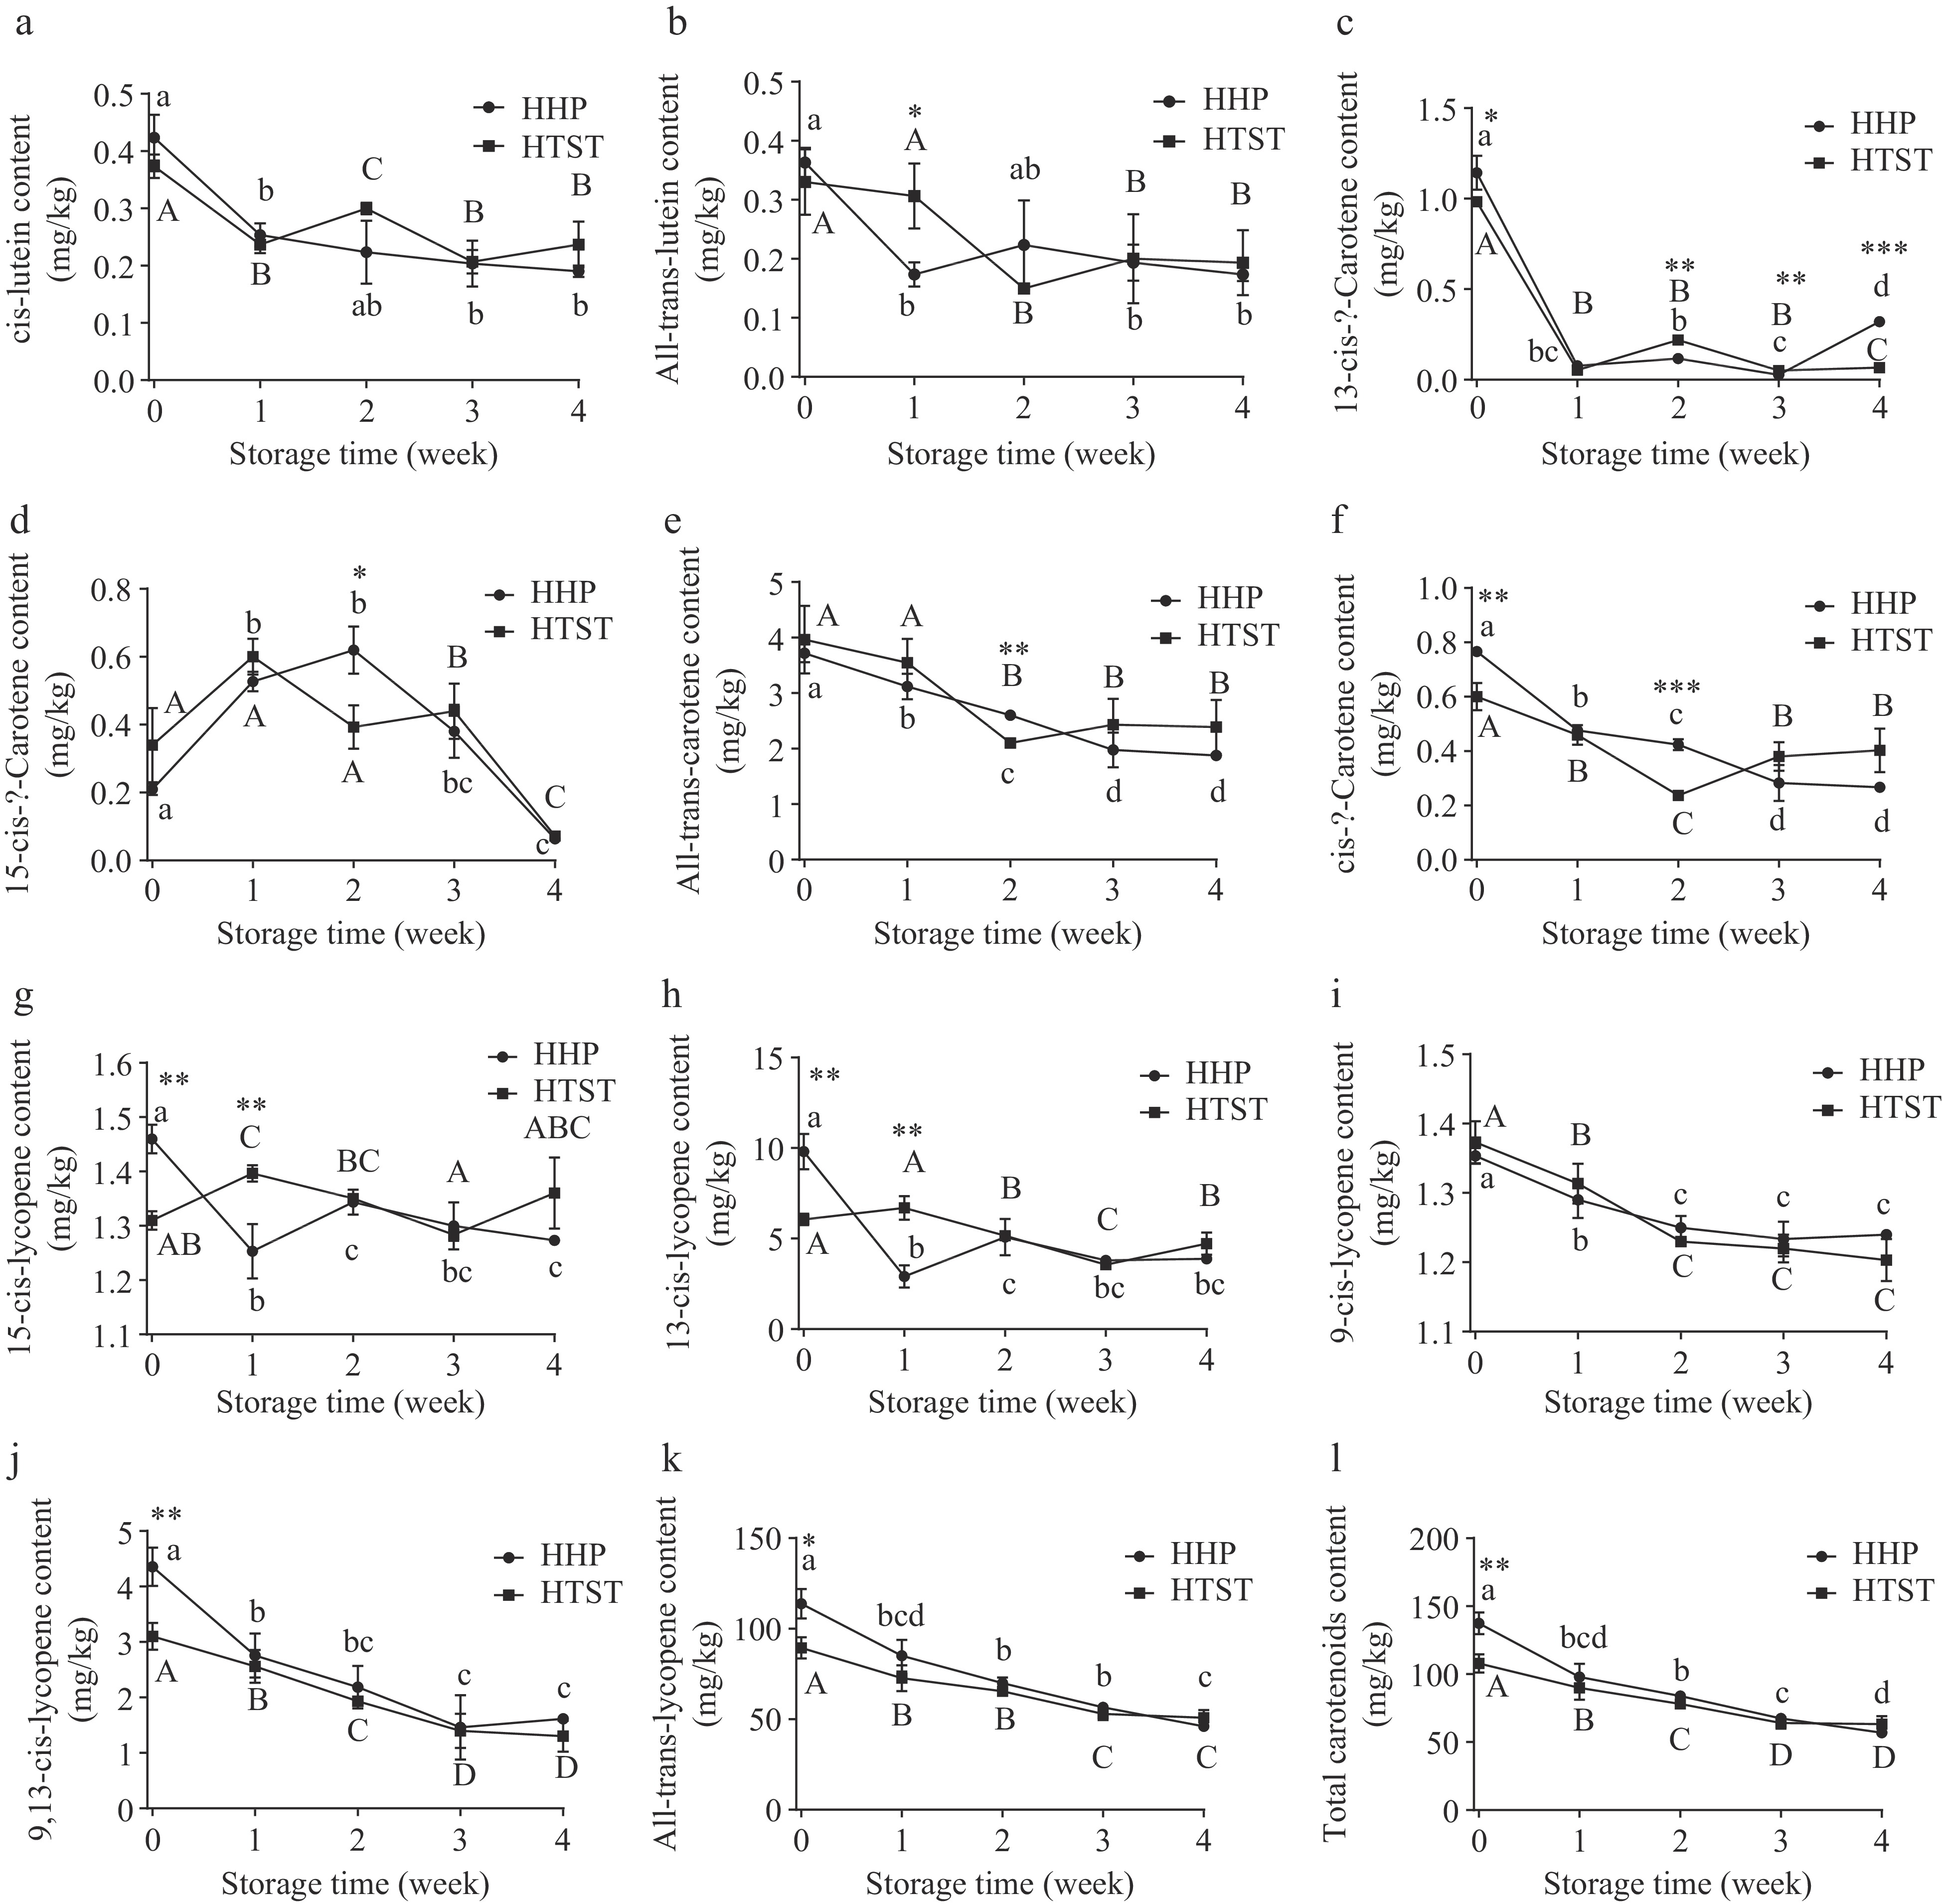
Figure 1.
Carotenoid content was evaluated in treated tomato juice during storage. Lowercase and uppercase letters refer to the HHP group and HTST group, respectively, and different letters indicate significant differences (p < 0.05). *p < 0.05, ** p < 0.01, *** p < 0.001 HHP vs HTST at the same storage time.
-
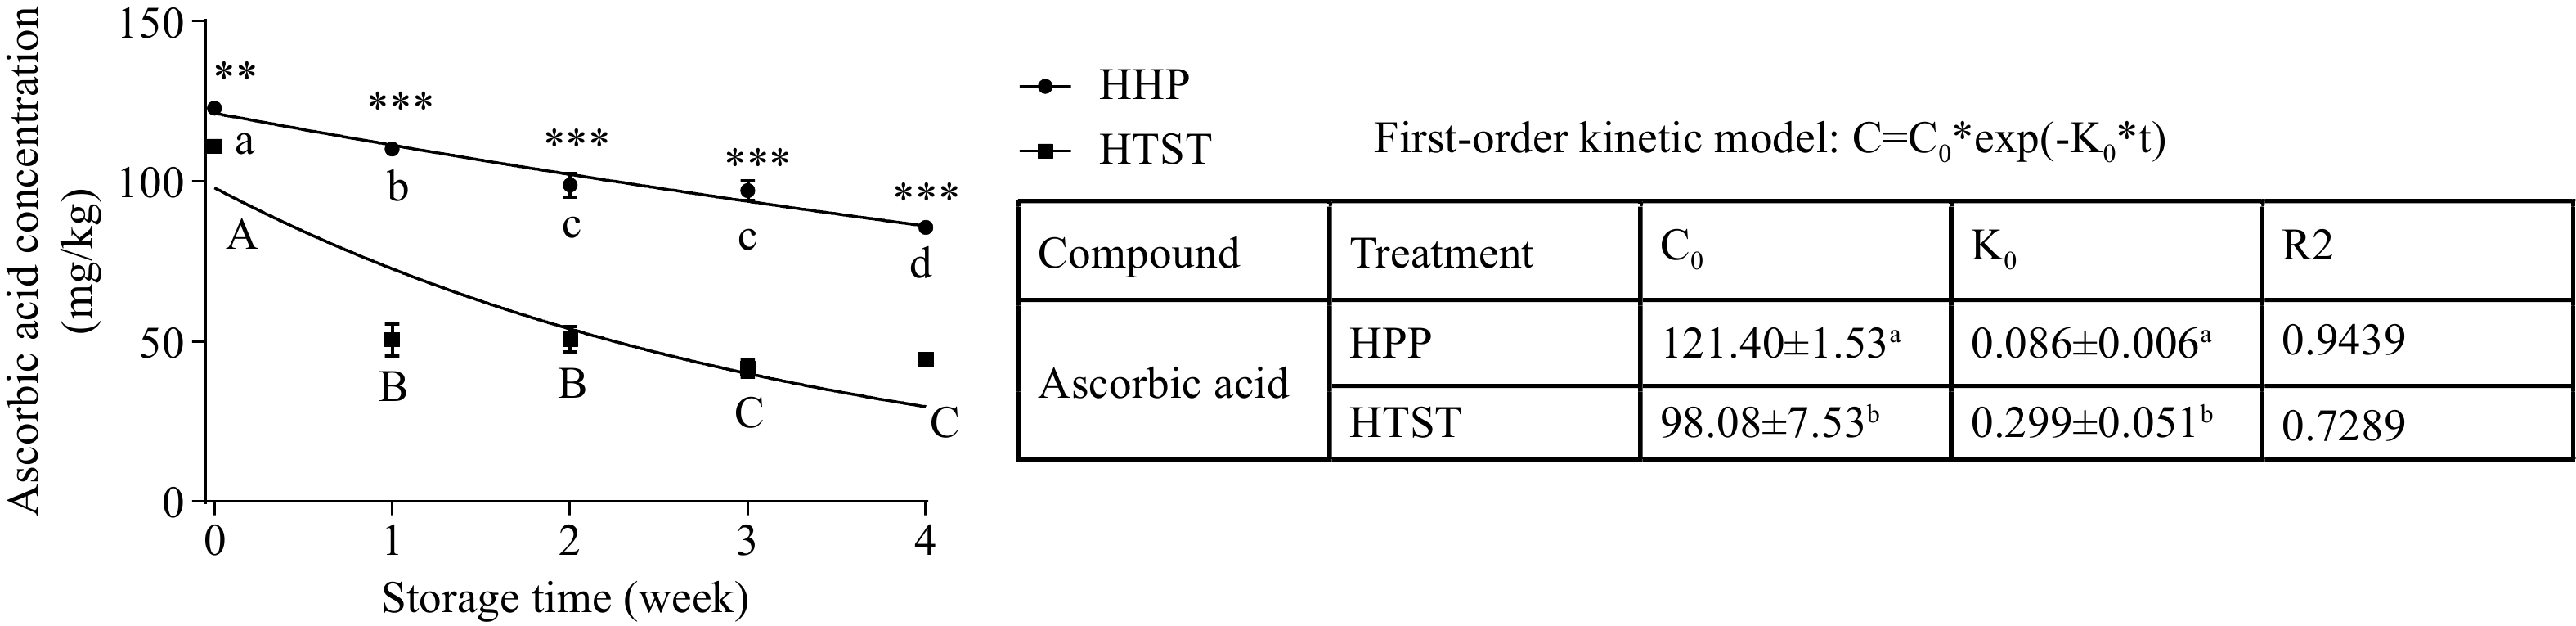
Figure 2.
Ascorbic acid content and kinetic model evaluated in treated tomato juice during storage. Lowercase and uppercase letters refer to the HHP group and HTST group, respectively, and different letters indicate significant differences (p < 0.05). * p < 0.05, ** p < 0.01, *** p < 0.001 HHP vs HTST at the same storage time.
-

Figure 3.
Polyphenol content was evaluated in treated tomato juice during storage. Lowercase and uppercase letters refer to the HHP group and HTST group, respectively, and different letters indicate significant differences (p < 0.05). * p < 0.05, ** p < 0.01, *** p < 0.001 HHP vs HTST at the same storage time.
-
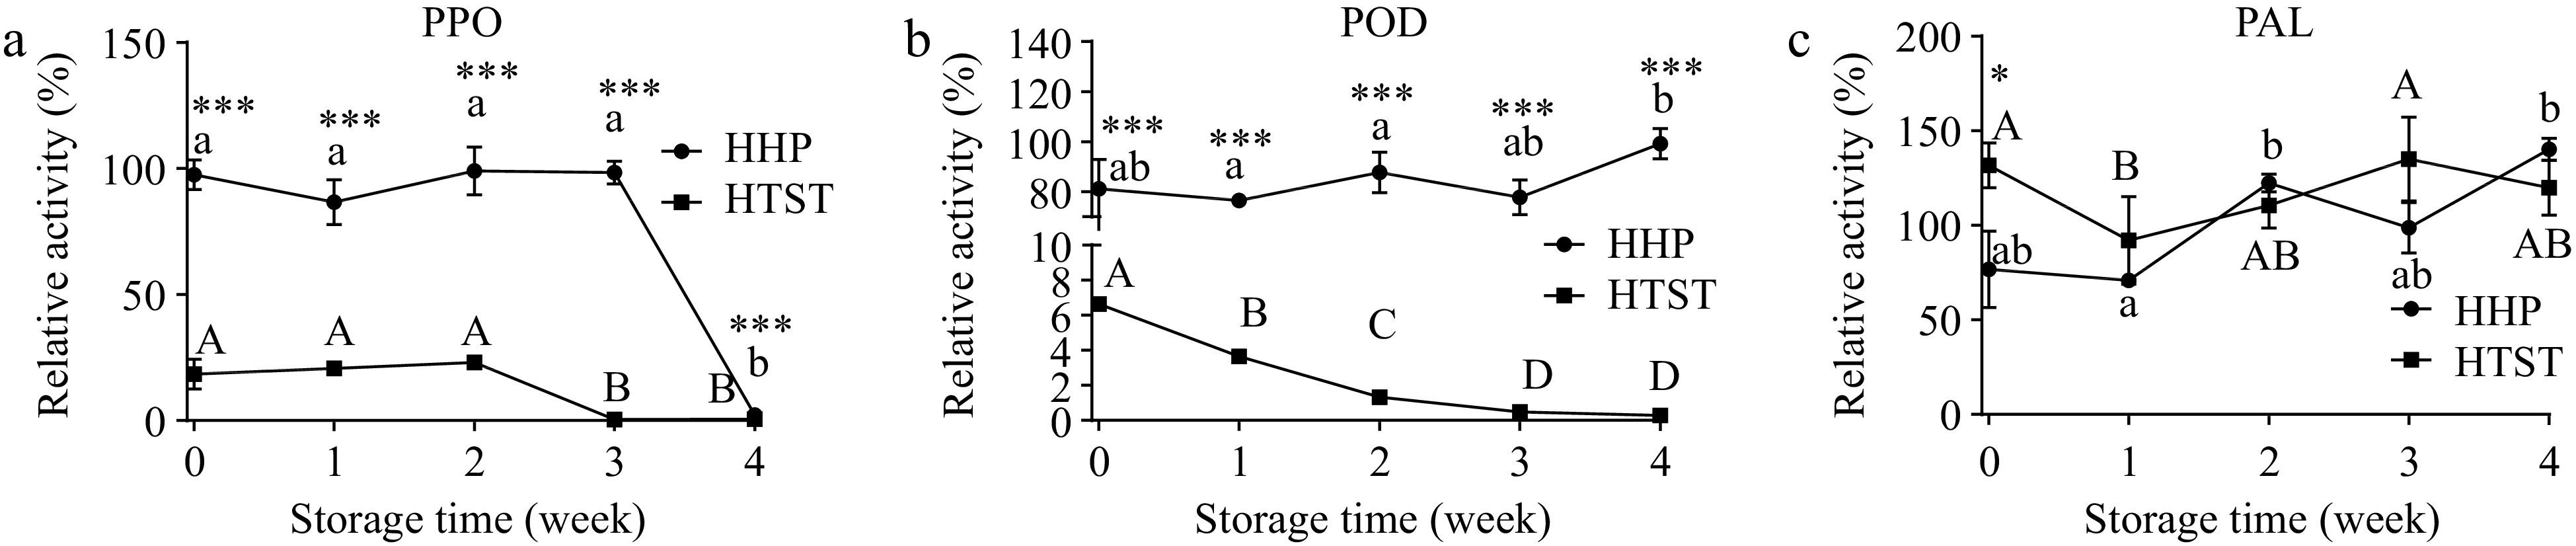
Figure 4.
POD, PPO, and PAL enzyme activity were evaluated in treated tomato juice during storage. Lowercase and uppercase letters refer to the HHP group and HTST group, respectively, and different letters indicate significant differences (p < 0.05). * p < 0.05, ** p < 0.01, *** p < 0.001 HHP vs HTST at the same storage time.
-
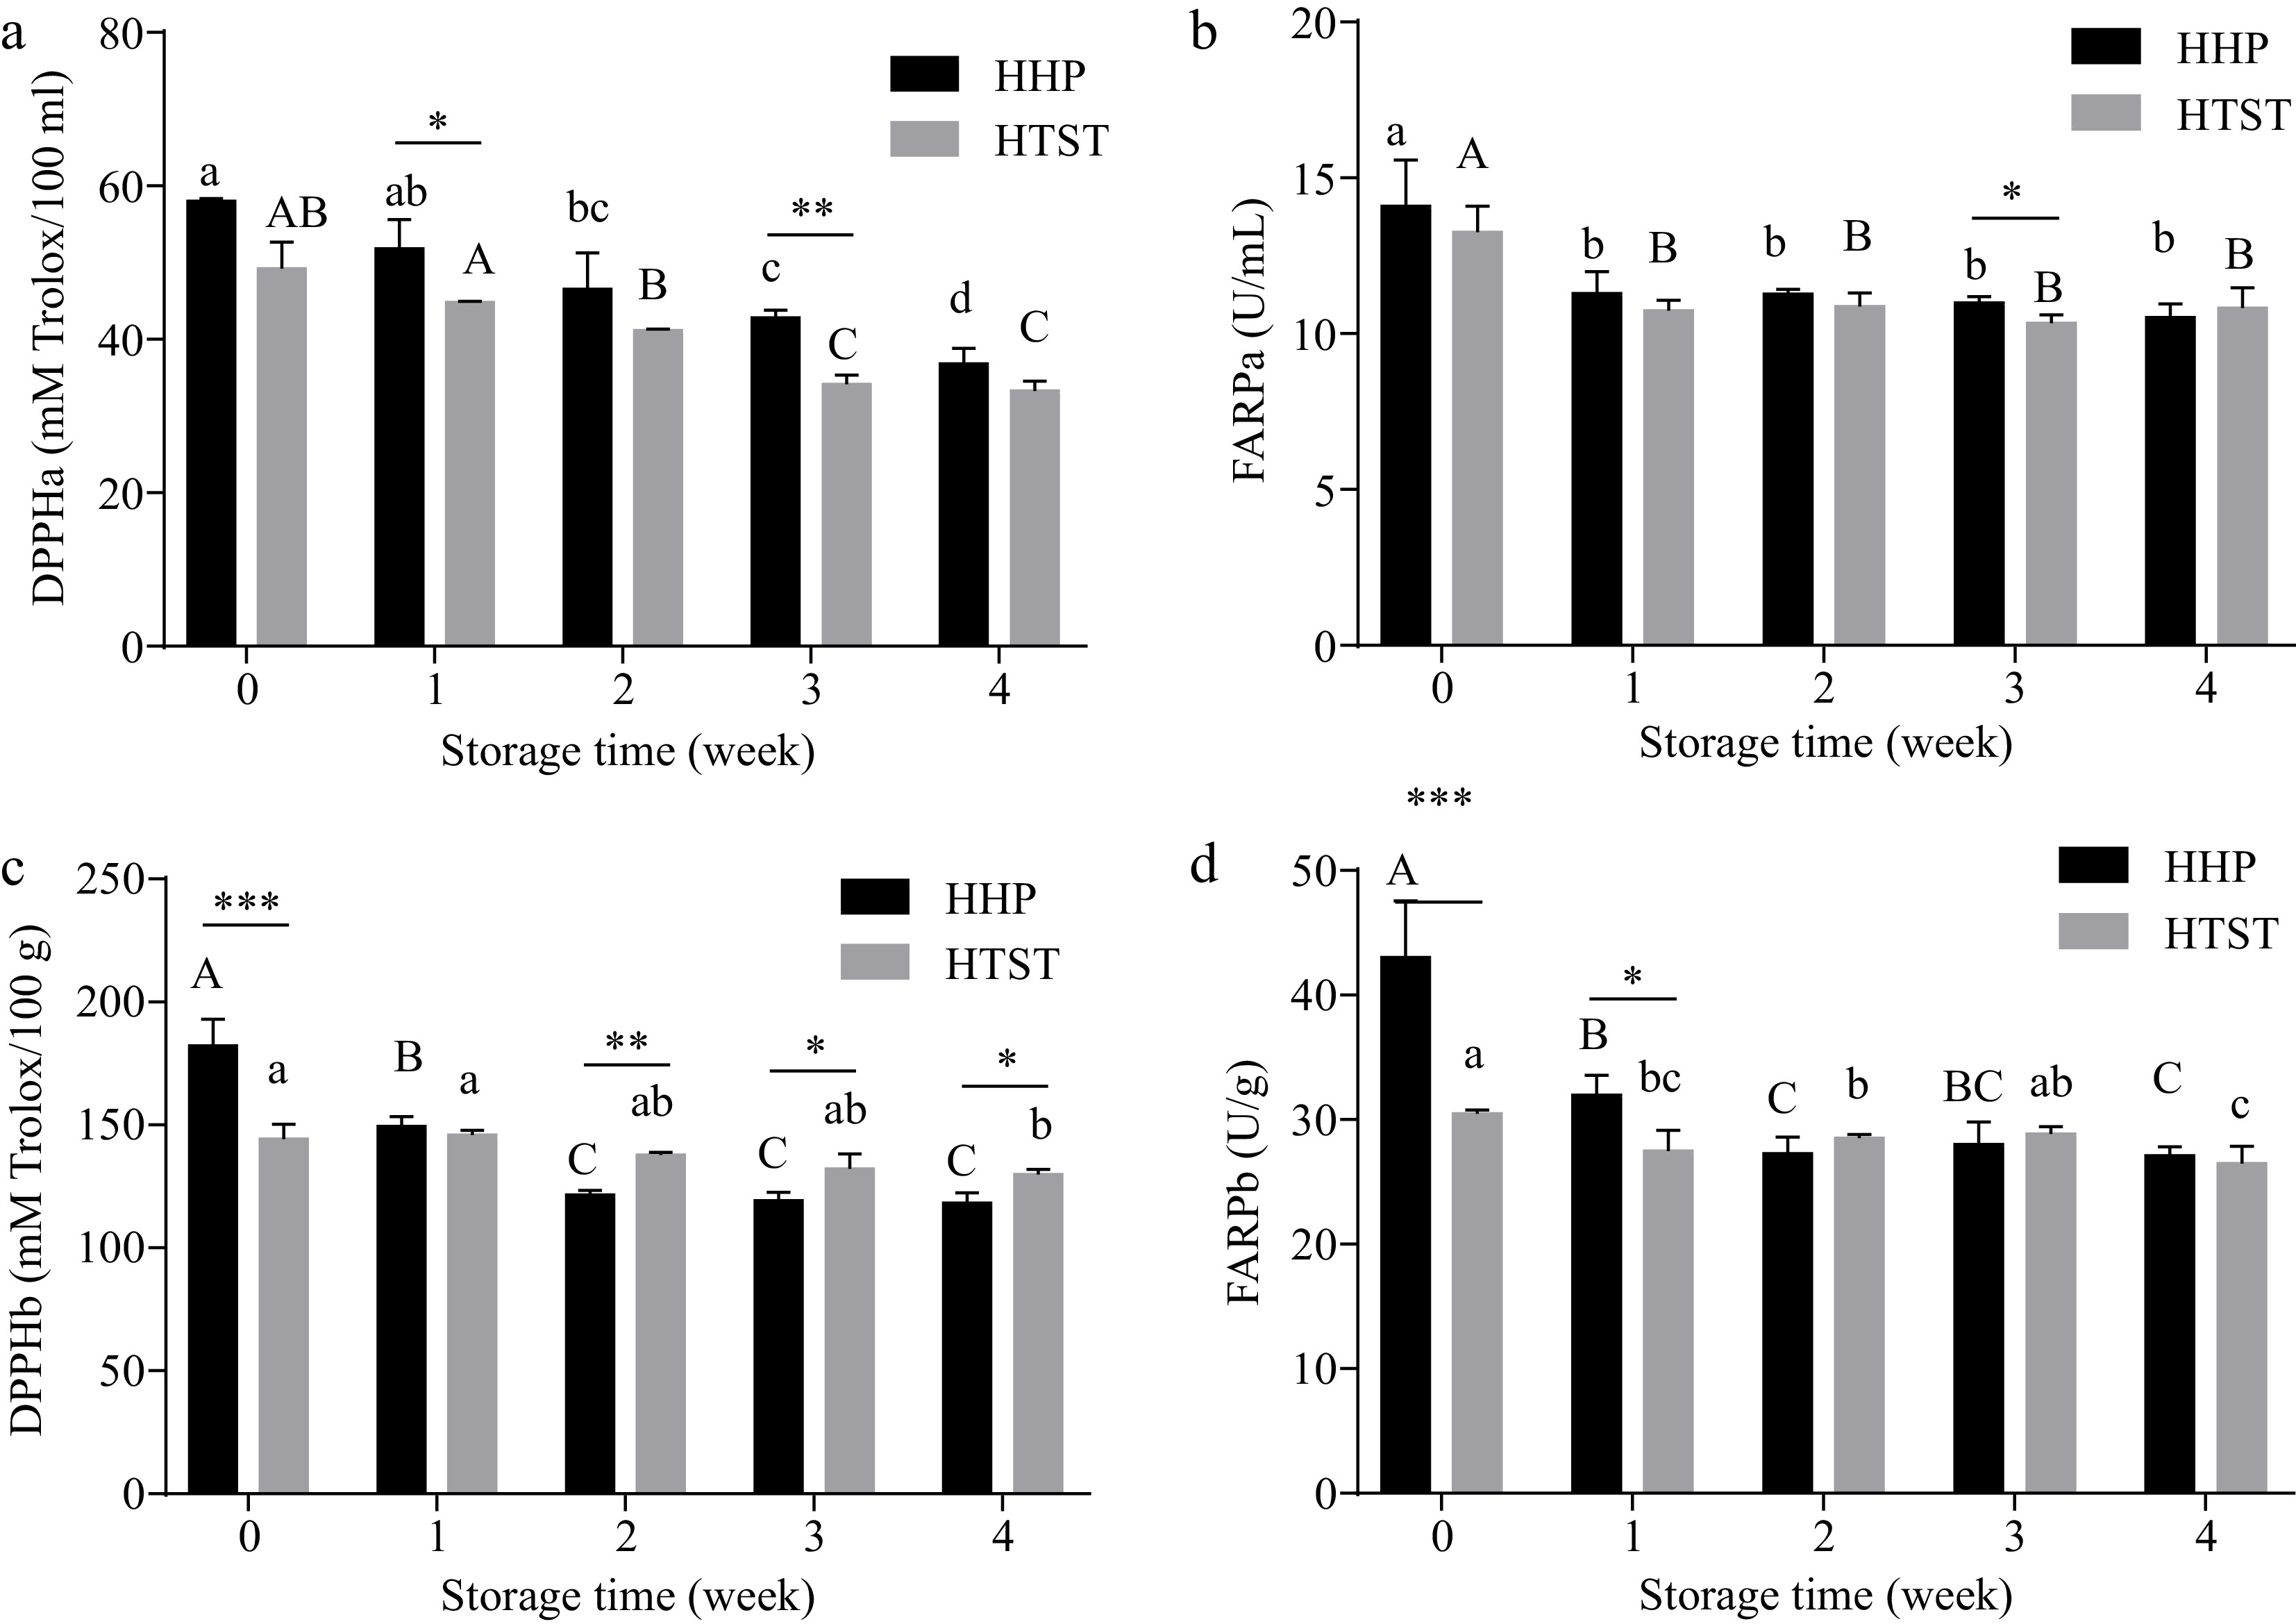
Figure 5.
Antioxidant compacity was evaluated of hydrophilic and lipophilic fractions from tomato juice treated by HPP and HTST processing after storage. DPPHa and FARPa represent antioxidant capacity in hydrophilic fractions of tomato juice, and DPPHb and FARPb represent antioxidant capacity in lipophilic fractions. Lowercase and uppercase letters refer to the HPP and HTST groups, respectively, and different letters indicate significant differences (p < 0.05). * p < 0.05, ** p < 0.01, *** p < 0.001 HHP vs HTST at the same storage time.
-
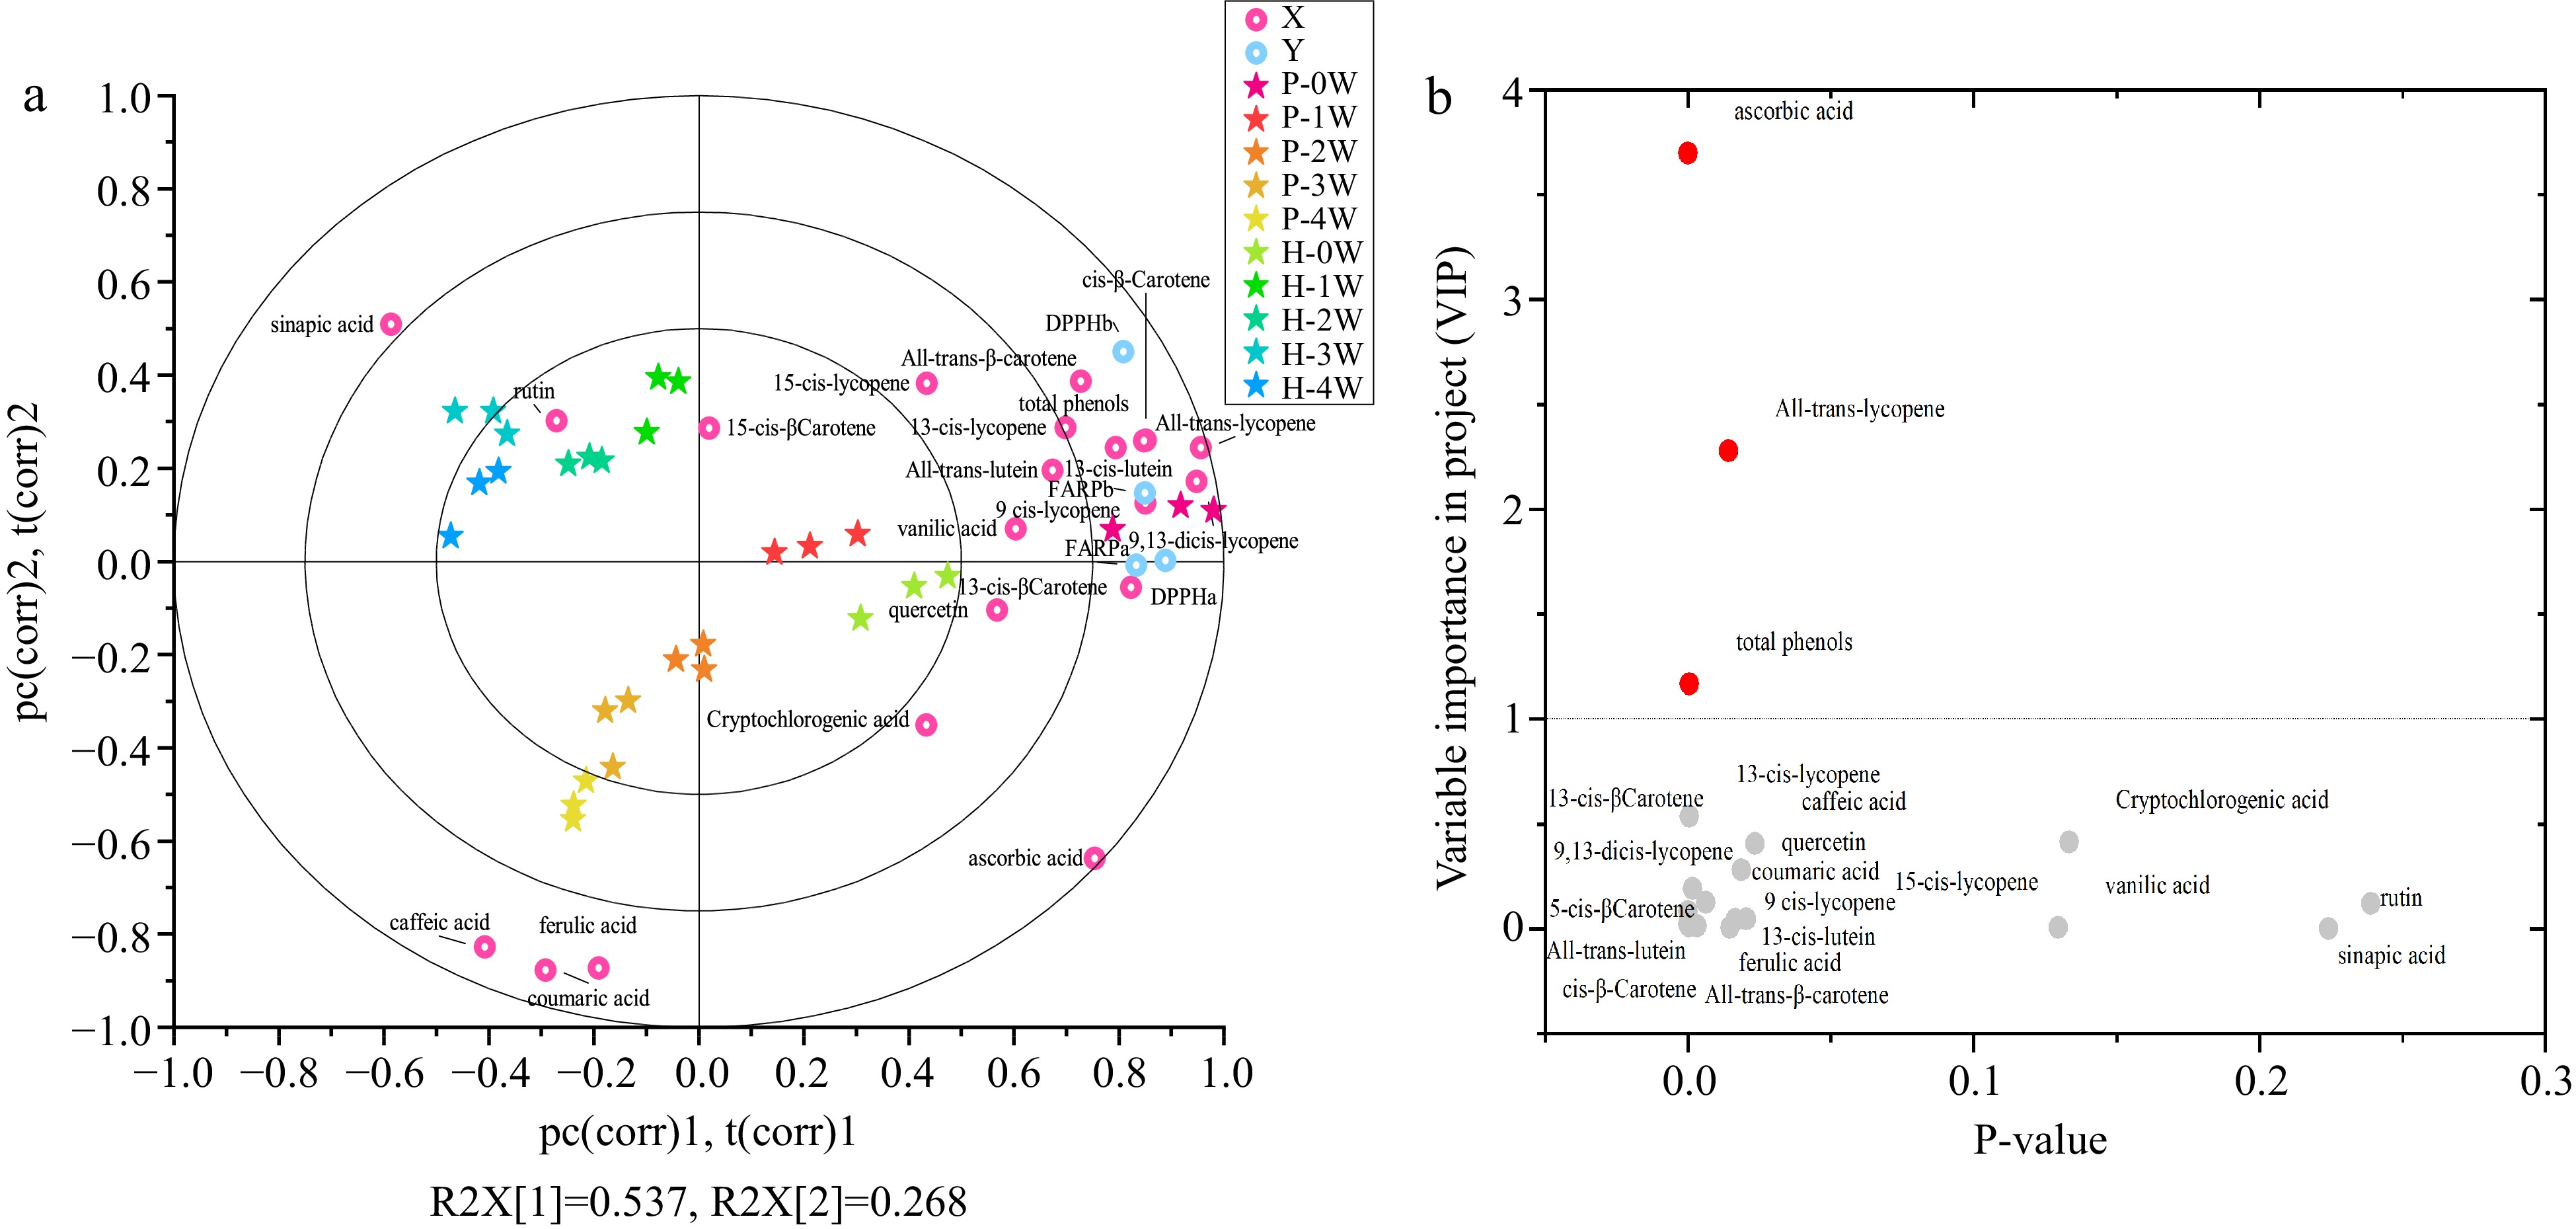
Figure 6.
(a) The PLS biplot shows the correlation of the antioxidant compounds variations with antioxidant compacity of treated tomato juice during storage. (b)Volcano plots for differential compounds in P-1W juice samples compared with P-0W samples. Each point in the volcanic plot represents an antioxidant compound. The red dots represent differential antioxidant compounds, and the grey dots represent antioxidant compounds that did not change significantly.
-
Treatment Storage time (weeks) 0 1 2 3 4 Total viable count
(Log10cfu/mL)Fresh 7.92 ± 0.13 HHP 1.85 ± 0.02a 1.73 ± 0.02b 1.88 ± 0.11a 1.45 ± 0.02c 1.87 ± 0.03b HTST 1.77 ± 0.16ab 1.55 ± 0.06a 1.86 ± 0.12ab 1.39 ± 0.32ab 1.89 ± 0.09b Yeasts and molds
(Log10cfu/mL)Fresh 2.97 ± 0.18 HHP ND ND ND ND ND HTST ND ND ND ND ND Mean values ± SD (n = 3) with different lowercase letters in the same row indicate significant differences (p < 0.05). ND: below the detection limit. Table 1.
Microbial levels in treated tomato juice during storage.
-
Treatments Fresh HHP HTST Carotenoids (μg/ml) All-trans-lutein 0.25 ± 0.05a 0.36 ± 0.02b 0.33 ± 0.05ab 13-cis-lutein 0.41 ± 0.04a 0.42 ± 0.04a 0.37 ± 0.02a 13-cis-β-Carotene 0.93 ± 0.13a 1.15 ± 0.10b 0.98 ± 0.02ab 15-cis-β-Carotene 0.31 ± 0.02a 0.21 ± 0.01a 0.34 ± 0.11a All-trans-β-carotene 3.40 ± 0.76a 3.72 ± 0.16a 3.97 ± 0.61a cis-β-Carotene 0.62 ± 0.04a 0.77 ± 0.01b 0.60 ± 0.05a 15-cis-lycopene 1.31 ± 0.02a 1.46 ± 0.03b 1.31 ± 0.02a 13-cis-lycopene 5.87 ± 0.50a 9.81 ± 0.98b 6.06 ± 0.32a 9-cis-lycopene 1.35 ± 0.03a 1.36 ± 0.01a 1.37 ± 0.03a 9,13-dicis-lycopene 3.07 ± 0.42a 4.36 ± 0.35b 3.10 ± 0.24a All-trans-lycopene 92.60 ± 10.74a 113.80 ± 8.20b 89.46 ± 5.84a Total Carotenoids 110.11 ± 11.95a 137.41 ± 7.99b 107.895 ± 6.76a Ascorbic acid (μg/ml) Ascorbic acid 125.09 ± 5.27a 122.92 ± 1.18a 111.07 ± 0.41b Polypenols (μg/g) Cryptochlorogenic acid 47.72 ± 3.03a 48.32 ± 3.81a 44.33 ± 2.39a Caffeic acid 11.45 ± 1.05a 9.80 ± 1.77a 9.86 ± 0.62a p-Coumaric acid 4.10 ± 0.92a 2.82 ± 0.54b 1.34 ± 0.12c Ferulic acid 4.56 ± 0.55a 2.07 ± 0.23b 1.39 ± 0.07b Rutin 9.48 ± 0.95a 12.37 ± 0.64b 17.75 ± 1.70c Quercetin 5.64 ± 0.43a 5.41 ± 0.43a 2.95 ± 0.12b Vanillic acid 0.95 ± 0.03a 0.75 ± 0.04b 0.52 ± 0.01c Sinapic acid 0.26 ± 0.03a 0.39 ± 0.03a 0.28 ± 0.03a Total phenols
(mg GAE /100 g)Total phenols 49.60 ± 2.28a 49.85 ± 2.47a 36.29 ± 2.17b Antioxidant activity DPPHa (mm Torlox /100 ml) 56.78 ± 2.89a 56.41 ± 2.88a 50.85 ± 6.27a FRAPa (U/ml) 17.46 ± 0.07a 14.09 ± 1.48b 13.26 ± 0.83b DPPHb (mm Torlox /100 g) 189.58 ± 17.61a 188.37 ± 1.40a 144.25 ± 6.09b FRAPb (U/g) 39.68 ± 0.53a 45.58 ± 0.97b 30.48 ± 0.28c Mean values ± SD (n = 3) with different lowercase letters in the same row indicate significant differences (P < 0.05). DPPHa and FRAPa represent antioxidant capacity in hydrophilic fractions of tomato juice, and DPPHb and FRAPb represent antioxidant capacity in lipophilic fractions. Table 2.
The effect of HHP and HTST treatment on carotenoids, polyphenols, ascorbic acid content, and antioxidant activities in tomato juice.
Figures
(6)
Tables
(2)