-
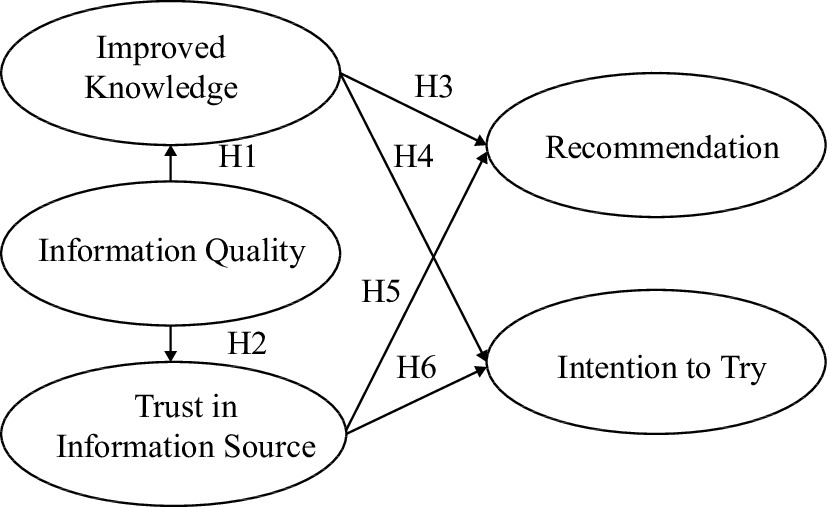
Figure 1.
Literature review and hypothesis development.
-
Latent variables and observed indicators Standardized factor loading T-value3 Information quality (α = 0.95, CR = 0.95, AVE = 0.751) Information contained in the brochure 1. Provides accurate information. 0.85 –2 2. Provides current and timely information. 0.82 22.53 3. Provides relevant information. 0.86 18.98 4. Provides easy-to-understand information. 0.90 20.04 5. Provides believable information. 0.91 20.54 6. Provides information at the right level of detail. 0.85 18.39 Consumer improved knowledge (α = 0.89, CR = 0.90, AVE = 0.65) 1. After reading the pecan brochure, I feel very knowledgeable about pecan. 0.76 – 2. If a friend asked me about pecan nutritional and health benefits, I could give them advice. 0.80 14.71 3. Pecans are a good source of fiber, healthy fats, protein, and various vitamins and minerals. 0.81 12.56 4. After reading the pecan brochure, I have learned that pecans are healthy nuts that provide various nutritional benefits. 0.86 13.58 Trust in information source (α = 0.95, CR = 0.95, AVE = 0.85) 1. I believe that the organization that developed this brochure is trustworthy. 0.93 – 2. I trust the information contained in the brochure. 0.91 25.36 3. You can expect sound advice from the organization that developed the brochure. 0.93 27.47 Willingness to recommend (α = 0.91, CR = 0.91, AVE = 0.79) 1. After reading the pecan brochure, I would recommend pecan to my family and friends. 0.77 – 2. After reading the pecan brochure, I would share with my family and friends about the pecan's health benefits. 0.97 17.40 3. After reading the pecan brochure, I would share the information from this pecan brochure with others. 0.91 16.78 Intention to try (α = 0.89, CR = 0.89, AVE = 0.81) 1. I will try eating pecan in the next few weeks. 0.88 – 2. I plan to try pecan in the next few weeks. 0.92 13.34 1. α = Cronbach’s alpha, CR = composite reliability, AVE = average variance extracted
2. '–' means the path parameter was set to 1. Therefore, no t-value was given.
3. All loadings are significant at a 0.001 levelTable 1.
Confirmatory factor analysis for the constructs.
-
Relationships Std. coefficient S.E. T-value P-value Results H1 Information Quality → Improved Knowledge 0.59 0.05 8.90 ≤ 0.001 Supported H2 Information Quality →
Trust in Information Source0.48 0.06 7.90 ≤ 0.001 Supported H3 Improved Knowledge → Willingness to Recommend 0.45 0.09 6.80 ≤ 0.001 Supported H4 Improved Knowledge → Intention to Try 0.38 0.11 4.29 ≤ 0.001 Supported H5 Trust in Information Source → Willingness to Recommend 0.22 0.07 3.52 ≤ 0.001 Supported H6 Trust in Information Source → Intention to Try 0.10 0.08 1.24 > 0.05 Unsupported Table 2.
Results of hypotheses testing.
Figures
(1)
Tables
(2)